

Summary
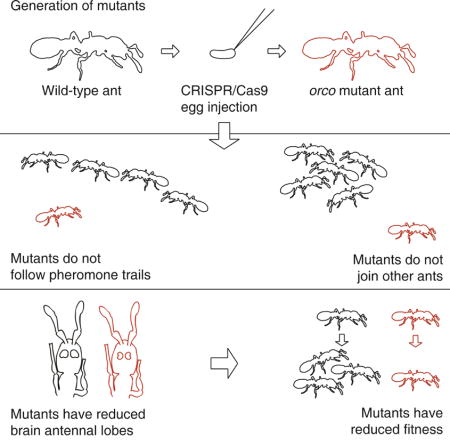
Life inside ant colonies is orchestrated with diverse pheromones, but it is not clear how ants perceive these social signals. It has been proposed that pheromone perception in ants evolved via expansions in the numbers of odorant receptors (ORs) and antennal lobe glomeruli. Here we generate the first mutant lines in the clonal raider ant, Ooceraea biroi, by disrupting orco, a gene required for the function of all ORs. We find that orco mutants exhibit severe deficiencies in social behavior and fitness, suggesting they are unable to perceive pheromones. Surprisingly, unlike in Drosophila melanogaster, orco mutant ants also lack most of the approximately 500 antennal lobe glomeruli found in wild-type ants. These results illustrate that ORs are essential for ant social organization and raise the possibility that, similar to mammals, receptor function is required for the development and/or maintenance of the highly complex olfactory processing areas in the ant brain.
Keywords: Chemical Communication, CRISPR, Evo-Devo, Formicidae, Mutagenesis, Odorant Receptors, Ooceraea biroi, Pheromones
eTOC
Development of the first line of mutant ants, using CRISPR/Cas technology, reveals what happens inside of a colony when ants lose the ability to recognize odors.
Introduction
Ants live in complex societies and display sophisticated social behavior, including reproductive division of labor between queens and workers, behavioral division of labor between nurses and foragers, the formation of adaptive foraging networks, nestmate vs. non-nestmate discrimination, and collective nest construction (David Morgan, 2009; Grüter and Keller, 2016; Leonhardt et al., 2016; Richard and Hunt, 2013). All of these behaviors are largely mediated via chemical communication using a wide range of pheromones. In Drosophila, pheromone receptors have been identified that belong to multiple insect chemosensory receptor families, including odorant receptors (ORs), gustatory receptors (GRs), ionotropic receptors (IRs), and pickpocket channels (PPKs) (Kohl et al., 2015). Ants have numbers of GRs, IRs, and PPKs that are typical for insects, while their OR repertoire is highly expanded (McKenzie et al., 2016; Oxley et al., 2014; Smith et al., 2011a, 2011b; Zhou et al., 2012) (Figure 1A and Table S1). This raises the possibility that the expansion of ORs specifically, rather than chemoreceptors in general, may underlie the evolution of complex chemical communication in ants. Ants also have exceedingly large numbers of glomeruli in their antennal lobes, which likely mirror their expanded OR gene repertoire (McKenzie et al., 2016; Zube et al., 2008) (Table S1). Insect ORs function as chemosensory receptors by dimerizing with the highly-conserved co-receptor protein Orco to form ligand-gated ion channels (Jones et al., 2005; Larsson et al., 2004; Sato et al., 2008). orco null mutants in fruit flies, locusts, mosquitoes, and moths therefore lose OR function and show impaired responses to odorants such as food volatiles and sex pheromones (Asahina et al., 2008; DeGennaro et al., 2013; Koutroumpa et al., 2016; Li et al., 2016; Yang et al., 2016). Thus, orco constitutes a prime candidate to test the hypothesis that the expanded OR repertoire of ants is required for chemical communication.
Figure 1. Number of OR Genes and orco Mutagenesis.
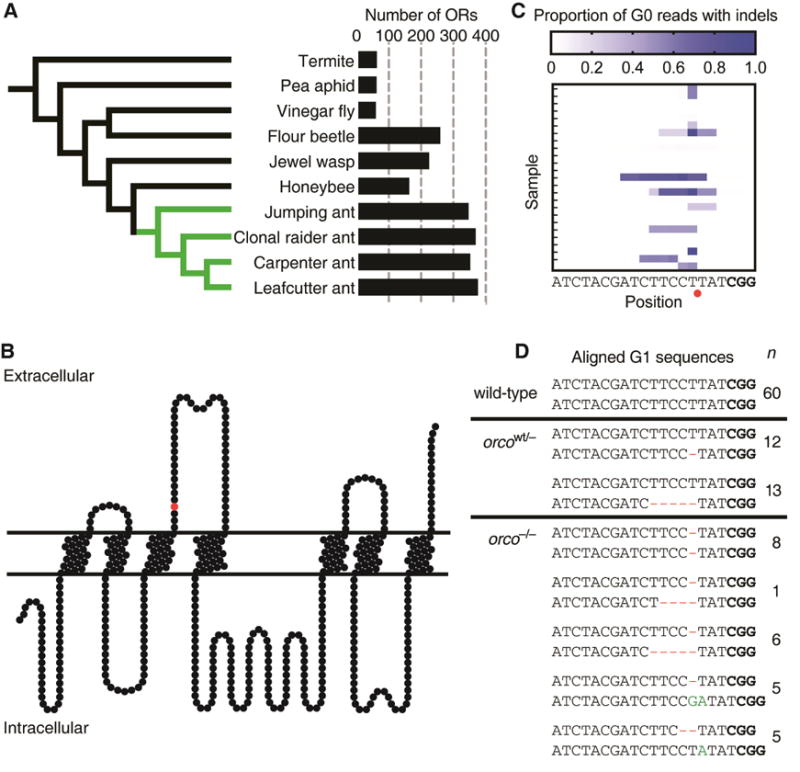
(A) Phylogeny with numbers of ORs for ants (green) and other insects (black), showing ant OR expansion (Table S1). (B) Position of predicted CRISPR/Cas9 cut site in Orco protein model (red circle). Frameshift mutations at this position truncate the wild-type protein between the third and fourth transmembrane domains, and the resultant mutant protein is unlikely to form functional ion channels. (C) Proportion of Illumina sequencing reads of orco amplicons with insertions or deletions (indels) relative to gRNA sequence in G0s, showing mutation rates of at least 97% in some individuals. Red circle indicates predicted CRISPR/Cas9 cut site. Protospacer adjacent motif (PAM) in bold. (D) Wild-type orco sequence compared to sequences for the two orcowt/− and the five orco−/− mutant lines. Deletions are shown in red and insertions in green. orco−/− ants have two frameshift alleles and are therefore expected to be complete loss-of-function orco mutants. Each of these lines arose independently; n indicates the number of ants of each line (G1s and subsequent generations) used across all experiments in this study (see Table S3 for a description of the lines used in each specific experiment). PAM in bold. See also Figure S1 and Tables S1–S2.
The receptor families involved in pheromone perception in ants have not been functionally characterized, in part because the complex life cycle of ants has hindered the development of functional genetic tools (Grüter and Keller, 2016; Kohno et al., 2016; Reid and O’Brochta, 2016; Schulte et al., 2014). Indeed, to this point no mutant lines in ants have been generated (e.g., using trangenesis, random mutagenesis, or targeted mutagenesis). Most ant species reproduce sexually, so generating homozygous mutant lines requires multiple generations of crosses, which is challenging given that the generation times of ants tend to be many months (Yan et al., 2014). Furthermore, performing such crosses raises methodological concerns, as inbreeding individuals to generate homozygous mutants also has the potential to homozygose off-target mutations (Fu et al., 2013). In other model organisms this issue can be addressed by using multiple generations of outcrossing, but this is not feasible in species with long generation times such as ants (Fu et al., 2013; Kistler et al., 2015). Thus, most ant species pose major challenges to the generation of mutant lines that can be used to generate reliable scientific results.
In this study, we take advantage of the unique biology of the clonal raider ant, Ooceraea biroi, to generate the first mutant lines in ants. This species is a promising genetic model system because, unlike most other ant species, O. biroi reproduces via parthenogenesis, so stable germ-line modifications are obtained from the clonal progeny of injected individuals without laboratory crosses (Oxley et al., 2014). On the other hand, this unusual reproductive system implies that it will be challenging to conduct laboratory crosses for other purposes. O. biroi also has a generation time of approximately 2 months, which is among the shortest known for any ant species (Oxley et al., 2014). Here we develop a CRISPR/Cas9 protocol in O. biroi and use this technique to create orco null mutants, allowing us to conclusively test the role of ORs in chemical communication in ants. To reduce the potential for off-target mutagenesis, we designed a gRNA that has a unique sequence relative to the rest of the genome (see STAR Methods) and characterized multiple independently-generated lines of heterozygous and homozygous orco mutants. We find that orco mutant ants, as expected, lack Orco antibody staining and possess deficiencies in general olfactory behaviors. These ants also have deficiencies in social behavior, including an inability to nest with other ants or follow pheromone trails, and exhibit reduced fitness. In contrast with previously studied insects, we also find that orco mutant ants possess striking neuro-anatomical phenotypes, including a loss of olfactory sensory neurons (OSNs) in the antennae and a striking reduction in the number of glomeruli in the antennal lobes. Collectively, these results illustrate the crucial significance of orco and ORs in ant biology.
Results
Generation of orco Mutant Ants
We confirmed the identity of orco in the O. biroi genome (Table S2, Figure S1) and designed and synthesized a guide RNA (gRNA) to target orco (Figure 1B). To produce orco mutants, we injected Cas9 protein and gRNA into 3,291 eggs less than 5h of age and produced 42 G0 adults, some of which displayed mutations in at least 97% of PCR amplicons of the orco target site (Figure 1C, STAR Methods). GO mutations in the germline can be inherited by G1 s to produce stable modifications to the genome (Reid and O’Brochta, 2016). Given that O. biroi reproduces through parthenogenesis (Oxley et al., 2014), stable mutant lines can be clonally propagated from individual mutant G1s and subsequent generations. orco loss-of-function mutant lines are thus derived from G1 eggs with independent frameshift mutations in both orco alleles. We recovered a diverse set of orco mutant lines, including two orcowt/− lines with one frameshift allele and five orco−/− lines with two frameshift alleles (Figure 1D). The phenotypes reported below were consistent across the two orcowt/− lines and across the five orco−/− lines, respectively. Descriptions of the specific lines used in each experiment along with the associated phenotypes for each individual are given in Table S3.
Antennal Morphology
To test whether orco frameshift mutations cause a loss of the full-length Orco protein and/or change the distribution of olfactory sensory neurons (OSNs), we immunostained O. biroi wild-type and orco mutant antennal sections with an Orco antibody and counterstained the cell nuclei with DAPI. Wild-type and orcowt/− O. biroi antennae contained a dense region of Orco-positive OSNs in the center of the antennal club, as indicated by DAPI and Orco staining (Figure 2A, Figure S2A,B). As predicted, antennae of orco−/− ants lack Orco staining, indicating that the full-length Orco protein is absent (Figure 2B, Figure S2C). Surprisingly, the majority of OSNs in the O. biroi antenna are also absent in orco mutants, as indicated by a reduction in DAPI signal (Figure 2B, Figure S2C). This result suggests that the orco-positive OSNs in the O. biroi antenna are absent in orco mutants, but that the smaller number of other types of sensory neurons may remain present. This contrasts with D. melanogaster, in which the antennal OSNs that express orco in wild-types are still present in orco mutant adults (Chiang et al., 2009).
Figure 2. Loss of Orco Expression and OSNs in orco−/− Ants.
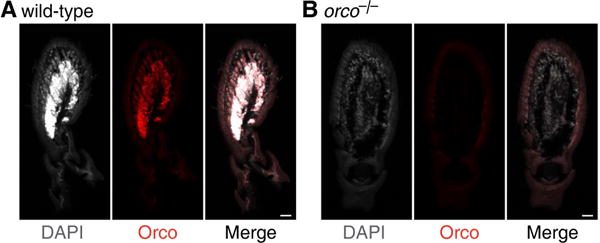
(A) Antennal section of wild-type O. biroi showing DAPI counterstain (grey), Orco immunostain (red), and the merged image (black). Wild type ants possess a dense region of Orco-positive OSNs in the center of the antenna. (B) Antennal section of orco−/− ant. orco−/− ants lack Orco staining, indicating that the full-length Orco protein is absent. orco−/− ants also lack the dense region of cells in the center of the antenna, indicating that most or all of the OSNs that would express orco in wild-types are absent in orco−/− ants. Scale bars are 20 μm.
Antennal Lobe Morphology
In D. melanogaster, all antennal lobe glomeruli that have been examined remain present in orco mutants, implying that OR function is not required for gross antennal lobe morphology (Chiang et al., 2009; Larsson et al., 2004). These results contrast strongly with mice, where olfactory receptor function and neuronal activity are essential for the formation and maintenance of the analogous brain region, the olfactory bulb (Yu et al., 2004). However, D. melanogaster has only 60 ORs and a similar number of glomeruli, while mice possess over one thousand olfactory receptors and glomeruli. This striking difference suggests that complex olfactory systems must rely on receptor function for their development and/or maintenance. Ants have highly expanded numbers of ORs and antennal lobe glomeruli (McKenzie et al., 2016; Oxley et al., 2014; Zhou et al. 2012; Zube et al., 2008;) (Table S1), raising the possibility that the development and/or maintenance of ant antennal lobes may require additional mechanisms to exceed the complexity found in other insects.
To address whether OR function might be required for the structure of the ant antennal lobe we imaged brains using confocal microscopy, measured antennal lobe volumes and the number of glomeruli, and reconstructed antennal lobes in wild-type and orco mutant adults in O. biroi and D. melanogaster. We found that the antennal lobes of orco−/− ants measured only one third of the volume of wild-type and orcowt/− antennal lobes, and approximately 82% of the glomeruli were lost (Figure 3A,B and Movie S1). However, all six glomeruli in the T7 cluster of the ant antennal lobe, which is believed to be innervated by olfactory sensory neurons that do not express ORs (Nakanishi et al., 2010), were still present in orco−/− individuals. No differences were observed in the volume of the protocerebrum, mushroom bodies, or central complex relative to wild-type ants (p = 0.45, 0.17, and 0.20, respectively; t-test). In contrast, we detected no significant difference in antennal lobe volumes and only minor potential differences in glomerulus numbers between wild-type and orco−/− flies (Figure 3C,D, Movie S1, and STAR Methods). To test whether antennal lobes degenerate as a function of age in orco−/− flies, we imaged antennal lobes of additional wild-type and orco−/− flies aged for 30 days, showing that antennal lobe glomeruli were not reduced (Figure 3C). These results demonstrate that development and/or maintenance of antennal lobes in ants, but not flies, are indeed dependent on Orco function.
Figure 3. Reduced Antennal Lobes in orco−/− Ants.
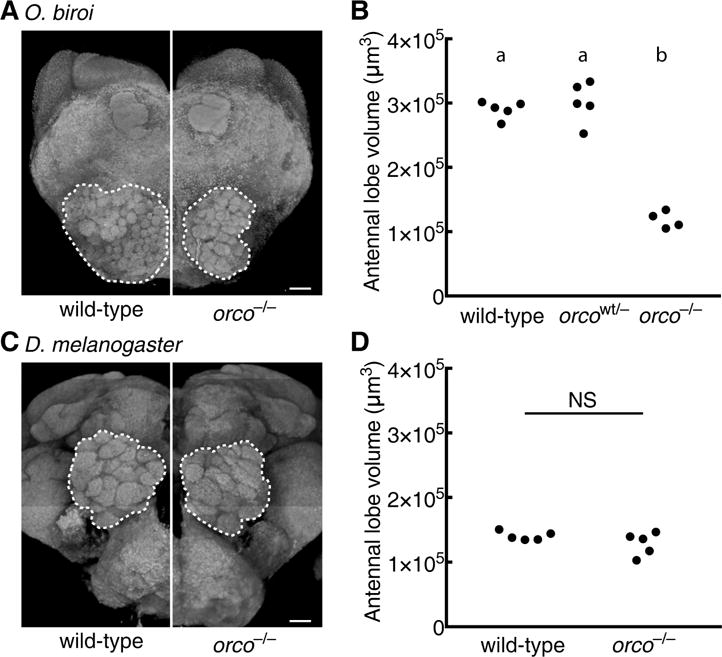
O. biroi: (A) Dorsal (n-ventral) 3D projections of orco−/− and wild-type ants. Antennal lobes indicated by dashed lines. orco−/− antennal lobe is highly reduced relative to wild-type. Two orco−/− ants had 90 and 91 glomeruli relative to 493 and 509 glomeruli for two wild-type ants (one of the wild-type reconstructions has been published previously (McKenzie et al., 2016)); small differences between replicates within treatments might reflect reconstruction errors or actual biological variation. (B) Antennal lobe volumes for wild-type (n = 5), orcowt/− (n = 5), and orco−/− (n = 4) ants (orcowt/− and orco−/− were age-matched at approximately 4 months old). orco−/− ants, but not orcowt/− ants, have significantly smaller antennal lobes than wild-type. D. melanogaster: (C) Anterior (n-ventral) 3D projections for wild-type and orco−/− brains from one month old flies. Antennal lobes indicated by dashed lines. orco−/− antennal lobe is similar to wild-type. Two orco−/− flies had 43 and 44 glomeruli, and two wild-type flies each had 46 glomeruli. These glomerulus numbers were higher than has been previously reported, which is likely due to differences in sample preparation and imaging techniques. Slight differences in glomerulus numbers between replicates may be due to reconstruction errors, or may reflect modest antennal lobe phenotypes in orco mutant flies (STAR Methods). (D) Antennal lobe volumes for wild-type (n = 5) and orco−/− (n = 5) flies. Volumes of wild-type and orco−/− antennal lobes are not significantly different (p = 0.20, t-test). Scale bars are 20 μm. NS: not significant. Genotypic classes marked by different letters are significantly different (p < 0.05) after ANOVA followed by Tukey’s test (B). See also Tables S1 and S3.
Behavioral Phenotypes
Based on the general observation that ants are often repelled by the smell of permanent markers, we developed a simple assay to test whether orco mutants have compromised chemosensory abilities. We found that wild-type and orcowt/− O. biroi are indeed strongly repelled by lines drawn with Sharpie™ permanent marker, and rarely contact or cross Sharpie lines (Figure 4A–C). Given that O. biroi is blind and that the ants are often repelled before touching the Sharpie lines (Movie S2), it is clear that this behavior is mediated via olfaction, rather than visual or tactile cues. However, orco−/−. biroi are significantly less repelled by Sharpie (Figure 4A–C and Movie S2), implying that orco is required to perceive the odorants that cause Sharpie lines to be repulsive. These results suggest that orco mutant ants possess general olfactory deficiencies, similar to orco mutants in other types of insects (Asahina et al., 2008; DeGennaro et al., 2013; Koutroumpa et al., 2016; Li et al., 2016; Yang et al., 2016).
Figure 4. Deficient Olfactory and Social Behavior in orco−/− Ants.
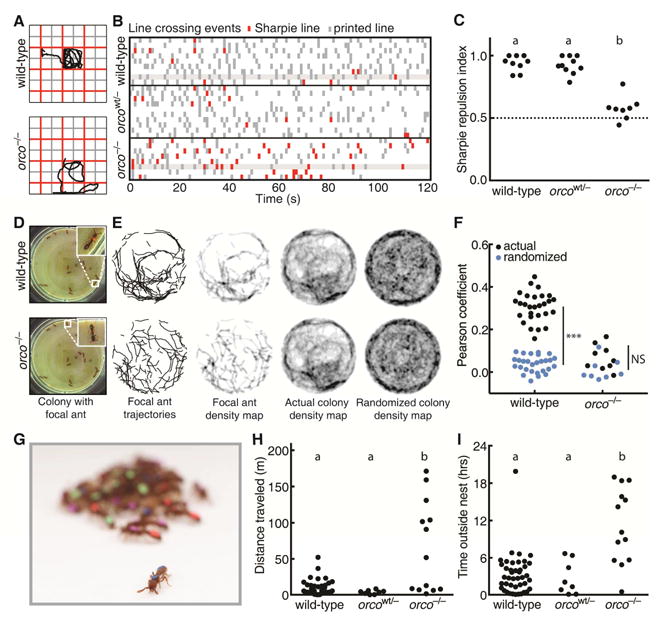
(A) Example trajectories of wild-type and orco−/− ants in Sharpie assay. (B) Line crossing events for wild-type (n = 9), orcowt/− (n = 10), and orco−/− (n = 8) ants in Sharpie assays, with ants from Figure 4A highlighted. Wild-type and orcowt/− ants cross Sharpie lines (red) less frequently than printed lines (grey), but orco−/− ants cross both lines at approximately equal frequencies. (C) Repulsion indices for ants in Sharpie assays. Repulsion index is calculated as proportion of printed line crosses. orco−/− ants, but not orcowt/− ants, are significantly less repelled than wild-types. (D) Example colony used for trail pheromone analysis. The same colony, containing a mixture of wild-type, orcowt/−, and orco−/− ants, is shown twice, with a wild-type or orco−/− focal ant highlighted. (E) Example trail pheromone analysis. Trajectories, during which ants were moving and edges were excluded, were used to create 2-D histograms, or density maps, for each ant in the colony. These density maps were compared to the actual and randomized density maps for all other ants in the colony. The wild-type density map is more strongly correlated with the actual colony density map than with the randomized colony density map, while the orco−/− density map is poorly correlated with both colony density maps. (F) Pearson correlation coefficients for individual ant density maps with the actual or randomized density map of the other ants in the colony. Pearson correlation coefficients for wild-type ants (n = 28), but not for orco−/− ants (n = 9), were significantly higher in actual than randomized density maps (sample sizes were too small to test orcowt/−). (G) Example colony showing an individual outside of the nest. (H) Distances traveled in 24 hr videos by ants in experimental colonies. orco−/− ants (n = 10), but not wild-type (n = 40) or orcowt/− (n = 8) ants, exhibit a wandering phenotype. (I) Time without contacting other ants in 24 hr videos. orco−/− ants spend more time without contact than wild-type or orcowt/− ants. ***p < 0.001; NS: not significant. Genotypic classes marked by different letters are significantly different (p < 0.05) after ANOVA followed by Tukey’s test (C), or from log-likelihood ratio tests on generalized linear mixed models followed by Tukey’s tests with colony as a random variable and actual/randomized maps (F) or genotypic class (H,I) as fixed variables. See also Figure S3 and Table S3.
Pheromone trails are a major feature of chemical communication in many ants, and are important for coordinating collective behaviors (David Morgan, 2009; Zube et al., 2008). In many doryline ants, including O. biroi, disturbance of colonies leads to robust trail formation, likely for the purpose of nest relocation (Gotwald, 1995, p. 99; Hölldobler, 1982; Schneirla, 1971, p. 94). To test whether orco influences the ability of O. biroi to follow pheromone trails, we set up 5 experimental colonies composed of 12–14 identically-reared G1s with wild-type, orcowt/−, and orco−/− genotypes, and individually tagged each ant with color dots (Figure 4D). We recorded videos of each colony and used a novel custom-built automated behavioral tracking system employing painted color tags (rather than paper barcodes (Mersch et al., 2013)) to individually identify the ants and quantify their behavior (Figure 4D, Figure S3, and Movies S3,S4). We disturbed each colony at the beginning of each video, causing the colonies to form conspicuous trails. During the ensuing period of high activity, we created a 2-D histogram, or density map, of movement for each ant, and measured the Pearson correlation coefficient of this density map with the density map of the other ants in the colony, reasoning that density maps would be more highly correlated when ants were following pheromone trails (Figure 4E,F). To provide a null expectation, we also compared the density maps of individual ants to a randomized density map of other ants in the colony (Figure 4E,F). We found that the density maps of individual ants had significantly higher correlations with the density maps of the rest of the ants in the colony than with the randomized density maps in wild-type, but not orco−/−, ants (Figure 4F; average correlation coefficients were 0.31 versus 0.04 in wild-type and 0.07 versus 0.02 in orco−/−, respectively). These findings imply that trail following behavior is reduced or absent in orco−/− ants, likely because they are unable to perceive chemical pheromone trails.
Nesting behavior, and the formation of aggregations more generally, is a ubiquitous feature of social insect biology (Depickere et al., 2004). Immediately upon eclosion, we noticed that some G1s did not nest with other ants, but instead showed a wandering phenotype (Figure 4G). In a set of 16 G1 colonies, we used this wandering phenotype to identify colonies containing orco−/− ants with 100% accuracy (p < 0.001, Fisher exact test, see STAR Methods). To more precisely measure nesting behavior in orco mutants, we recorded and analyzed 24 hr videos of each experimental colony. We found that wildtype and orcowt/− ants aggregated into tight clusters and exhibited little movement outside the cluster, while orco−/− ants frequently exited the cluster and wandered around the dish (Figure 4H, Movie S3). Overall, orco−/− ants spent a significantly larger fraction of time without contact with other ants when compared to wild-type and orcowt/− ants (Figure 4I). These findings demonstrate that typical nesting behavior is compromised in orco−/− ants. This observation is consistent with the idea that orco mutants are unable to perceive odorants, such as aggregation pheromones (Bell et al., 1972; Depickere et al., 2004; Li et al., 2016), that might be involved in nesting behavior.
Fitness of orco Mutants
Finally, we investigated whether orco mutations influence fitness by measuring egglaying and survival rates of wild-type and orco mutant ants. We found that orco−/− ants laid significantly fewer eggs than wild-type and orcowt/− ants over a two week period (Figure 5A), and orco−/− ants exhibited significantly higher mortality than wild-types over a 34 day period (Figure 5B). These results contrast with orco mutant Drosophila and mosquitoes, in which no fitness effects are observed under typical laboratory rearing conditions (Asahina et al., 2008; DeGennaro et al., 2013). This suggests that the orco mutant phenotype has serious consequences for ant fitness (for a discussion of the potential role of off-target effects see STAR Methods). It is possible that these fitness effects result because orco−/− ants are unable to integrate into the colony, as wandering behavior and reduced fitness are also seen in wild-type ants that are kept in social isolation (Koto et al., 2015).
Figure 5. Reduced Fitness in orco−/− Ants.
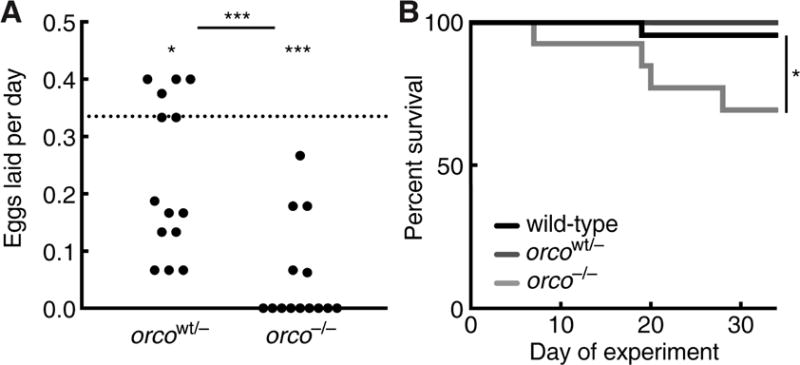
(A) Eggs laid per day over a two week period by orcowt/− (n = 12) and orco−/− (n = 14) ants relative to wild-type average (dotted line). orco−/− ants laid significantly fewer eggs than orcowt/− ants. Both orcowt/− and orco−/− ants laid significantly fewer eggs than the wild-type average of 0.34 eggs per day. Wild-type data are given as an average, rather than individual values, because most ants in each colony were wild-type and it was therefore not possible to obtain individual egg-laying rates for wild-type ants (see STAR Methods). (B) Survival of identically-reared and age-matched wild-type (n = 42), orcowt/− (n = 7), and orco−/− (n = 13) ants over a 34 day period. Survival of orco−/− ants was significantly lower than that of wild-type ants. Survival of orcowt/− ants was not statistically tested due to small sample size, but no trend toward reduced survival was observed. *p < 0.05; ***p < 0.001; NS: not significant. p values from an unpaired two-way Wilcoxon test (comparison of orcowt/− and orco−/− egg-laying rates) and one-way Wilcoxon tests (comparisons of orcowt/− and orco−/− egg laying rates to wild-type) using the mean egg-laying rate of wild-type ants in this experiment (A) or from a Fisher exact test (B). See also Table S3.
While we observed many striking deficiencies in orco−/− ants, it is important to note that these ants are viable, feed, lay eggs, and may still exhibit some typical social behaviors. For example, we have observed orco−/− ants groom eggs, touch other ants with their antennae, and elicit alarm responses (Movies 3,4). Thus, orco mutants will provide an important resource to study the role of ORs in ant biology in the future.
Discussion
We have demonstrated that orco is crucial for many aspects of ant biology, including individual responses to repulsive odorants and pheromones, and fitness. Surprisingly, we also found striking neuro-anatomical phenotypes in orco mutant ants at the level of the antennae and antennal lobes. In D. melanogaster, orco mutants possess normal numbers of OSNs, and ablation of orco-expressing neurons in adults does not cause the loss of antennal lobe glomeruli (Berdnik et al., 2006). However, experiments in D. melanogaster, as well as honeybees and moths, indicate that OSNs are likely required for the formation of the antennal lobe glomeruli (Gascuel and Masson, 1991; Jhaveri and Rodrigues, 2002; Malun et al., 1994). Thus, it is likely that the development, but not maintenance, of insect antennal lobe glomeruli is dependent on the presence of OSNs. Unlike in D. melanogaster, we observed that orco mutant ants lack the majority of OSNs and antennal lobe glomeruli. We therefore hypothesize that the antennal lobe phenotype in orco mutant ants results because the OSNs that typically express Orco either fail to develop or die early in development, preventing the formation of OR glomeruli.
orco mutant O. biroi possess about 90 antennal lobe glomeruli, which is more than the total of non-OR chemosensory receptors that have been identified in the genome (Oxley et al., 2014). Interestingly, half of the remaining glomeruli appear to be in the T6 cluster, which is believed to be composed entirely of OR glomeruli (McKenzie et al., 2016). Therefore, it is likely that some OR glomeruli are still present in orco mutant ants. We propose that the initial formation of OR glomeruli in O. biroi is independent of orco function, similar to D. melanogaster, but the subsequent expansion to large numbers of glomeruli is orco dependent (possibly due to OSN innervation and/or OR function). If this model is correct, then this orco dependent stage of glomerulus expansion could represent an evolutionary change in the development of ants relative to flies that is related to the evolution of expanded OR repertoires. Inspired by our initial findings, colleagues decided to also examine brains of a second ant species in which they had generated an orco mutant, and they found an antennal lobe phenotype similar to what we had observed in O. biroi (reported in this issue of Cell, Yan et al., 2017). These results further indicate that the role of orco in neuro-anatomy is likely conserved throughout the ants.
It is tempting to describe these striking neuro-anatomical phenotypes as activity-dependent neuroplasticity, but we believe that this would not be warranted based on the present data. It is possible that OR-mediated neuronal activity is required for the development or maintenance of OR glomeruli, and that environmental influences on neuronal activity (such as sensory deprivation) could therefore lead to the same loss of OR glomeruli that we observed in orco mutant ants. On the other hand, it is also possible that these phenotypes are unrelated to plasticity if the loss of OR glomeruli is not activity dependent. For example, orco could play a role in antennal lobe development mediated by transcriptional regulation, the survival of OSNs, or response to signaling molecules. We have demonstrated that orco (and therefore likely OR function) is essential for typical adult neuro-anatomy, but future experiments will be required to test whether these phenotypes arise due to its canonical role in neuronal activity, or if orco in ants may possess additional biochemical functions.
While the neuro-anatomical phenotypes we observed in these orco mutants are largely unprecedented, the behavioral phenotypes are consistent with a generally reduced olfactory capacity as has been seen in orco mutants of other types of insects. These phenotypes therefore likely result from peripheral sensory deficiencies affecting communication, rather than from more specific effects on social cognition. Chemosensation is arguably the primary sensory modality in ants, particularly in a blind species such as O. biroi, so behavioral and fitness phenotypes in orco mutant ants may be generally expected to be more obvious than in insects that rely more heavily on other senses (Asahina et al., 2008; DeGennaro et al., 2013; Koutroumpa et al., 2016; Li et al., 2016; Yang et al., 2016).
More than half of the data presented here were collected using G1 ants (Table S3). G1 adults in O. biroi can be obtained just four months after performing injections, which is much quicker than any other social insect model system (Yan et al., 2014). Thus, the clonal raider ant provides a unique opportunity to rapidly generate and phenotype mutant lines in a social insect. While all data in the present study were collected from germ-line mutants (G1s and subsequent generations), we also found very high somatic cut-rates among the G0 ants (Figure 1C). Multiple G0s displayed nearly 100% mutation rates, and exhibited wandering phenotypes similar to germ-line mutants in subsequent generations (Figure 1C, STAR Methods). Thus, our results show that CRISPR/Cas9 can have very high efficiency in social insects and may be useful for conducting experiments in G0s even in the large number of species where it is not feasible to maintain stable mutant lines.
Major transitions in evolution require the coordinated action of individuals to operate as a functional, higher-level unit (Maynard Smith and Szathmary, 1997). During the transition from solitary to eusocial living in ants, this coordination was largely achieved via pheromones, and ants accordingly possess highly expanded antennal lobes and OR repertoires. Our results illustrate the functional significance of these striking changes, and imply that the expansion of ORs may have been an important component of the evolution of eusocial behavior.
STAR Methods
Key Resources Table
CONTACT FOR REAGENT AND RESOURCE SHARING
Further information and requests for resources and reagents should be directed to and will be fulfilled by the Lead Contact Daniel JC Kronauer (dkronauer@rockefeller.edu).
EXPERIMENTAL MODEL AND SUBJECT DETAILS
Ooceraea biroi colonies were maintained at 25 °C in circular Petri dishes (50 mm diameter, 9 mm height) with a plaster of Paris floor ca. 4 mm thick. Colonies were fed 3 times weekly with fire ant (Solenopsis invicta) brood and cleaned and watered at least once per week. Two O. biroi clonal lines, which are genetically distinguishable at the mitochondrial cytochrome oxidase subunit 1 (CO1) gene (Kronauer et al., 2012), were used in this study. All experimental ants belonged to Line B, while Line A ants were only used as chaperones to raise experimental Line B individuals. Experimental ants were reared by placing Line B larvae (G0s) or eggs (G1s and subsequent generations) in colonies of 20 Line A chaperones, and chaperones were removed once the callows had eclosed. This rearing method results in a small fraction of Line A offspring of chaperones in colonies with the G0s and subsequent generations. For this reason, all individuals were genotyped following experiments, and Line A individuals were removed from all analyses. All experimental colonies in this study had eggs removed twice weekly so that adults were maintained without larvae or pupae. All individuals, including those that died during experiments, were genotyped (see below) to determine their clonal line, and orco amplicons from Line B individuals were sequenced to determine orco genotype.
METHOD DETAILS
CRISPR Methods
Confirmation of the O. biroi orco identity
Candidate orco orthologs for eight insect species were detected as reciprocal best hits using phmmer (Eddy, 1998) with D. melanogaster orco (flybase id: FBgn0037324) as the initial query sequence (Table S2). To confirm orthology, homologs ±50% the length of orco were aligned with MAFFT (Katoh and Standley, 2013) using default parameters. This alignment was then used to construct a bootstrapped phylogeny with RAxML (Stamatakis, 2006), providing unambiguous support for a single copy ortholog of orco in O. biroi (Figure S1).
Design of orco gRNA
Identification of cut sites and assessment of off-target sites was performed using the script cris.py, part of the genomepy package (commit #94cc628), available at https://github.com/oxpeter/genomepy. The genomic sequence for O. biroi orco was searched on both strands for the CRISPR guide RNA (gRNA) recognition sequence 5′-N20NGG-3′ using BLASTN (Altschul et al., 1990) and checked for off-target hits using CRISPRseek (Zhu et al., 2014). We detected no off-target sites with 2 or less mismatches and only one site with 3 mismatches for our orco gRNA, which is expected to lead to low or no off-target cutting (Fu et al., 2013).
Potential off-target effects
It has been shown that in some cases CRISPR/Cas9 injections can lead to off-target mutagenesis that in turn can give rise to non-specific phenotypes (Fu et al., 2013). In the present study we used multiple measures of precautions, making it highly unlikely that the phenotypes we report arise due to off-target effects. First, we used a high-quality reference genome to design the gRNA in this study to have no additional target sites in the genome that are likely to lead to off-target cutting (Fu et al., 2013; Oxley et al., 2014). Second, mutations induced by Cas9 are stochastically generated (Fu et al., 2013), such that any off-target effects would likely be present in some G1 lines but not others. The phenotypes we report are consistent across five independently generated orco−/− ines, and we do not observe the same phenotypes across two independently generated orcowt/− lines (Table S3). Third, the striking reduction of OSNs and antennal lobes in orco mutant ants are phenotypes specific to the ant chemosensory system that are unlikely to arise from random off-target effects. These phenotypes provide a direct functional link between the orco−/− genotype and the chemosensory deficiencies described in this study. Importantly, the antennal lobe phenotype was entirely discrete: every orco−/− brain had substantially smaller antennal lobes than any orcowt/− or wild-type brain, even though this phenotype was measured across multiple independently derived orco−/− and orcowt/− lines (Figure 2b, Table S3). Therefore, while we cannot exclude the possibility that our injections gave rise to some level of off-target mutations, it is unlikely that the specific phenotypes reported in this study arise from off-target effects.
CRISPR reagent preparation
Recombinant Cas9 protein was purchased from PNAbio, and gRNA was synthesized via in-vitro transcription from PCR amplicons (Kistler et al., 2015). Activity of Cas9 and gRNA was validated using in-vitro digestion of PCR amplicons containing the gRNA recognition site with Cas9 and buffer from New England Biolabs. Immediately prior to injection, Cas9 and gRNA were mixed in water to produce a solution with 100 ng/μL Cas9 and 10 ng/μL gRNA.
Treatment of Eggs and Larvae
Egg collection
Eggs for injections were collected from egg-laying units consisting of 70 O. biroi adults without larvae or pupae. Eggs were collected and placed on double-sided tape with the ventral side up on a glass slide, and injected into the anterior end (Oxley et al., 2014). Slides were prepared with up to 80 eggs for injection and ~25 control eggs to validate incubation conditions.
We observed that the presence of eggs in O. biroi colonies inhibits the production of new eggs and employed this observation for efficient egg collection. Egg-laying units were left with eggs for 7 days to inhibit worker egg-laying. On day 0 eggs were removed to release inhibition, and on day 2 eggs were removed again to further prevent inhibition. This led workers to synchronously activate their ovaries, and on days 5, 6, and 7 eggs were collected for injection. Following day 7, eggs were not collected from these colonies for 7 days, causing workers to become inhibited, and the protocol was then repeated.
Eggs were collected from colonies under a stereoscope using insect pinning needles. On a typical injection day, eggs were removed from colonies from 10–11 am, and those eggs were used as uninjected incubation controls or fostered into rearing units. Eggs were collected for injections from 2–3 pm and 6–7 pm and injected from 3–4 pm and 7–8 pm, respectively. Therefore, all injected eggs were less than 5 hrs old, when O. biroi eggs are in a syncytial stage of development with <100 nuclei (Oxley et al., 2014). Typical egg-laying units produced 2–5 eggs per day, and we collected from up to 60 egg-laying units, injecting 100–300 eggs per day.
Egg injection
Injection needles were prepared as in previous studies (Lobo et al., 2006). Injections were performed using an Eppendorf Femtojet with a Narishige micromanipulator. The Femtojet was typically set to Pi 1800 hPa and Pc 500 hPa. Needles were broken by gently touching the needle against a capillary submerged in halocarbon oil. Alternatively, sharper needles were generated by setting the Femtojet to maximum pressure (6000 hPa) and lightly touching the capillary against fibers on the tape. Data in this manuscript result from a combination of both methods.
The anterior end of O. biroi eggs is slightly wider than the posterior end, and the ventral surface is concave while the dorsal surface is convex. To inject, eggs were placed on double-sided 3M tape (Model S-10079 from Uline) on a glass slide, with the anterior end forward and the ventral side upward. Eggs were injected into the anterior end, where nuclei are located in early O. biroi embryos (Oxley et al., 2014). The ventral side was placed upward, so that larvae hatched with the mouth facing away from the tape, which facilitated successfully recovering larvae from the tape. To inject, eggs were individually submerged in 1–2 μL drops of water. Eggs were gently pierced with the needle and injected for 1–2 seconds. During successful injections, little or no cytoplasm is discharged from the egg when the needle is removed. Preliminary trials showed that injection under liquid was necessary to remove the needle without rupturing the chorion, and that water led to higher survival than Ringer, PBS, or halocarbon oil. A video was recorded of every injection session, allowing us to verify that hatching larvae had been successfully injected.
Preliminary injections were conducted using multiple batches of reagents and variable Cas9 and gRNA concentrations. These trials suggested that hatch rates varied inversely with cutrates. Batch effects in hatch rates were observed across different days of injection within the same experimental treatment, requiring multiple injection days and large numbers of eggs (~400) to accurately estimate hatch rates of any given experimental treatment. In the final injection round, eggs were injected with either low (1800 hPa) or high (6000 hPa) pressure, with sharper needles and lower injection volumes used in injections with high pressure. 46 of 2535 eggs (1.8%) hatched after injections with low pressure, and 58 of 756 eggs (7.6%) hatched after injections with high pressure. 25 of the 42 G0s were Illumina sequenced (see orco sequencing), and we observed an average of at least 27% cutrates at the predicted cut site resulted from low pressure injections (n = 17) relative to 22% from high pressure injections (n = 8). orcowt/− and orco G1s were recovered from G0s injected with each method.
Egg incubation
Following injections, slides with eggs were incubated in air-tight plastic boxes (0.9L SpaceCube boxes from ClickClack). Incubation boxes were prepared with a plaster of Paris floor (85 g plaster of Paris mixed with 50 mL distilled water). The plaster was dried completely after casting, and water was then added until the plaster became saturated with moisture to determine the saturation volume. The plaster was then dried completely once again, after which 20% of the saturation volume of distilled water was added. This procedure produced suitable incubation conditions for 2 weeks, after which the plaster was discarded. Incubating eggs were checked daily, and any water that had condensed on the eggs was removed with Kimwipes™ tissue. Fungus frequently grew on injection slides. Growth was controlled by spacing the eggs at least ~2 mm apart and mechanically breaking up fungal hyphae and overgrown eggs in 100% ethanol using insect pinning needles. This egg-incubation protocol yielded ~60% hatch rates of uninjected control eggs, which is similar to hatch rates of eggs in laboratory colonies.
To synchronize hatching of larvae from injected eggs, eggs injected on days 5, 6, and 7 were incubated at different temperatures. Preliminary trials showed that eggs incubated at 25 °C hatch after 9–10 days, while eggs incubated at 30 °C hatch after 7–8 days. We therefore incubated eggs injected on days 5 and 7 at 25 °C and 30 °C, respectively, while eggs injected on day 6 were incubated at 25 °C for the first 5 days and then at 30 °C until hatching. This protocol resulted in most larvae hatching on days 14 and 15. Once hatching had commenced, larvae were manually removed from the egg membrane with an insect pinning needle, taking care to prevent them from becoming stuck to the double-sided tape. Eggs that were expected to hatch overnight were surrounded with a sheet of Parafilm® (stretched to be as thin as possible) to prevent larvae from falling onto the tape.
Larval rearing
To rear G0 larvae, uninjected control eggs slightly older than the eggs injected on day 5 were placed with ~20 adult Line A workers in a Petri dish with a plaster of Paris floor and maintained at 25 °C. These eggs hatched slightly earlier than the injected eggs, priming the workers to rear larvae derived from injected eggs. When the larvae hatched from injected eggs, control larvae were replaced with experimental (injected) larvae. Preliminary trials showed that higher survival was obtained by fostering a minimum of 7 larvae at a time, so control larvae were added to experimental larvae if insufficient experimental larvae were available. The G0 adults reported in this study therefore include an unknown fraction of adults derived from control larvae. Survival of larvae under these conditions was approximately 50%.
Tagging, Genotyping, and Sequencing
Tagging
All ants in behavioral and fitness experiments (Figures 4,5) were tagged with two color dots, one on the thorax and one on the gaster, using uni-Paint markers (models PX-20 or PX-21) such that each individual could be identified within the colony (Figure 4D,G). For automated behavioral tracking, four colors were used (blue, green, orange and pink) for a total of 16 unique combinations. Ants were tagged with a randomly assigned color pair at least 10 days prior to any behavioral experiments. Tagged ants had a leg removed for genotyping and sequencing either before (Figure 3A,B; Figure 4A–C) or after (Figure 4D–I; Figure 5) experiments.
Genotyping
To distinguish Line A and Line B, eggs and adults were genotyped using PCR of mitochondrial CO1 with standard DNA barcode primers (HCO and LCO, Folmer et al., 1994) followed by a restriction digest with MwoI from New England Biolabs. This enzyme cuts the PCR product derived from Line B, but not from Line A.
orco sequencing
To screen for orco mutations, we designed PCR primers that flanked the orco cut site and sequenced the resulting PCR products using Sanger and Illumina sequencing. Primer sequences were:
F: 5′TCGTCGGCAGCGTCAGATGTGTATAAGAGACAGTCCAACTTGCTGTAAATTTGGAT3′
R: 5′GTCTCGTGGGCTCGGAGATGTGTATAAGAGACAGCTCTTCTTGGTCGGCGGTA3′
Illumina methods followed a previously described protocol (Kistler et al., 2015). Primers included tails at the 5′ end (underlined) that were used as adapters to add indices to individual samples for Illumina sequencing (Kistler et al., 2015). Sequences were aligned to the orco genomic sequence and reads at each base pair that aligned with an insertion or deletion were counted with the script crispralign.py from the genomepy package, available at https://github.com/oxpeter/genomepy. orco amplicons from 25 of 42 recovered G0s were subjected to Illumina sequencing (Figure 1C). Three of these individuals, all of which were found to have nearly 100% mutation rates, displayed a wandering phenotype similar to the wandering phenotype observed in G1 s, indicating that somatic CRISPR in G0s may be useful for functional genetic studies even in the many social insect species where it is not logistically possible to generate or maintain stable mutant lines (Schulte et al., 2014; Yan et al., 2014).
Identification of mutant sequences
Mutant lines were identified via Sanger sequencing of eggs and adults of G1s and subsequent generations. All Sanger sequencing traces were scored manually. For the G1 dataset (below), manual identifications were verified by checking for misalignment against a reference sequence using MEGA (Kumar et al., 2016) and by using the program Mutation Surveyor (Softgenetics) for automated allele identification. Mutant lines were defined as groups of ants that possess identical orco genotypes, and orco amplicons from representatives of each mutant line were Illumina sequenced and individual reads were manually inspected to ensure both alleles were properly identified.
Neuro-anatomy
Immunohistochemistry
Immunofluorescence was performed as described previously (Dobritsa et al., 2003; Pitts et al., 2004). Antennae were removed and prefixed in a solution of 4% paraformaldehyde in PBS with 0.1% Triton (PBSTx) for 30–60 minutes at room temperature then rinsed three times with PBST. Due to the scarcity of material, antennae were collected from wild-type and orco−/− ants that had died less than 24 hr previously. Antennae were stored overnight in a solution of 25% sucrose in PBST at 4°C, then embedded in Tissue-Tek OCT (Sakura Finetek, Torrance, CA) and frozen. Antennae were sectioned at 12 μm at −20°C and allowed to dry at room temperature for 3 hr. Slides were then fixed in 4% paraformaldehude in PBSTx at room temperature for 30 min, rinsed, then blocked with PBSTx plus 5% normal goat serum (NGS, Vector Laboratories) at room temperature for 60 min. An anti-Orco polyclonal mouse antibody (gift from Vanessa Ruta) was diluted 1: 1000 in PBSTx plus 5% NGS and incubated on slides at room temperature overnight. Slides were rinsed and incubated with secondary Alexa594 donkey anti-mouse (Invitrogen) at a 1:500 dilution in PBSTx plus 5% NGS at room temperature for 2 hr then rinsed. Nuclei were labed using DAPI diluted to 1 μg/mL in PBS at room temperature for 20 min followed by a brief wash in water. Slides were mounted with Dako Fluorescent mounting medium. Images were captured using a confocal microscrope (Zeiss LSM 780).
Glomerulus counts and antennal lobe volumes
One of the wild-type O. biroi antennal lobe reconstructions was based on published data (McKenzie et al., 2016). For the remaining data, D. melanogaster and O. biroi brains were dissected in PBS and immediately transferred to a fixative solution of either 1% glutaraldehyde or 2% PFA and 2.5% glutaraldehyde in PBS, and fixed at room temperature on a shaker for 1–30 days. To dehydrate, brains were rinsed in PBS and then suspended for 5 minutes each in an ascending series of 50%, 70%, 90%, 95%, 100%, 100%, and 100% ethanol. Brains were cleared and mounted in methyl salicylate. Glutaraldehyde-enhanced autofluorescence was imaged using a confocal laser scanning microscope (Zeiss LSM 8800) with excitation by a 488 nm laser. Three-dimensional projections were created from confocal image stacks using Fluorender (Wan et al., 2012). Three-dimensional reconstructions of glomeruli and antennal lobes were produced by manually segmenting confocal image stacks using the Segmentation Editor plugin in the Fiji distribution of ImageJ (Schindelin et al., 2012). Antennal lobe volumes were calculated using the Object Counter3D ImageJ plugin (Bolte and Cordelieres, 2006), blindly with respect to genotype.
Fly and ant brains depicted in Figure 3 were immunostained with NC82 and SYNORF1, respectively (both deposited to the Developmental Studies Hybridoma Bank by Buchner, E. (DSHB Hybridoma Products 3C11 (anti SYNORF1) and NC82)). For these stains, brains were fixed at room temperature in 4% paraformaldehyde (with 0.5% triton-x for NC82) for 30min (NC82) or 4hrs (SYNORF1), washed 6×10min in PBS (with 0.5% triton-x for NC82), blocked for 1–2hrs in PBS with 0.5% triton-x and 5% normal goat serum, and incubated in the blocking solution with 1% sodium azide and primary antibody (1:20 in both cases) for three days at room temperature. Brains were then washed 6×10min in PBS and then incubated in blocking solution with 1% sodium azide and secondary antibody (goat anti-mouse Alexafluor647, 1:100) for two days at room temperature. Brains were then washed 3×10min in PBS. Ant brains were subsequently dehydrated in an ascending series of 50%, 70%, 90%, 95%, 100%, 100%, and 100% isopropanol (30 seconds per solution) and cleared and mounted in methyl salicylate. Fly brains were mounted in Dako fluorescent mounting medium (Agilent Technologies). Brains were imaged as above. Three-dimensional projections were created from confocal image stacks using ZEN software (Zeiss). Flies in this experiment were aged for one month to test whether glomeruli become visibly reduced in old flies.
D. melanogaster glomerulus counts
Our reconstructions of D. melanogaster antennal lobe glomeruli yielded different glomerulus numbers than what has been published previously (Table S1). Our reconstructions also showed small differences in glomerulus numbers between wild-type and orco−/− flies (Figure 3). To address this possibility, we imaged and reconstructed two additional D. melanogaster antennal lobes, one from an orco−/− ant and one from a wild-type individual. These reconstructions were not performed strictly de novo, as the O. biroi and D. melanogaster reconstructions reported in the main text, but by referring to the published map of the D. melanogaster antennal lobe (Laissue and Vosshall, 2008; Laissue et al., 1999). Due to differences in sample preparation and imaging methods, it was not possible to unambiguously match each glomerulus to the published map. However, we identified structures in our newly reconstructed wild-type and orco−/− antennal lobes that corresponded to all published wild-type glomeruli. These results suggest that orco−/− flies have no systematic reduction in the number of antennal lobe glomeruli compared to wild-type flies, although it is possible that some neighboring glomeruli in orco−/− flies have divisions that appear less distinct or may even be fused relative to wild-types (Figure 3).
Behavior and Fitness
Sharpie assay
Preliminary trials showed that wild-type ants are strongly repelled by lines drawn with Sharpie permanent markers, frequently without even touching the Sharpie lines (Movie S2). Since O. biroi is blind, these results indicate that this is likely an olfaction-mediated behavior. Sharpie assays were conducted with tagged ants (Figure 4A–C) on printer paper in a 5.25×5.25 in open-air arena bounded by a clear acrylic barrier. Six horizontal and 6 vertical black lines were printed on the paper using an HP LaserJet printer (Figure 4A,B). Immediately before each assay, 3 alternating horizontal and vertical black lines were traced with red Fine Point Sharpie Permanent Marker (item 30002). Then the ant was placed in the center of the grid. A 2 min video was recorded and the number of times the ant crossed black and Sharpie lines was manually counted (Movie S2). A Sharpie repulsion index was calculated as the ratio of black line crosses to total line crosses. Once the experiment had concluded, we determined that low numbers of line crosses caused the repulsion indices to be unreliable, and we therefore excluded four assays that had less than 10 line crosses total. As a positive control, a wild-type worker was assayed after each assay with a low repulsion index to ensure the Sharpie lines retained a repulsive effect. All positive controls had high repulsion indices and as a population were statistically indistinguishable from the other wild-type workers assayed (p = 0.42, t-test).
G1 preparation for behavior and fitness experiments
G1 rearing resulted in a set of 34 colonies containing a mixture of G1 ants and Line A progeny of chaperones. These colonies were used to identify mutants for egg-laying, automated behavioral tracking, and survival experiments (Figure 4D–I, Figure 5, Table S3). Once each colony started producing eggs, we collected all eggs 5 times over a 14–16 day period. CO1 amplicons from all eggs were genotyped to identify Line A and Line B eggs, and orco amplicons from Line B eggs were Sanger sequenced to identify orco mutants. We sequenced 2,184 eggs from the 533 Line B ants in these colonies, corresponding to ca. 4 eggs per ant. During the period of egg collection and one week after egg collection had concluded, we subjectively determined whether any individuals in any given colony displayed a wandering phenotype. Colonies in which orco mutant eggs were detected or in which wandering phenotypes were observed were selected for the egg-laying dataset.
Egg-laying dataset
We included 16 colonies in the egg-laying dataset. A subset of ants in these colonies were later also used for behavioral and survival experiments (Table S3, see below). After the experiments had been concluded, all ants had a leg removed, from which orco amplicons were sequenced. For each orcowt/− and orco−/− adult we identified, we counted the number of eggs of its genotype in its colony. If several adults of the same genotype were identified in a colony, for each individual we calculated the number of eggs of that genotype divided by the number of adults of that genotype. We used a two-tailed Wilcoxon test to test whether orcowt/− or orco−/− G1 s produced different numbers of eggs than the average of wild-type G1s in this experiment (Figure 5A).
Behavioral and survival dataset
Before removing legs from ants for genotyping, workers from colonies that produced a high frequency of orco mutant eggs or contained individuals with wandering phenotypes were pooled to create 5 experimental colonies with a mixture of 12–14 G1 wild-type and orco mutant ants. Before pooling, all workers in these colonies were individually tagged with two color dots. These 5 colonies were recorded in 24 hr videos.
Experimental O. biroi colonies initially contained a total of 68 G1 ants, with 42 wild-type, 8 orcowt/−, and 14 orco−/− individuals (Figure 1D). These colonies also contained 4 orco mutant individuals with in-frame mutations, which were not included in the current analyses because sample sizes were too small. G1s in experimental colonies varied in orco genotype but were otherwise identical in rearing methods, genetic background, and did not differ systematically in age. Before the start of each 24 hr video, plaster nest boxes were cleaned and the plaster was moistened. For four weeks after the video was recorded, we also recorded survival of all ants in the 5 experimental colonies.
Video recording and automated behavioral tracking
Automated behavioral tracking was performed in custom-made tracking setups under constant illumination. Temperature was maintained at 25°C. Videos were acquired using C910 Logitech USB webcams controlled with custom MATLAB (version R2016a, The MathWorks, Inc.) software at 10 fps at 960×720 pixel resolution (13 pixels/mm).
Tracking was performed blind with respect to genotype. Videos were processed and analyzed using custom MATLAB software. In each frame, ants were segmented from the background of the dish using a fixed threshold. Resulting components, or blobs, were linked into trajectories using the optical flow computed between consecutive frames (Horn-Schunck method (Barron et al., 1994)). Trajectories ended and new ones were initiated whenever blobs split or merged between two consecutive frames. Trajectories stored the following data, collected from the respective blob in each frame: centroid (position of center of mass), orientation (angle between the major axis of the best-fitting ellipse and the horizontal axis) and area (in mm2).
We used a threshold size to select trajectories that corresponded to a single ant and lasted longer than two seconds. Each trajectory was then assigned a combination of color tags using a custom classification algorithm. For each experiment, at least 500 frames per ant were manually identified to create a training set, 70% of which was used to train, and 30% of which was used to validate an automated identity classifier.
For each trajectory, a naive Bayes color classifier (Fletcher et al., 2011) was used to compute the pixel color probabilities for each pixel in the blob of each frame for six color classes: the four tag colors, the ant cuticle color and the color of the plaster of Paris (Figure S3). Predicted probabilities for all four tag colors were used to determine whether both tags were visible and, if so, the orientation of the ant in the frame was deduced from the relative position of the tags with respect with the cuticle color. If both procedures were successful, the pixel color probabilities were fed into another naive Bayes classifier to assign an identity to the ant.
For each trajectory, frames were tested in a random order until 20 frames were successfully identified or no more frames were available. If at least one frame was identified, the trajectory, and thus all its underlying positions, was assigned the most frequently predicted identity. The identity classifier had an empirical error rate of 20% on single frames. However, the error rate decreased with the number of frames tested within a trajectory. Overall, we estimate that less than 10% of the total identified positions were misclassified, a performance equivalent to that reported previously for a functionally similar tracking setup for ants (Mersch et al., 2013).
Analysis of automated behavioral tracking data
Cleaning and watering the nests at the beginning of each experiment caused the ants to establish pheromone trails and actively move around the dish. We used this initial period of high activity to measure trail following behavior, reasoning that trail pheromones may cause two or more ants to move along the same path within the dish. O. biroi is a blind species and experiments from our laboratory indicate that their behavior is not influenced even by very bright light (Asaf Gal, personal communication), so it is unlikely that light or landscape cues cause correlation in the movement of the ants. We have developed assays causing O. biroi to develop trails both in response to food and disturbance (Asaf Gal, personal communication), but we chose to use the disturbance-induced trails for this particular analysis because they are more robust.
For each ant, we measured the correlation between its own movement and the movement of the remaining ants in the colony during the first hour of the tracking experiment. As O. biroi have a tendency to walk along the edges of the dish, we discarded segments of trajectories close to the edge of the dish and included only segments where the ants moved faster than 1 mm/s continuously for at least 1 second and without contact with any other ant. We then computed a 2-D histogram, or density map, for each ant by counting the number of times one of the remaining positions in the 970×720 pixel original image fell into each bin of a 120×90 bin grid. We then computed the Pearson correlation coefficient between the density map of each ant and a density map constructed from the trajectories of all ants in the colony but the focal ant (Figure 4E). For each ant, the actual correlation coefficient provided an estimate of the correlation of movement of that ant with the actual movement of other ants in the colony, which presumably results from following pheromone trails.
As a baseline comparison, the density map of each ant was correlated with a randomized density map constructed by rotating the trajectories of all ants but the focal ant in the colony by a random angle around the center of the dish (Figure 4E). This randomized correlation coefficient provided an estimate of the correlation of the movement of that ant with the randomized movement of other ants in the colony. This residual correlation reflects the portion of the correlation that is due to non-local effects such as turning frequencies, linear and angular velocity dynamics, and radial preference for certain regions of the petri dish. After examining the data, two experimental colonies were excluded from the trail following analysis because they did not form clear trails during the videos, resulting in Pearson correlation coefficients of approximately zero for all ants in the colony.
To measure wandering phenotypes, in each experiment we calculated the total distance traveled by each ant over the 24 hr video by computing the distances between all pairs of successive positions in meters in all identified trajectories. Time without contact was calculated as the total time each ant was identified in each experiment (since ants were only identifiable when they were separated from other ants). This provides a minimum estimate of the time without contact for each ant, given that it was also possible for ants to be spatially separated from other ants, yet unidentifiable, for example if their posture did not allow the detection of both tags.
Quantification and Statistical Analysis
Statistical details of all experiments can be found in the figure legends. Behavioral tracking and antennal lobe volume measurements were performed blindly with respect to genotype. Other analyses were not performed blindly with respect to genotype. Mixed model statistics were performed in R v 3.3.1 using the Imer function in the lme4 library as described previously (Bates et al. 2014, Ulrich and Schmid-Hempel, 2012, 2015). All other statistics were performed using GraphPad Prism 7. Normality was determined by D’Agostino-Pearson normality tests. Datasets used for ANOVA analyses had equal variance across treatments. Single groups were compared against a predicted mean using two-tailed Wilcoxon tests. Proportional data were compared between treatments using a Fisher exact test. Unpaired two-tailed Student’s t-tests or paired Wilcoxon tests were used to compare two groups, when appropriate, and two-way ANOVAs followed by Tukey’s multiple comparisons test were used to compare more than two groups.
Data and Software Availability
Raw data for all experiments are available in Table S3. Raw illumina sequencing reads are available through the National Center for Biotechnology Information Short Reads Archive. gRNA design and sequencing analyses were performed using the script crispralign.py from the genomepy package, available at https://github.com/oxpeter/genomepy.
Supplementary Material
Figure S1. Related to Figure 1: Phylogeny of orco and other odorant receptor genes in insects. orco orthologs in red. O. biroi orco is included in a clade with the orco genes from all other studied insect species (100% bootstrap support). All nodes with less than 75% bootstrap support have been collapsed for clarity. All other bootstrap values are shown at the respective node. Species are indicated by a four letter code: Apis – Acyrthosiphon pisum; Nvit – Nasonia vitripennis; Pcan – Papilio canadensis; Amel – Apis mellifera; Obir – Ooceraea biroi; Tcas – Tribolium castaneum; Bmor – Bombyx mori; Dmel – Drosophila melanogaster. NCBI gene symbols are shown on the right. The scale bar indicates an average of 0.3 substitutions per site.
Figure S2. Related to Figure 2: Immunohistochemistry of antennal sections from additional wild-type and orco mutant ants. (A) Antennal section of wild-type ant showing DAPI counterstain (grey), Orco immunostain (red), and the merged image (black). (B) Antennal section of orcowt−/− ant, showing similar patterns of DAPI and Orco staining as wild-type. (C) Antennal section of orco−/− ant, showing reduction in DAPI staining and loss of Orco staining, indicating that Orco-positive OSNs are absent in orco−/−, but not wild-type or orcowt/−, O. biroi. Scale bars are 20 μm.
Figure S3. Related to Figure 4: Color definition for automated behavioral tracking in RGB space. Measurements were collected manually from the four different tag colors (orange, pink, green and blue), the plaster (background) and the ant cuticle. These colors are clearly distinguishable in RGB space, allowing automated behavioral tracking based on identifying the color tags of each ant.
Table S3. Related to Figures 1–5: Genotypes and raw data for all ants included in the present study.
Table S3 is available in the Supplemental Information. For an explanation of which ants were used in which experiments, see STAR Methods. #-XX (e.g., 3-GO) refers to G1 ants in the datasets from the 5 experimental colonies. # gives the colony number, and XX gives the color tags of the individual ants. These colonies were used for all automated behavioral tracking and survival data (Figures 4D–H, and 5B). Some of these ants were also used for glomerulus counts, antennal lobe volume, and egg-laying data (Figures 3A, 3B, 5A). E-# (e.g., E-1) refers to additional G1 ants used for antennal lobe volume and egg-laying data (Figures 3B and 5A). A-# (e.g., A-1) refers to wild-type ants used for glomerulus counts and antennal lobe volume (Figure 3). S-# (e.g. S-1) refers to G2 ants used for Sharpie assays (Figure 4A–C). I-# (e.g., I-1) refers to wild-type and orco−/− ants used for immunohistochemistry and brain imaging (Figures 2, 3A, 3B, S2). For all G1 experiments, legs were removed after collecting data, and for experiments with G2 and subsequent generations, legs were removed before collecting data.
Movie S1. Related to Figure 3: Antennal lobe reconstructions of wild-type and orco−/− adults in O. biroi and D. melanogaster.
Antennal lobes are reduced in orco−/− relative to wild-type in ants, but not in flies. T7 glomeruli in O. biroi are labeled in white. Size standards are 20 μm.
Movie S2. Related to Figure 4: Sharpie assay.
Videos of exemplar wild-type and orco−/− ants in Sharpie assays (using the same individuals as in Figure 4A,B). The wild-type ant is strongly repelled by Sharpie lines (red) but the orco−/− ant is not. Videos are of 2 minute assays playing back at 4× speed.
Movie S3. Related to Figure 4: Wandering behavior.
Automated behavioral tracking of an experimental colony, showing trajectories and identification of ants based on the following color tags: O: orange, P: pink, G: green and B: blue. Note that individual identities are lost when ants form clusters. This two minute video of an experimental colony shows the wandering behavior of orco−/− ants (PP and GG; the first letter refers to the thorax tag, the second letter to the gaster tag). OP, which never leaves the nest cluster and therefore is never identified, is orcowt/−; all other ants are wild-type. PP and GG are seen antennating each other at 0:57 s.
Movie S4. Related to Figure 4: Additional social behaviors.
Ants are the same as in Movie S3. This video initially shows an orco−/− ant, PP, grooming a pile of eggs. At 0:31 s PP begins to move, seemingly eliciting an alarm response that causes the other ants in the colony to move toward PP. Note that GG, the second orco−/− ant in the colony, does not become active. PP then moves toward the edge of the dish, possibly depositing a chemical pheromone trail that is followed by some of her nestmates. Note that by the end of the video a clear pheromone trail has formed that many of the wild-type ants are following.
Highlights.
We generated odorant receptor co-receptor (orco) mutants in an ant
orco mutants did not follow pheromone trails or cluster with other ants
Mutant ants also had greatly reduced antennal lobes in the brain
Odorant receptors are essential for the complex organization of ant societies
Acknowledgments
We thank the members of the Kronauer, Vosshall, and Ruta laboratories for reagents and critical insights. We are grateful to Ingrid Fetter-Pruneda for suggesting the Sharpie experiment, Yuko Ulrich for help with mixed-model statistics, Laura Seeholzer and Margaret Ebert, along with the Insect Genetic Technologies Research Coordination Network, for help in developing the injection protocol, Vanessa Ruta for providing flies, Leslie Vosshall for access to laboratory equipment, Zak Frentz and Asaf Gal for help in implementing the automated behavioral tracking, as well as Cori Bargmann, Claude Desplan, and Leslie Vosshall for comments on a previous version of this manuscript. This work was supported by grant 1DP2GM105454-01 from the NIH, a Searle Scholar Award, a Klingenstein-Simons Fellowship Award in the Neurosciences, and a Pew Biomedical Scholar Award to D.J.C.K. P.R.O. was supported by a Leon Levy Neuroscience Fellowship, and J.S. and S.K.M. were supported by a Kravis Fellowship and NRSA Training Grant #GM066699, respectively. This is Clonal Raider Ant Project paper #6.
Footnotes
Publisher's Disclaimer: This is a PDF file of an unedited manuscript that has been accepted for publication. As a service to our customers we are providing this early version of the manuscript. The manuscript will undergo copyediting, typesetting, and review of the resulting proof before it is published in its final citable form. Please note that during the production process errors may be discovered which could affect the content, and all legal disclaimers that apply to the journal pertain.
Supplemental Information: Supplemental Information includes three figures, three tables, STAR Methods, and four movies and can be found with this article online.
Author Contributions: W.T. and D.J.C.K. conceived the project with input from B.M. W.T., B.M., and L.O.C. conducted preliminary experiments to develop CRISPR methods in O. biroi. W.T., N.C., and L.O.C. performed injections and ant rearing. W.T., N.C., L.O.C., and P.R.O. performed sequencing and analysis with input from B.M. L.O.C. performed brain dissections and antibody assays, and S.K.M. performed remaining neuroanatomical experiments and analyses. W.T., L.O.C., N.C., and J.S. performed behavioral experiments. J.S. developed automated tracking techniques and performed behavioral analyses involving automated tracking. W.T., N.C., and L.O.C. performed fitness experiments. D.J.C.K. supervised the project. W.T. and D.J.C.K. wrote the paper. All authors discussed the results and the manuscript.
References
- Altschul SF, Gish W, Miller W, Myers EW, Lipman DJ. Basic local alignment search tool. J Mol Biol. 1990;215:403–410. doi: 10.1016/S0022-2836(05)80360-2. [DOI] [PubMed] [Google Scholar]
- Asahina K, Pavlenkovich V, Vosshall LB. The survival advantage of olfaction in a competitive environment. Curr Biol. 2008;18:1153–1155. doi: 10.1016/j.cub.2008.06.075. [DOI] [PMC free article] [PubMed] [Google Scholar]
- Barron J, Fleet D, Beauchemin S. Performance of optical flow techniques. Int J Comput Vis. 1994;12:43–77. [Google Scholar]
- Bates D, Maechler M, Bolker B, Walker S. lme4: Linear mixed-effects models using Eigen and S4. 2014. (R package version 1.7). [Google Scholar]
- Bell WJ, Parsons C, Martinko EA. Cockroach aggregation pheromones: analysis of aggregation tendency and species specificity (Orthoptera: Blattidae) J Kansas Entomol Soc. 1972;45:414–421. [Google Scholar]
- Berdnik D, Chihara T, Couto A, Luo L. Wiring stability of the adult Drosophila olfactory circuit after lesion. J Neurosci. 2006;26:3367–3376. doi: 10.1523/JNEUROSCI.4941-05.2006. [DOI] [PMC free article] [PubMed] [Google Scholar]
- Bolte S, Cordelieres FP. A guided tour into subcellular colocalisation analysis in light microscopy. J Microsc. 2006:224, 13–232. doi: 10.1111/j.1365-2818.2006.01706.x. [DOI] [PubMed] [Google Scholar]
- Chiang A, Priya R, Ramaswami M, Vijayraghavan K, Rodrigues V. Neuronal activity and Wnt signaling act through Gsk3-beta to regulate axonal integrity in mature Drosophila olfactory sensory neurons. Development. 2009;136:1273–1282. doi: 10.1242/dev.031377. [DOI] [PMC free article] [PubMed] [Google Scholar]
- David Morgan E. Trail pheromones of ants. Physiol Entomol. 2009;34:1–17. [Google Scholar]
- DeGennaro M, McBride CS, Seeholzer L, Nakagawa T, Dennis EJ, Goldman C, Jasinskiene N, James AA, Vosshall LB. orco mutant mosquitoes lose strong preference for humans and are not repelled by volatile DEET. Nature. 2013;498:487491. doi: 10.1038/nature12206. [DOI] [PMC free article] [PubMed] [Google Scholar]
- Depickere S, Fresneau D, Deneubourg JL. A basis for spatial and social patterns in ant species: Dynamics and mechanisms of aggregation. J Insect Behav. 2004;17:81–97. [Google Scholar]
- Dobritsa AA, Van Der Goes Van Naters W, Warr CG, Steinbrecht RA, Carlson JR. Integrating the molecular and cellular basis of odor coding in the Drosophila antenna. Neuron. 2003;37:827–841. doi: 10.1016/s0896-6273(03)00094-1. [DOI] [PubMed] [Google Scholar]
- Dippel S, Kollmann M, Oberhofer G, Montino A, Knoll C, Krala M, Rexer KH, Frank S, Kumpf R, Schachtner J, et al. Morphological and Transcriptomic Analysis of a Beetle Chemosensory System Reveals a Gnathal Olfactory Center. BMC Biol. 2016;14:90. doi: 10.1186/s12915-016-0304-z. [DOI] [PMC free article] [PubMed] [Google Scholar]
- Eddy S. Profile hidden Markov models. Bioinformatics. 1998;14:755–763. doi: 10.1093/bioinformatics/14.9.755. [DOI] [PubMed] [Google Scholar]
- Engsontia P, Sanderson AP, Cobb M, Walden KKO, Robertson HM, Brown S. The red flour beetle’s large nose: An expanded odorant receptor gene family in Tribolium castaneum Insect Biochem. Mol Biol. 2008;38:387–397. doi: 10.1016/j.ibmb.2007.10.005. [DOI] [PubMed] [Google Scholar]
- Engsontia P, Sangket U, Robertson HM, Satasook C. Diversification of the ant odorant receptor gene family and positive selection on candidate cuticular hydrocarbon receptors. BMC Res Notes. 2015;8:1–13. doi: 10.1186/s13104-015-1371-x. [DOI] [PMC free article] [PubMed] [Google Scholar]
- Flanagan D, Mercer AR. An atlas and 3-D reconstruction of the antennal lobes in the worker honey bee, Apis mellifera L. (Hymenoptera: Apidae) Int J Insect Morphol Embryol. 1989;18:145–159. [Google Scholar]
- Fletcher M, Dornhaus A, Shin MC. Multiple ant tracking with global foreground maximization and variable target proposal distribution. IEEE Work Appl Comput Vis. 2011:570–576. [Google Scholar]
- Folmer O, Black M, Hoeh W, Lutz R, Vrijenhoek R. DNA primers for amplification of mitochondrial cytochrome c oxidase subunit I from diverse metazoan invertebrates. Mol Mar Biol Biotechnol. 1994;3:294–299. [PubMed] [Google Scholar]
- Fu Y, Foden JA, Khayter C, Maeder ML, Reyon D, Joung JK, Sander JD. High-frequency off-target mutagenesis induced by CRISPR-Cas nucleases in human cells. Nat Biotechnol. 2013;31:822–826. doi: 10.1038/nbt.2623. [DOI] [PMC free article] [PubMed] [Google Scholar]
- Gascuel J, Masson C. Developmental study of afferented and deafferented bee antennal lobes. J Neurobiol. 1991;22:795–810. doi: 10.1002/neu.480220802. [DOI] [PubMed] [Google Scholar]
- Gotwald WH. Army ants: the biology of social predation. Ithica, New York: Cornell University Press; 1995. [Google Scholar]
- Grüter C, Keller L. Inter-caste communication in social insects. Curr Opin Neurobiol. 2016;38:6–1. doi: 10.1016/j.conb.2016.01.002. [DOI] [PubMed] [Google Scholar]
- Hines HM, Papa R, Ruiz M, Papanicolaou A, Wang C, Nijhout HF, McMillan WO, Reed RD. Transcriptome analysis reveals novel patterning and pigmentation genes underlying Heliconius butterfly wing pattern variation. BMC Genomics. 2012;13:288. doi: 10.1186/1471-2164-13-288. [DOI] [PMC free article] [PubMed] [Google Scholar]
- Hölldobler B. Communication, raiding behavior and prey storage in Cerapachys (Hymenoptera; Formicidae) Psyche. 1982;89:3–23. [Google Scholar]
- Jhaveri D, Rodrigues V. Sensory neurons of the Atonal lineage pioneer the formation of glomeruli within the adult Drosophila olfactory lobe. Development. 2002;129:1251–1260. doi: 10.1242/dev.129.5.1251. [DOI] [PubMed] [Google Scholar]
- Jones WD, Nguyen TAT, Kloss B, Lee KJ, Vosshall LB. Functional conservation of an insect odorant receptor gene across 250 million years of evolution. Curr Biol. 2005;15:119–121. doi: 10.1016/j.cub.2005.02.007. [DOI] [PubMed] [Google Scholar]
- Katoh K, Standley DM. MAFFT multiple sequence alignment software version 7: Improvements in performance and usability. Mol Biol Evol. 2013;30:772–780. doi: 10.1093/molbev/mst010. [DOI] [PMC free article] [PubMed] [Google Scholar]
- Kelber C, Rössler W, Roces F, Kleineidam CJ. The antennal lobes of fungus-growing ants (Attini): Neuroanatomical traits and evolutionary trends. Brain Behav Evol. 2009;73:273–284. doi: 10.1159/000230672. [DOI] [PubMed] [Google Scholar]
- Kistler KE, Vosshall LB, Matthews BJ. Genome engineering with CRISPR-Cas9 in the mosquito Aedes aegypti. Cell Rep. 2015;11:51–60. doi: 10.1016/j.celrep.2015.03.009. [DOI] [PMC free article] [PubMed] [Google Scholar]
- Kohl J, Huoviala P, Jefferis GSXE. Pheromone processing in Drosophila. Curr Opin Neurobiol. 2015;34:149–157. doi: 10.1016/j.conb.2015.06.009. [DOI] [PMC free article] [PubMed] [Google Scholar]
- Kohno H, Suenami S, Takeuchi H, Sasaki T, Kubo T. Production of knockout mutants by CRISPR/Cas9 in the European honeybee, Apis mellifera L. Zoolog Sci. 2016;33:505–512. doi: 10.2108/zs160043. [DOI] [PubMed] [Google Scholar]
- Kollmann M, Minoli S, Bonhomme J, Homberg U, Schachtner J, Tagu D, Anton S. Revisiting the anatomy of the central nervous system of a hemimetabolous model insect species: The pea aphid Acyrthosiphon pisum. Cell Tissue Res. 2011;343:343–355. doi: 10.1007/s00441-010-1099-9. [DOI] [PubMed] [Google Scholar]
- Koto A, Mersch D, Hollis B, Keller L. Social isolation causes mortality by disrupting energy homeostasis in ants. Behav Ecol Sociobiol. 2015;69:583–591. [Google Scholar]
- Koutroumpa FA, Monsempes C, François M-C, de Cian A, Royer C, Concordet J-P, Jacquin-Joly E. Heritable genome editing with CRISPR/Cas9 induces anosmia in a crop pest moth. Sci Rep. 2016;6:1–9. doi: 10.1038/srep29620. [DOI] [PMC free article] [PubMed] [Google Scholar]
- Kronauer D, Pierce N, Keller L. Asexual reproduction in introduced and native populations of the ant Cerapachys biroi. Mol Ecol. 2012;21:5221–5235. doi: 10.1111/mec.12041. [DOI] [PubMed] [Google Scholar]
- Kumar S, Stecher G, Tamura K. MEGA7: Molecular Evolutionary Genetics Analysis version 7.0 for bigger datasets. Mol Biol Evol. 2016;33:1870–1874. doi: 10.1093/molbev/msw054. [DOI] [PMC free article] [PubMed] [Google Scholar]
- Laissue PP, Vosshall LB. The olfactory sensory map in Drosophila. In: Technau GM, editor. Brain Development in Drosophila melanogaster. Landes Bioscience and Springer Science+Business Media; 2008. pp. 102–114. [Google Scholar]
- Laissue PP, Reiter C, Hiesinger PR, Halter S, Fischbach KF, Stocker RF. Three-dimensional reconstruction of the antennal lobe in Drosophila melanogaster. J Comp Neurol. 1999;405:543–552. [PubMed] [Google Scholar]
- Larsson MC, Domingos AI, Jones WD, Chiappe ME, Amrein H, Vosshall LB. Or83b encodes a broadly expressed odorant receptor essential for Drosophila olfaction. Neuron. 2004;43:703–714. doi: 10.1016/j.neuron.2004.08.019. [DOI] [PubMed] [Google Scholar]
- Leonhardt SD, Menzel F, Nehring V, Schmitt T. Ecology and evolution of communication in social insects. Cell. 2016;164:1277–1287. doi: 10.1016/j.cell.2016.01.035. [DOI] [PubMed] [Google Scholar]
- Li Y, Zhang J, Chen D, Yang P, Jiang F, Wang X, Kang L. CRISPR/Cas9 in locusts: Successful establishment of an olfactory deficiency line by targeting the mutagenesis of an odorant receptor co-receptor (Orco) Insect Biochem Mol Biol. 2016;79:27–35. doi: 10.1016/j.ibmb.2016.10.003. [DOI] [PubMed] [Google Scholar]
- Lobo NF, Clayton JR, Fraser MJ, Kafatos FC, Collins FH. High efficiency germ-line transformation of mosquitoes. Nat Protoc. 2006;1:1312–1317. doi: 10.1038/nprot.2006.221. [DOI] [PubMed] [Google Scholar]
- Malun D, Oland LA, Tolbert LP. Uniglomerular projection neurons participate in early development of olfactory glomeruli in the moth Manduca sexta. J Comp Neurol. 1994;350:1–22. doi: 10.1002/cne.903500102. [DOI] [PubMed] [Google Scholar]
- Maynard Smith J, Szathmary E. The major transitions in evolution. Oxford University Press; 1997. [Google Scholar]
- McKenzie SK, Fetter-Pruneda I, Ruta V, Kronauer DJC. Transcriptomics and neuroanatomy of the clonal raider ant implicate an expanded clade of odorant receptors in chemical communication. Proc Natl Acad Sci. 2016;113:14091–14096. doi: 10.1073/pnas.1610800113. [DOI] [PMC free article] [PubMed] [Google Scholar]
- Mersch DP, Crespi A, Keller L. Tracking individuals shows spatial fidelity is a key regulator of ant social organization. Science. 2013;360:1090–1093. doi: 10.1126/science.1234316. [DOI] [PubMed] [Google Scholar]
- Nakanishi A, Nishino H, Watanabe H, Yokohari F, Nishikawa M. Sex-specific antennal sensory system in the ant Camponotus japonicus: glomerular organizations of antennal lobes. J Comp Neurol. 2010;518:2186–2201. doi: 10.1002/cne.22326. [DOI] [PubMed] [Google Scholar]
- Oxley PR, Ji L, Fetter-pruneda I, McKenzie SK, Li C, Hu H, Zhang G, Kronauer DJCC. The genome of the clonal raider ant Cerapachys biroi. Curr Biol. 2014;24:451–458. doi: 10.1016/j.cub.2014.01.018. [DOI] [PMC free article] [PubMed] [Google Scholar]
- Pitts RJ, Fox AN, Zwiebel LJ. A highly conserved candidate chemoreceptor expressed in both olfactory and gustatory tissues in the malaria vector Anopheles gambiae. Proc Natl Acad Sci U S A. 2004;101:5058–5063. doi: 10.1073/pnas.0308146101. [DOI] [PMC free article] [PubMed] [Google Scholar]
- Reid W, O’Brochta DA. Applications of genome editing in insects. Curr Opin Insect Sci. 2016;13:43–54. doi: 10.1016/j.cois.2015.11.001. [DOI] [PubMed] [Google Scholar]
- Richard FJ, Hunt JH. Intracolony chemical communication in social insects. Insectes Soc. 2013;60:275–291. [Google Scholar]
- Robertson HM, Warr CG, Carlson JR. Molecular evolution of the insect chemoreceptor gene superfamily in Drosophila melanogaster. Proc Natl Acad Sci U S A. 2003;100:14537–14542. doi: 10.1073/pnas.2335847100. [DOI] [PMC free article] [PubMed] [Google Scholar]
- Robertson HM, Gadau J, Wanner KW. The insect chemoreceptor superfamily of the parasitoid jewel wasp Nasonia vitripennis. Insect Mol Biol. 2010;19:121–136. doi: 10.1111/j.1365-2583.2009.00979.x. [DOI] [PubMed] [Google Scholar]
- Sato K, Pellegrino M, Nakagawa T, Nakagawa T, Vosshall LB, Touhara K. Insect olfactory receptors are heteromeric ligand-gated ion channels. Nature. 2008;452:1002–1006. doi: 10.1038/nature06850. [DOI] [PubMed] [Google Scholar]
- Schindelin J, Arganda-Carreras I, Frise E, Kaynig V, Longair M, Pietzsch T, Preibisch S, Rueden C, Saalfeld S, Schmid B, et al. Fiji: an open-source platform for biological-image analysis. Nat Methods. 2012;9:676–682. doi: 10.1038/nmeth.2019. [DOI] [PMC free article] [PubMed] [Google Scholar]
- Schneirla T. Army ants: A study in social organization. San Francisco, CA: W H Freeman; 1971. [Google Scholar]
- Schulte C, Theilenberg E, Müller-Borg M, Gempe T, Beye M. Highly efficient integration and expression of piggyBac-derived cassettes in the honeybee (Apis mellifera) Proc Natl Acad Sci U S A. 2014;111:9003–9008. doi: 10.1073/pnas.1402341111. [DOI] [PMC free article] [PubMed] [Google Scholar]
- Smadja C, Shi P, Butlin RK, Robertson HM. Large gene family expansions and adaptive evolution for odorant and gustatory receptors in the pea aphid, Acyrthosiphon pisum. Mol Biol Evol. 2009;26:2073–2086. doi: 10.1093/molbev/msp116. [DOI] [PubMed] [Google Scholar]
- Smith CD, Zimin A, Holt C, Abouheif E, Benton R, Cash E, Croset V, Currie CR, Elhaik E, Elsik CG, et al. Draft genome of the globally widespread and invasive Argentine ant (Linepithema humile) Proc Natl Acad Sci U S A. 2011a;108:5673–5678. doi: 10.1073/pnas.1008617108. [DOI] [PMC free article] [PubMed] [Google Scholar]
- Smith CR, Smith CD, Robertson HM, Helmkampf M, Zimin A, Yandell M, Holt C, Hu H, Abouheif E, Benton R, et al. Draft genome of the red harvester ant Pogonomyrmex barbatus. Proc Natl Acad Sci U S A. 2011b;108:5667–5672. doi: 10.1073/pnas.1007901108. [DOI] [PMC free article] [PubMed] [Google Scholar]
- Stamatakis A. RAxML-VI-HPC: Maximum likelihood-based phylogenetic analyses with thousands of taxa and mixed models. Bioinformatics. 2006;22:2688–2690. doi: 10.1093/bioinformatics/btl446. [DOI] [PubMed] [Google Scholar]
- Terrapon N, Li C, Robertson HM, Ji L, Meng X, Booth W, Chen Z, Childers CP, Glastad KM, Gokhale K, et al. Molecular traces of alternative social organization in a termite genome. Nat Commun. 2014;5:1–12. doi: 10.1038/ncomms4636. [DOI] [PubMed] [Google Scholar]
- Ulrich Y, Schmid-Hempel P. Host modulation of parasite competition in multiple infections. Proc R Soc B Biol Sci. 2012;279:2982–2989. doi: 10.1098/rspb.2012.0474. [DOI] [PMC free article] [PubMed] [Google Scholar]
- Ulrich Y, Schmid-Hempel P. The distribution of parasite strains among hosts affects disease spread in a social insect. Infect Genet Evol. 2015;32:348–353. doi: 10.1016/j.meegid.2015.04.002. [DOI] [PubMed] [Google Scholar]
- Wan Y, Otsuna H, Chien CB, Hansen C. FluoRender: An application of 2D image space methods for 3D and 4D confocal microscopy data visualization in neurobiology research. IEEE Pacific Vis Symp. 2012:201–208. doi: 10.1109/pacificvis.2012.6183592. [DOI] [PMC free article] [PubMed] [Google Scholar]
- Yan H, Simola DF, Bonasio R, Liebig J, Berger SL, Reinberg D. Eusocial insects as emerging models for behavioural epigenetics. Nat Rev Genet. 2014;15:677–688. doi: 10.1038/nrg3787. [DOI] [PubMed] [Google Scholar]
- Yan H, Opachaloemphan C, Mancini G, Yang H, Gallitto M, Mlejnek J, Haight K, Ghaninia M, Huo L, Leibholz A, Slone J, Zhou X, Traficante M, Penick CA, Dolezal K, Gokhale K, Stevens K, Fetter-Pruneda I, Bonasio R, Zwiebel LJ, Berger S, Liebig J, Reinberg D, Desplan C. An engineered orco mutation in ants produces aberrant social behavior and defective neural development. Cell. 2017 doi: 10.1016/j.cell.2017.06.051. In press. [DOI] [PMC free article] [PubMed] [Google Scholar]
- Yang B, Fujii T, Ishikawa Y, Matsuo T. Targeted mutagenesis of an odorant receptor co-receptor using TALEN in Ostrinia furnacalis Insect Biochem. Mol Biol. 2016;70:53–59. doi: 10.1016/j.ibmb.2015.12.003. [DOI] [PubMed] [Google Scholar]
- Yu CR, Power J, Barnea G, O’Donnell S, Brown HEV, Osborne J, Axel R, Gogos JA. Spontaneous neural activity is required for the establishment and maintenance of the olfactory sensory map. Neuron. 2004;42:553–566. doi: 10.1016/s0896-6273(04)00224-7. [DOI] [PubMed] [Google Scholar]
- Zhou X, Slone JD, Rokas A, Berger SL, Liebig J, Ray A, Reinberg D, Zwiebel LJ. Phylogenetic and transcriptomic analysis of chemosensory receptors in a pair of divergent ant species reveals sex-specific signatures of odor coding. PLoS Genet. 2012;8:e1002930. doi: 10.1371/journal.pgen.1002930. [DOI] [PMC free article] [PubMed] [Google Scholar]
- Zhu LJ, Holmes BR, Aronin N, Brodsky MH. CRISPRseek: A Bioconductor package to identify target-specific guide RNAs for CRISPR-Cas9 genome-editing systems. PLoS One. 2014;9:e108424. doi: 10.1371/journal.pone.0108424. [DOI] [PMC free article] [PubMed] [Google Scholar]
- Zube C, Kleineidam CJ, Kirschner S, Neef J, Rossler W. Organization of the olfactory pathway and odor processing in the antennal lobe of the ant Camponotus floridanus. J Comp Neurol. 2008;506:425–441. doi: 10.1002/cne.21548. [DOI] [PubMed] [Google Scholar]
Associated Data
This section collects any data citations, data availability statements, or supplementary materials included in this article.
Supplementary Materials
Figure S1. Related to Figure 1: Phylogeny of orco and other odorant receptor genes in insects. orco orthologs in red. O. biroi orco is included in a clade with the orco genes from all other studied insect species (100% bootstrap support). All nodes with less than 75% bootstrap support have been collapsed for clarity. All other bootstrap values are shown at the respective node. Species are indicated by a four letter code: Apis – Acyrthosiphon pisum; Nvit – Nasonia vitripennis; Pcan – Papilio canadensis; Amel – Apis mellifera; Obir – Ooceraea biroi; Tcas – Tribolium castaneum; Bmor – Bombyx mori; Dmel – Drosophila melanogaster. NCBI gene symbols are shown on the right. The scale bar indicates an average of 0.3 substitutions per site.
Figure S2. Related to Figure 2: Immunohistochemistry of antennal sections from additional wild-type and orco mutant ants. (A) Antennal section of wild-type ant showing DAPI counterstain (grey), Orco immunostain (red), and the merged image (black). (B) Antennal section of orcowt−/− ant, showing similar patterns of DAPI and Orco staining as wild-type. (C) Antennal section of orco−/− ant, showing reduction in DAPI staining and loss of Orco staining, indicating that Orco-positive OSNs are absent in orco−/−, but not wild-type or orcowt/−, O. biroi. Scale bars are 20 μm.
Figure S3. Related to Figure 4: Color definition for automated behavioral tracking in RGB space. Measurements were collected manually from the four different tag colors (orange, pink, green and blue), the plaster (background) and the ant cuticle. These colors are clearly distinguishable in RGB space, allowing automated behavioral tracking based on identifying the color tags of each ant.
Table S3. Related to Figures 1–5: Genotypes and raw data for all ants included in the present study.
Table S3 is available in the Supplemental Information. For an explanation of which ants were used in which experiments, see STAR Methods. #-XX (e.g., 3-GO) refers to G1 ants in the datasets from the 5 experimental colonies. # gives the colony number, and XX gives the color tags of the individual ants. These colonies were used for all automated behavioral tracking and survival data (Figures 4D–H, and 5B). Some of these ants were also used for glomerulus counts, antennal lobe volume, and egg-laying data (Figures 3A, 3B, 5A). E-# (e.g., E-1) refers to additional G1 ants used for antennal lobe volume and egg-laying data (Figures 3B and 5A). A-# (e.g., A-1) refers to wild-type ants used for glomerulus counts and antennal lobe volume (Figure 3). S-# (e.g. S-1) refers to G2 ants used for Sharpie assays (Figure 4A–C). I-# (e.g., I-1) refers to wild-type and orco−/− ants used for immunohistochemistry and brain imaging (Figures 2, 3A, 3B, S2). For all G1 experiments, legs were removed after collecting data, and for experiments with G2 and subsequent generations, legs were removed before collecting data.
Movie S1. Related to Figure 3: Antennal lobe reconstructions of wild-type and orco−/− adults in O. biroi and D. melanogaster.
Antennal lobes are reduced in orco−/− relative to wild-type in ants, but not in flies. T7 glomeruli in O. biroi are labeled in white. Size standards are 20 μm.
Movie S2. Related to Figure 4: Sharpie assay.
Videos of exemplar wild-type and orco−/− ants in Sharpie assays (using the same individuals as in Figure 4A,B). The wild-type ant is strongly repelled by Sharpie lines (red) but the orco−/− ant is not. Videos are of 2 minute assays playing back at 4× speed.
Movie S3. Related to Figure 4: Wandering behavior.
Automated behavioral tracking of an experimental colony, showing trajectories and identification of ants based on the following color tags: O: orange, P: pink, G: green and B: blue. Note that individual identities are lost when ants form clusters. This two minute video of an experimental colony shows the wandering behavior of orco−/− ants (PP and GG; the first letter refers to the thorax tag, the second letter to the gaster tag). OP, which never leaves the nest cluster and therefore is never identified, is orcowt/−; all other ants are wild-type. PP and GG are seen antennating each other at 0:57 s.
Movie S4. Related to Figure 4: Additional social behaviors.
Ants are the same as in Movie S3. This video initially shows an orco−/− ant, PP, grooming a pile of eggs. At 0:31 s PP begins to move, seemingly eliciting an alarm response that causes the other ants in the colony to move toward PP. Note that GG, the second orco−/− ant in the colony, does not become active. PP then moves toward the edge of the dish, possibly depositing a chemical pheromone trail that is followed by some of her nestmates. Note that by the end of the video a clear pheromone trail has formed that many of the wild-type ants are following.