Abstract
Gene expression noise results in protein number distributions ranging from long-tailed to Gaussian. We show how long-tailed distributions arise from a stochastic model of the constituent chemical reactions and suggest that, in conjunction with cooperative switches, they lead to more sensitive selection of a subpopulation of cells with high protein number than is possible with Gaussian distributions. Single-cell-tracking experiments are presented to validate some of the assumptions of the stochastic simulations. We also examine the effect of DNA looping on the shape of protein distributions. We further show that when switches are incorporated in the regulation of a gene via a feedback loop, the distributions can become bimodal. This might explain the bimodal distribution of certain morphogens during early embryogenesis.
Keywords: fluctuations, genetic switches, single cell
The inevitable noise in gene expression, manifested at the subcellular level as distributions in protein numbers, has been observed experimentally in both prokaryotes and eukaryotes (1-6). Recent studies have investigated how organisms tolerate this noise and the kinds of regulatory strategies they use to control or minimize it (7, 8). One example where it has been suggested that noise is exploited for the benefit of the organism is bacterial chemotaxis (9). Analyses of noise in gene expression have high-lighted the analogy with quantum many-body systems (10), and the authors of refs. 11-15 have explored the contribution of intrinsic and extrinsic sources, as well as the relative contribution of transcription and translation, focusing on the standard deviation of protein fluctuations. If the protein distributions were Gaussian, the mean, μ, and standard deviation, σ, would provide a complete description of the noise characteristics. However, recent experiments have revealed that protein distributions are often non-Gaussian and also time-dependent, showing a crossover from long-tailed to Gaussian (3). It is important, therefore, to understand the origins and implications of the long-tailed nature of the protein distributions.
We implement a stochastic chemical model of gene expression and show that it leads to distributions that fit the experimental observations, presented in this paper and in ref. 3, of protein distributions at different stages of bacterial growth. The predictions of the simulations were experimentally tested by single-cell-tracking experiments. We suggest that long-tailed protein distributions filtered by appropriate switches can lead to selection at the subcellular level. For example, a switch with a sharp threshold can be used to select a subpopulation of cells with a large concentration of a particular protein from a population of cells with a long-tailed distribution of that protein. By contrast, we show that symmetric Gaussian distributions are not as sensitive to switches.
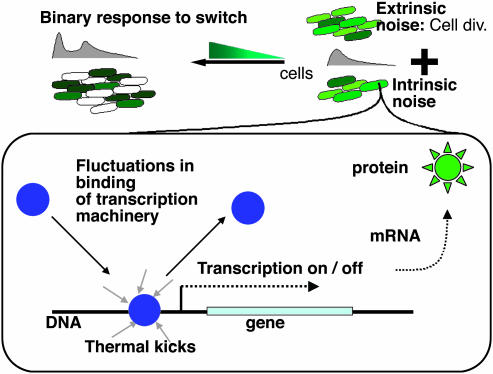
When long-tailed distributions are combined with switches via a positive feedback loop, we find that the system becomes bistable and can result in bimodal protein distributions. Recent observations of a bimodal protein distribution in an autoregulatory system (3) and engineered gene circuits that couple a switch to a GFP gene (16) confirm our predictions. We also find bimodality in the distribution of the hunchback protein in early-stage Drosophila embryos and suggest that this could be the result of the bicoid switch acting on a long-tailed distribution. Thus, long-tailed distributions and their response to switches might also be of relevance to processes in early embryogenesis. A schematic of our studies is presented in Fig. 1.
Fig. 1.
Schematic diagram of the phenomena studied.
Origins of Long-Tailed Protein Distributions
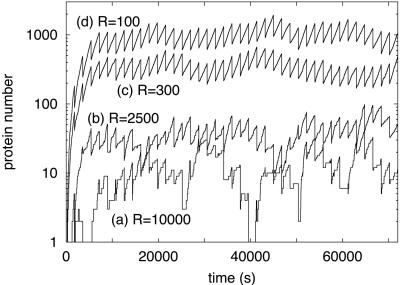
Stochastic Simulations of a Chemical Model of Gene Expression. To understand the microscopic processes producing the long-tailed distributions and the importance of different sources of noise, we have constructed a chemical model of the process of gene expression and analyzed it by using stochastic simulations. The model describes a single gene regulated by an operator site where a repressor molecule can bind and prevent transcription initiation. Expression of the gene is modeled as a series of chemical reactions, as in ref. 17. The Gillespie method (18) is used for stochastic simulation of the reactions. In the Gillespie method, the probability per unit time for the occurrence of a reaction is taken to be the product of a combinatorial factor, which is a function of the numbers of reactants, and the rate constant of the reaction. For second- and higher-order reactions, the volume of the cell also has to be taken into account and, here, is assumed to be linearly increasing through the cell cycle. Each cell cycle, of duration T, is implemented as follows. First, the Gillespie simulation is run for a time tD, at which point the gene copy number, n, is doubled. The simulation is then run until time T when the cell volume and gene copy number are halved and other molecules are partitioned binomially. The process is then iterated for the next cell cycle, with one daughter cell followed after each partitioning (the model and the simulation algorithm are described in Stochastic Simulation of a Chemical Model of Gene Expression in Supporting Text, which is published as supporting information on the PNAS web site; they are based on models and algorithms used in refs. 13, 17, and 19). Fig. 2 shows the results of simulations with a fixed cell division time, T = 1,800 s, but different values of the total repressor number, R. The effects of different sources of noise on the protein time series are evident in these runs. When the protein number is large, the thermal noise (reflected in the stochastic occurrence of chemical reactions) is small but the noise from partitioning of molecules during cell division is visible. Thus, in the R = 100 and R = 300 runs, in the steady state, the protein number grows (on average) exponentially over each cell cycle: n = N0eαt, where α = ln (2)/T. In contrast, when the protein number is small (the R = 10,000 runs), the thermal noise becomes important and dominates the stochastic features of the time series. These aspects are clearly observed in our experiments discussed later.
Fig. 2.
Protein number time series from four runs of a chemical model of gene expression with a fixed cell division time, T, of 1,800 s, a gene copy number, n, of 10, and total repressor numbers, R, of 10,000 (a), 2,500 (b), 300 (c), and 100 (d).
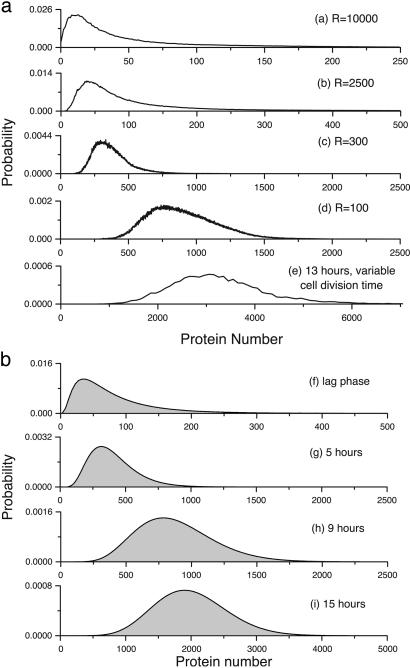
The protein distributions corresponding to the runs of Fig. 2 are displayed in Fig. 3. The distributions are skewed and long-tailed for smaller mean protein numbers and closer to Gaussian for the run with the largest mean protein number. These distributions compare well with the experimentally observed distributions also shown in
Fig. 3.
Protein number distributions for the four runs shown in Fig. 2 and after 13 h in simulations with variable cell division time (ae), and experimentally observed protein distributions (bf-bi).
Fig. 3. These were obtained by using flow cytometry of Escherichia coli cells containing EGFP as the reporter for gene expression. The cells were grown in a LB broth, and samples of 50,000 cells were collected at various times, ranging from 2 to 15 h, after inoculation (3).
Large N Regime. For the simulations shown in Figs. 2 (b-d) and 3 (ab-ad, the mean protein number is large enough for the thermal noise to be negligible, but the cell partitioning noise is still important. This noise results in a distribution of protein number at the beginning of the cell cycle that is approximately Gaussian (see Analytic Expression for the Protein Distribution in Supporting Text). Therefore, to obtain an analytic expression for the protein distribution in this regime, we can assume the following. (i) Over a cell cycle, of duration T, the protein number grows exponentially, n = N0eαt, with β ≡ αT being a constant. (ii) Over the ensemble of runs, N0 is distributed normally with mean N̄0 and standard deviation σ. (iii) Cells are not synchronized, so the observed distribution is an average over the whole cell cycle. The distribution of N over one cell cycle is then obtained by a continuous superposition of Gaussians:
 |
[1] |
where
 |
The mean of the above expression is
 |
and the variance is
 |
Therefore, for large N̄0 and fixed β, the standard deviation is exactly proportional to the mean (see Analytic Expression for the Protein Distribution in Supporting Text).
Eq. 1 gives an excellent fit to the protein distributions obtained from the simulation as well as the experimental data of ref. 3 (see Analytic Expression for the Protein Distribution in Supporting Text). Note that, in the experiment, the cells do not have a fixed cell division time. However, if the cell division time is changing sufficiently slowly, it might be a reasonable approximation to assume that, at any given point in the growth curve, the system, for a short period, has a fixed cell division time. We have also done simulations where the cell division time is variable, and these also show a crossover from long-tailed to Gaussian protein distributions (see Simulations with Variable Cell Division Time in Supporting Text). Fig. 3ae shows the nearly Gaussian protein distribution obtained after 13 h in a run with variable cell division time. Thus, we conclude that in the regime of large protein numbers, the long-tailed nature of the protein distribution arises from a superposition of Gaussian distributions, each with a different mean and standard deviation. The superposition, in turn, arises from the additive noise due to partitioning of molecules during cell division combined with the exponential growth of protein number over a cell cycle. Furthermore, the standard deviation of this superposition is necessarily proportional to the mean, for large protein numbers, which explains that observation in the experimental data (3).
Small N Regime. When the protein numbers are small, the approximation, that in each cell cycle the protein number grows exponentially (n = N0eαt with α constant,) is not valid. In this regime, fluctuations in α become important, resulting in multiplicative noise in the protein numbers. If fluctuations in α are Gaussian, then it is clear that this will result in a lognormal distribution of N because ln(N) = ln(N0) + αt. A lognormal distribution, in fact, fits the tail of the protein distribution in Fig. 3a well. Thus, in this regime one also expects a long-tailed distribution.
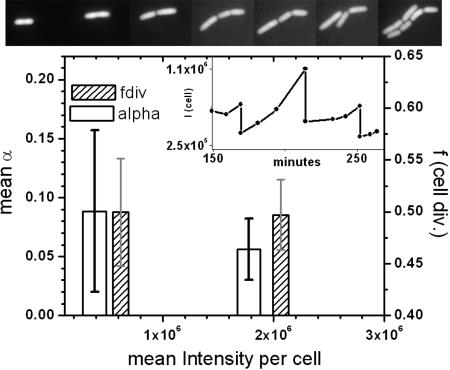
Single-Cell-Tracking Experiments. We have carried out single-cell gene expression tracking experiments to test the prediction of the model that the partitioning noise dominates in the large N regime and the fluctuations in the rate of gene expression dominate in the small N regime. In Fig. 4, the dependence of the noise in the rate of gene expression (α) and the cell division (f) on mean gene expression level is shown, where fcell division = Idaughter/Imother.Ascan be clearly seen in the experiments, for small protein numbers, the noise (standard deviation) in α is dominant, and for large protein numbers, the noise in α and f are comparable (see Experimental Tests of Gene Expression Noise Within Single Cells in Supporting Text).
Fig. 4.
Dependence of noise in the rate of gene expression (α) and the noise in cell division (f) on mean gene expression level. fcell division = Idaughter/Imother. Inset shows a typical fluorescence time trace of a single cell through three cell divisions. (Upper) Snapshots of a bacterial colony at different time points, t = 46, 107, 137, 159, 169, 181, and 212 min (left to right).
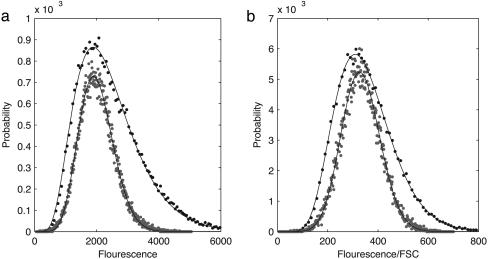
Phenomenological Analysis of Lognormal-to-Gaussian Crossover. Protein distributions from both experiments and variable cell division time simulations show a crossover from long-tailed to Gaussian. We can describe this crossover using a phenomenological approach that does not commit itself to any particular model of the microscopic processes. This approach is analogous to that used to describe a similar crossover from long-tailed to Gaussian distributions of conductance in one-dimensional wires (20). We model the protein number distribution using a simple function, having one natural scale parameter N0 in addition to μ and σ, which is lognormal in the limit of small mean and Gaussian in the limit of large mean (see Phenomenological Analysis of Lognormal-to-Gaussian Crossover of Protein Distribution in Supporting Text). This function provides good fits to the experimental data. The fits for samples at growth hours 5 and 15 are shown in Fig. 5a (fits for all intermediate times for which data are available are shown in Phenomenological Analysis of Lognormal-to-Gaussian Crossover of Protein Distribution in Supporting Text). With N0 fixed, all of the distributions can be fitted by adjusting the two parameters μ and σ. Thus, N0 provides a reference protein number: If the mean of the protein distribution is much larger than N0, then the distribution will be Gaussian, else it will be long-tailed. One way of normalizing for the different phases is to divide the protein number (fluorescence) by the size of the cell (forward scatter; see Experimental Tests of Gene Expression Noise Within Single Cells in Supporting Text). However, because the forward scatter is a nonlinear function of the cell phase, this normalization only partially cancels the growth of protein number during the cell-cycle and we still observe a long-tailed distribution, albeit with a diminished tail (Fig. 5b). A phenomenological analysis of these normalized distributions shows that the crossover from lognormal to Gaussian in this normalized variable is similar to the crossover for the unnormalized variable.
Fig. 5.
Distributions of fluorescence (a) and fluorescence normalized by the corresponding forward scatter signal (FSC) (b) for the 5th-hour (black circles) and 15th-hour (gray circles) samples. The 5th-hour distributions in both figures have been scaled down on the y axis and scaled up on the x axis for visual clarity. Black lines show the fit of the crossover function described in Phenomenological Analysis of Lognormal-to-Gaussian Crossover of Protein Distribution in Supporting Text to the distributions. Fits were obtained by using a nonlinear Levenberg-Marquardt least-squares fitting algorithm. Best fit parameters were as follows. In a, μ = -1.145 and σ = 0.551 for the 5th hour, and μ = 1.586 and σ = 0.649 for the 15th hour, with N0 = 1,500 kept fixed. In b, μ = -0.445 and σ = 0.477 for the 5th hour, and μ = 4.505 and σ = 0.994 for the 15th hour, with N0 = 100 kept fixed.
Implications of Long-Tailed Protein Distributions
Sensitivity of Long-Tailed Distribution to Switches. We now turn to an analysis of the possible implications of the existence of long-tailed protein distributions in cells. We conjecture that long-tailed distributions might be more sensitive than Gaussians to cooperative switches. To test this, we analyze the sensitivity of different distributions to switches by looking at the effect of multiplying the distributions by the response function of a switch: (Kh + ANh)/(Kh + Nh), where h is the Hill coefficient, K is the threshold, A is the amplitude, and N is the input [this functional form fits the experimentally observed response of switches generated by using competition between transcription factors (21)]. The effect of such a multiplication is to shift the peak of the distribution, and the relative shift of the peak is one measure of the sensitivity of the system to the switch. Fig. 6a plots the sensitivity as a function of the switch threshold for a long-tailed distribution (a lognormal with a mean of 164.87 and a standard deviation of 216.12) and a Gaussian distribution with the same mean and standard deviation, keeping all other switch parameters the same (for more details, see Sensitivity of Long-Tailed and Gaussian Distributions to Switches in Supporting Text). Clearly, the long-tailed distribution can be much more sensitive to the switch than the symmetric distributions.
Fig. 6.
The sensitivity of long-tailed (lognormal) and Gaussian distributions to a switch, measured by the relative shift in the peak of the distribution when it is multiplied by the response function of the switch. The sensitivity is plotted as a function of threshold (a) and Hill (b) coefficient of the switch for two distributions: solid line, lognormal distribution with mean 100e = 164.87 and standard deviation  dashed line, Gaussian with the same mean and standard deviation. Nonvaried switch parameters have the following values: h = 4, K = 1,500, and A = 1,000.
Next, we examine the sensitivity for switches with different Hill coefficients. Fig. 6b plots the relative shift of the peak for different values of h, with all other parameters fixed, for the same lognormal and Gaussian distributions. For any given value of Hill coefficient, the sensitivity of the long-tailed distribution is larger than that of the Gaussians. A similar analysis shows that the sensitivity is independent of the switch amplitude, for sufficiently large values of amplitude, and is >10 times larger for the lognormal distribution than for the Gaussian, for a switch with a Hill coefficient of 4 and a threshold of 1,500 (see Sensitivity of Long-Tailed and Gaussian Distributions to Switches in Supporting Text).
This analysis suggests that long-tailed distributions can be more sensitive than Gaussians to switches. Furthermore, the sensitivity of the gene circuit to the switch could be adjusted through evolution by modifying the width and shape of the tail of the distribution, which in turn can be done, in this case, simply by regulating the mean protein number.
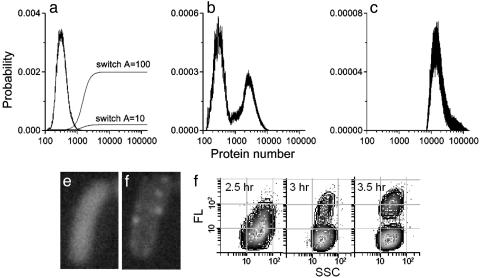
Long-Tailed Distributions and Autoregulation. The combination of a cooperative switch with long-tailed distributions could provide a convenient mechanism for selecting a set of cells from a large population. For instance, if there exists a switch that sharply increases the rate of expression of the given gene at some threshold value of the concentration of its protein product, then cells that are in the long tail will be selected, resulting in a shifting of the peak of the distribution. Fig. 7a shows a long-tailed distribution, obtained from a simulation run, superimposed with the response functions of cooperative switches with a Hill coefficient of 4, a threshold of 1,500, and different amplitudes. When the simulation is repeated with the A = 10 switch added to the model, the bimodal protein distribution of Fig. 7b results. When the amplitude of the switch is increased to A = 100, the peak corresponding to the original population vanishes and the resultant distribution is a single peak centered at a much higher value of protein number (Fig. 7c). The switch is added to the model by multiplying the concentration of RNA polymerase by the response function. Thus, as the protein number, N, increases, the transcription rate also increases. This positive feedback makes the system bistable and the protein distribution bimodal in certain parameter regimes (see Bistability due to Positive Feedback via a Switch in Supporting Text). We believe a mechanism of this sort explains the bimodal distributions presented in Fig. 7 d-f and in ref. 3 for an autoregulatory gene circuit. In that circuit, such a positive feedback might exist because of the strong nonspecific binding of the GFP-lacI fusion protein to DNA. When present in large numbers, its binding to nonspecific DNA sites could release the RNA polymerases bound at those sites, effectively increasing the number of polymerases available for transcription. We have also done simulations of such a system, where we added the following reactions: the folded protein can tetramerize; these tetramers bind strongly to nonspecific sites on the DNA; and RNA polymerases dissociate, resulting in an increase in the gene expression rate. In these simulations, there was no cooperative switch explicitly involved, but the tetramer binding to nonspecific DNA sites acts as a switch of Hill coefficient 4, and a progression from unimodal to bimodal and back to unimodal distributions is observed (see Bistability due to Positive Feedback via a Switch in Supporting Text). Bistability due to a switch added in a positive feedback loop has been observed in a number of systems, ranging from bacteriophages (22) to prokaryotes (23) to eukaryotes (24). Reviews of the requirements for constructing stable bistable switches can be found in refs. 25 and 26.
Fig. 7.
Response of protein distributions to regulatory switches. (a) Long-tailed protein distribution from a simulation run, superimposed with the response functions of a switch with a Hill coefficient of 4, a threshold of 1,500, and amplitudes of 10 and 100, respectively (for clarity of display the functions have been scaled by a factor of 2 × 10⁻⁵). (b) The modified protein distribution when the switch with A = 10 is added to the model (note the change in y scale). (c) The modified protein distribution when the switch with A = 100 is added to the model (note the change in y scale). (d and e) Fluorescence image of a cell under autoregulation at two different time points. d shows a uniform distribution of fluorescence, whereas e shows the same cell having bright spots at different places besides a uniform haze. (f) Scatter plot of fluorescence signal (FL) vs. side scatter (SSC) showing emergence of bimodality in the fluorescence distribution at 3.5 h, from a unimodal distribution at 2.5 h. The SSC distribution remains unimodal throughout.
The Effect of DNA Looping. Regulation of transcription initiation by an operator site that is several hundred base pairs upstream of the promoter is common in eukaryotic systems (27). It has been suggested that this scheme of regulation, with DNA looping, can achieve repression levels far higher than regulation with a single operator site near the promoter (28). We have extended our stochastic simulations to include reaction schemes with DNA looping using an effective increase in the local concentration of the repressor molecule that is bound to the far upstream operator site (29) (see DNA Looping in Supporting Text). In these simulations, we find that the repression level is indeed enhanced, resulting in a much lower mean protein number for the same number of repressors, if the upstream site is sufficiently far from the main operator site. Comparing protein distributions with and without looping, having the same mean protein number, we find that looping results in a longer tailed protein distribution (see DNA Looping in Supporting Text).
We have found that combining DNA looping with a switch also results in sensitive selection of subpopulations of cells with higher protein concentrations. Because of the longer tails, the region of bimodality is much smaller for regulation with DNA looping as compared with operator regulation (see Bistability due to Positive Feedback via a Switch in Supporting Text). Thus, it is conceivable that different mechanisms for regulating transcription initiation, such as enhancer looping, might have been selected in various organisms for the kind of sensitivity they show in response to switches.
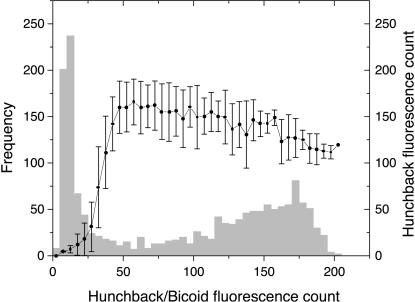
Bicoid and Hunchback in Early-Stage Drosophila Embryos. Switches with sharp thresholds are known to play an important role in embryogenesis. In early-stage Drosophila embryos, the maternal morphogen bicoid acts as a switch that causes the hunchback gene to express in regions of the embryo where the bicoid concentration is above a critical threshold (30, 31). We have examined the expression of hunchback in a Drosophila embryo at cycle 14, taken from the FlyEx database (http://urchin.spbcas.ru/flyex). The database provides fluorescence images of the embryo showing the amounts of bicoid, hunchback, and other proteins in different parts of the embryo, as well as quantitative data of average fluorescence intensities for each protein, for each nucleus seen in the images (32, 33). We have used the quantitative data from the database to construct the histogram of hunchback concentration in the anterior portion of each embryo (see Bicoid and Hunchback in Early-Stage Drosophila Embryos in Supporting Text). Fig. 8 shows the histogram obtained for the embryo named hx21. Note that this histogram has been constructed from nuclei at various locations in the embryo and, hence, does not contain any spatial information. Also superposed on the figure is an estimate of the response function of the bicoid switch. We suggest that a long-tailed distribution of hunchback could be modified by the bicoid switch to produce the bimodal distribution of Fig. 8 in exactly the same way that the distribution of Fig. 7a is modified by the switch to produce the bimodal distribution of Fig. 7b.
Fig. 8.
Light gray bars, histogram of hunchback fluorescence for anterior portion of embryo hx21 from the FlyEx database. Only the 1,606 nuclei with anterior-posterior coordinate between 10% and 70% of the egg length have been considered to create this histogram. Filled circles, an estimate of the response function of the bicoid switch. Each data point shows the mean hunchback fluorescence for nuclei in the corresponding bin (width of five counts) of bicoid fluorescence. Error bars are one standard deviation.
Conclusions
At the microscopic level, long-tailed distributions can occur in, broadly, two ways. One is if the microscopic processes are inherently non-Gaussian; for instance, if there is multiplicative noise in the system, or if the mean numbers are small and there is a lower cutoff. This is the case for the long-tailed distributions of conductance observed in one-dimensional wires, where it is a consequence of the localization of electrons due to disorder. A second way in which long-tailed distributions are produced (for instance, in relaxation spectra of glasses) is by a superposition of Gaussian distributions, each having slightly different means and variances.
Both these ways are observed in our chemical model of gene expression. We have observed two regimes: one having very small protein numbers and lognormal protein distributions that are primarily shaped by the thermal noise, and the other having larger protein numbers and protein distributions that are primarily shaped by the partitioning noise in cell division. In this regime our analysis indicates that the protein distribution is a superposition of Gaussians. Such a superposition can reproduce both the long-tailed distributions seen at early times in the growth curve of the bacterial population as well as the crossover to more symmetric distributions at later times.
Thus, the results of our detailed simulations of gene expression indicate that long-tailed protein distributions are a robust outcome of the constituent chemical processes, in combination with the different sources of noise that affect a cell. An interesting result of our simulations is that there exists a regime where the partitioning noise due to cell division dominates over the thermal noise. Many of the features seen in the simulation are validated by the single-cell experiment presented here.
Because long-tailed distributions are likely to occur, it is probable that cells would evolve to exploit this feature where beneficial and suppress it where harmful. We suggest that one way in which long-tailed distributions could be exploited is by combining them with cooperative switches. A simple, analytically tractable way of combining switches with protein distributions of different shapes reveals that long-tailed distributions are more sensitive than comparable Gaussian distributions. Thus, where sensitivity is useful, the cell might evolve to have a long-tailed distribution, and where a less sensitive response is required, the cell might evolve to have a Gaussian protein distribution.
A more realistic way in which such switches could act on proteins is via a feedback mechanism that increases or decreases the level of expression of the corresponding gene. We have shown that when long-tailed distributions are combined with switches by using a positive feedback loop, this can make the system bistable and result in bimodal protein distributions. As discussed earlier in this article, such bimodal distributions are seen in engineered gene circuits which couple a switch to a GFP gene (16) as well as in an autoregulatory system (3). In ref. 23, there is a discussion of another engineered autoregulatory system with positive feedback that exhibits bimodal protein distributions. This mechanism also provides a way to increase the phenotypic diversity of a population of cells. This is of relevance in early embryogenesis, where producing phenotypic diversity is crucial for subsequent developmental processes, and could explain the observed bimodal distribution of hunchback in early-stage Drosophila embryos. In this context, morphogens could perform the role of the cooperative switches; a morphogen gradient would be a convenient way of exposing cells at different spatial locations to switches with different thresholds or amplitudes.
There are parameter regimes where a switch incorporated via positive feedback does not produce bimodality. In these regimes, the effect is rather to shift the peak of the distribution, thus selecting a subpopulation of cells from the original population. This might be relevant for later stages of embryogenesis, where it becomes necessary for the system to move from producing more phenotypic diversity to selecting specific cells that will trigger further developmental processes. Examples of such selection are well known from studies of neurogenesis, where the Notch signal plays the role of the selective switch. These observations suggest that cells might tune protein distributions to either be sensitive or robust to switches depending on the context and requirements of the cell.
Genome-scale microarray experiments have revealed that the overall distribution of gene expression, taking all of the genes into account, is also long-tailed (34). This overall distribution is a superposition of a number of distributions, with widely varying means, variances, and skews. Switches could act at this larger scale also to select out the portions of the tail of the overall distribution. In contrast to acting on individual genes, a switch acting on this scale would be selecting modules of interconnected genes that are present in the tail of the overall distribution. Thus, we can conjecture that the sensitivity of long-tailed distributions to switches is also exploited at genome-wide scales.
Supplementary Material
Acknowledgments
We thank G. Ananthakrishna, A. Sarin, and K. VijayaRaghavan for helpful discussions.
This paper was submitted directly (Track II) to the PNAS office.
References
- 1.Ozbudak, E. M., Thattai, M., Kurtser, I., Grossman, A. D. & van Oudenaarden, A. (2002) Nat. Genet. 31, 69-73. [DOI] [PubMed] [Google Scholar]
- 2.Elowitz, M., Levine, A. J., Siggia, E. D. & Swain, P. S. (2002) Science 1183-1186. [DOI] [PubMed]
- 3.Banerjee, B., Balasubramanian, S., Ananthakrishna, G., Ramakrishnan, T. V. & Shivashankar, G. V. (2004) Biophys. J 86, 3052-3059. [DOI] [PMC free article] [PubMed] [Google Scholar]
- 4.Mihalcescu, I., Hsing, W. & Leibler, S. (2004) Nature 430, 81-85. [DOI] [PubMed] [Google Scholar]
- 5.Blake, W. J., Kaern, M., Cantor, C. R. & Collins, J. J. (2003) Nature 422, 633-637. [DOI] [PubMed] [Google Scholar]
- 6.Raser, J. M. & O'Shea, E. K. (2004) Science 304, 1811-1814. [DOI] [PMC free article] [PubMed] [Google Scholar]
- 7.Vilar, J. M., Kueh, H. Y., Barkai, N. & Leibler, S. (2002) Proc. Natl. Acad. Sci. USA 99, 5988-5992. [DOI] [PMC free article] [PubMed] [Google Scholar]
- 8.Becskei, A. & Serrano, L. (2000) Nature 405, 590-593. [DOI] [PubMed] [Google Scholar]
- 9.Korobkova, E., Emonet, T., Vilar, J. M., Shimizu, T. S. & Cluzel, P. (2004) Nature 428, 574-578. [DOI] [PubMed] [Google Scholar]
- 10.Sasai, M. & Wolynes, P. G. (2003) Proc. Natl. Acad. Sci. USA 100, 2374-2379. [DOI] [PMC free article] [PubMed] [Google Scholar]
- 11.Thattai, M. & van Oudenaarden, A. (2001) Proc. Natl. Acad. Sci. USA 98, 8614-8619. [DOI] [PMC free article] [PubMed] [Google Scholar]
- 12.Kepler, T. B. & Elston, T. C. (2001) Biophys. J. 81, 3116-3136. [DOI] [PMC free article] [PubMed] [Google Scholar]
- 13.Swain, P., Elowitz, M. & Siggia, E. D. (2002) Proc. Natl. Acad. Sci. USA 99, 12795-12800. [DOI] [PMC free article] [PubMed] [Google Scholar]
- 14.Sato, K., Ito, Y., Yomo, T. & Kaneko, K. (2003) Proc. Natl. Acad. Sci. USA 100, 14086-14090. [DOI] [PMC free article] [PubMed] [Google Scholar]
- 15.Paulsson, J. (2004) Nature 427, 415-418. [DOI] [PubMed] [Google Scholar]
- 16.Kobayashi, H., Kaern, M., Araki, M., Chung, K., Gardner, T. S., Cantor, C. R. & Collins, J. J. (2004) Proc. Natl. Acad. Sci. USA 101, 8414-8419. [DOI] [PMC free article] [PubMed] [Google Scholar]
- 17.Kierzek, A. M., Zaim, J. & Zielenkiewicz, P. (2001) J. Biol. Chem. 276, 8165-8172. [DOI] [PubMed] [Google Scholar]
- 18.Gillespie, D. T. (1977) J. Phys. Chem. 81, 2340-2361. [Google Scholar]
- 19.Puchalka, J. & Kierzek, A. M. (2004) Biophys. J. 86, 1357-1372. [DOI] [PMC free article] [PubMed] [Google Scholar]
- 20.Shapiro, B. (1990) Phys. Rev. Lett. 65, 1510-1513. [DOI] [PubMed] [Google Scholar]
- 21.Rossi, F. M. V., Kringstein, A. M., Spicher, A., Guicherit, O. M. & Blau, H. M. (2000) Mol. Cell 6, 723-728. [DOI] [PubMed] [Google Scholar]
- 22.Hasty, J., Pradines, J., Dolnik, M. & Collins, J. J. (2000) Proc. Natl. Acad. Sci. USA 97, 2075-2080. [DOI] [PMC free article] [PubMed] [Google Scholar]
- 23.Isaacs, F. J., Hasty, J., Cantor, C. R. & Collins, J. J. (2003) Proc. Natl. Acad. Sci. USA 100, 7714-7719. [DOI] [PMC free article] [PubMed] [Google Scholar]
- 24.Becskei, A., Seraphin, B. & Serrano, L. (2001) EMBO J. 20, 2528-2535. [DOI] [PMC free article] [PubMed] [Google Scholar]
- 25.Ferrell, J. E. & Machleder, E. M. (1998) Science 280, 895-898. [DOI] [PubMed] [Google Scholar]
- 26.Ferrell, J. E. (2002) Curr. Opin. Cell Biol. 14, 140-148. [DOI] [PubMed] [Google Scholar]
- 27.Schleif, R. (1992) Annu. Rev. Biochem. 61, 199-223. [DOI] [PubMed] [Google Scholar]
- 28.Vilar, J. M. & Leibler, S. (2003) J. Mol. Biol. 331, 981-989. [DOI] [PubMed] [Google Scholar]
- 29.Rippe, K. (2001) Trends Biochem. Sci. 26, 733-740. [DOI] [PubMed] [Google Scholar]
- 30.Driever, W. & Nusslein-Volhard, C. (1989) Nature 337, 138-143. [DOI] [PubMed] [Google Scholar]
- 31.Houchmandzadeh, B., Wieschaus, E. & Leibler, S. (2002) Nature 415, 798-802. [DOI] [PubMed] [Google Scholar]
- 32.Kosman, D., Reinitz, J. & Sharp, D. H. (1999) in Proceedings of the 1998 Pacific Symposium on Biocomputing, eds. Altman, R., Dunker, K., Hunter, L. & Klein, T. Available at www-smi.stanford.edu/projects/helix/psb98.
- 33.Kosman, D., Small, S. & Reinitz, J. (1998) Dev. Genes Evol. 208, 290-294. [DOI] [PubMed] [Google Scholar]
- 34.Naef, F., Hacker, C. R., Patil, N. & Magnasco, M. (2002) Genome Biol. 3, 0018.1-0018.11. [PubMed] [Google Scholar]
Associated Data
This section collects any data citations, data availability statements, or supplementary materials included in this article.


