Abstract
Multiple unstable spiral waves rotating around phase singularities (PSs) in the heart, i.e., ventricular fibrillation (VF), is the leading cause of death in the industrialized world. Spiral waves are ubiquitous in nature and have been extensively studied by physiologists, mathematicians, chemists, and biologists, with particular emphasis on their movement and stability. Spiral waves are not easy to terminate because of the difficulty of “breaking” the continuous spatial progression of phase around the PSs. The only means to stop VF (i.e., cardiac defibrillation) is to deliver a strong electric shock to the heart. Here, we use the similarities between spiral wave dynamics and limit cycle oscillators to characterize the spatio-temporal dynamics of VF and defibrillation via phase-resetting curves. During VF, only PSs, including their formation and termination, were associated with large phase changes. At low shock strengths, phase-resetting curves exhibited characteristics of weak (type 1) resetting. As shock strength increased, the number of postshock PSs decreased to zero coincident with a transition to strong (type 0) resetting. Our results indicate that shock-induced spiral wave termination in the heart is caused by altering the phase around the PSs, such that, depending on the preshock phase, sites are either excited by membrane depolarization (phase advanced) or exhibit slowed membrane repolarization (phase delay). Strong shocks that defibrillate break the continuity of phase around PSs by forcing the state of all sites to the fast portion of state space, thus quickly leading to a “homogeneity of state,” subsequent global repolarization and spiral wave termination.
Keywords: defibrillation, phase resetting curve
Many systems in nature exhibit incredibly varied spatio-temporal patterns such as traveling waves, spiral waves, and Turing patterns (1-7). Spiral waves rotate around phase singularities (PSs) and often do not remain stationary and can even break up into a state of defect-mediated turbulence (7, 8). During ventricular fibrillation (VF), PS pairs of opposite chirality are mutually annihilated if the phase gradient between them is sufficiently large to halt propagation (9). The probability of all PSs extinguishing at the same time, and thus resulting in spontaneous termination of VF, varies with the size of the heart (10). In humans, VF almost never terminates spontaneously, and electrical defibrillators are necessary to stop VF and restore the normal rhythm.
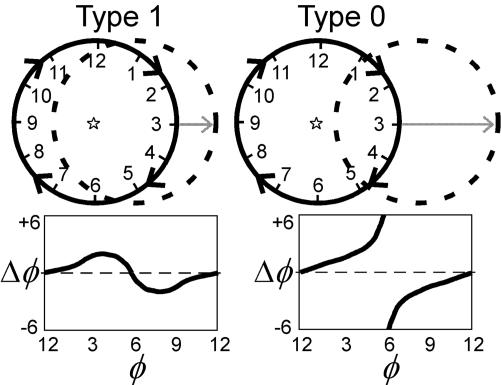
Normally, the human heart beats about once per second; a pacemaker region periodically generates an electrical wave that propagates rapidly through the heart, triggering nearly synchronous contraction. Like many oscillators, this pacemaker region can be reset by an advance or a delay that depends on the time and strength of the stimulus (11, 12). Typically, periodic systems are characterized as limit cycle oscillators (similar to the minute hand moving around a clock) and the stimulus-induced perturbations are described by using phase-resetting curves (PRCs) (13, 14). Traditionally, phase is defined by using time encoding such that phase is defined as the time since the last “event,” normalized by the oscillation period, where the event is some marker of the oscillatory cycle (13, 14). There are two fundamental types of phase resetting: type 1 (or odd) and type 0 (or even). Type 1 resetting occurs for a weak stimulus and involves a return of the oscillation with a phase shift (advance or delay) less than half a cycle. Type 0 resetting involves a strong stimulus that knocks the system out of its basin of attraction, resulting in a phase shift larger than half a cycle. Graphically, type 1 resetting can be thought of as a shift in a circular limit cycle such that the center of the unshifted cycle (Fig. 1, solid lines) is within the shifted limit cycle (Fig. 1, dashed lines) whereas for type 0 resetting the center of the unshifted cycle is outside the shifted cycle (see Fig. 1). A weak stimulus results in a continuous PRC, whereas a strong stimulus results in a discontinuous PRC.
Fig. 1.
Weak and strong phase resetting using time encoding. Time-encoded phase (φ) is represented as the position of a hand on a clock. A weak stimulus causes a small perturbation in φ, resulting in type 1 resetting. A strong stimulus causes a large perturbation in φ, resulting in type 0 resetting. (Upper) Graphical illustration of type 1, weak (Left) and type 0, strong (Right) phase resetting; the original limit cycle trajectory is shown as a solid circle with a star indicating its origin; the “shifted” cycle is shown as a dashed circle. (Lower) The change in phase (Δφ) resulting from a stimulus versus the time when the stimulus is applied (φ), i.e., a PRC for type 1 (Left) and type 0 (Right) resetting.
It is not immediately clear that the use of PRCs is valid to study VF and defibrillation because: (i) the spatial distribution of phase during VF (e.g., PSs and rotors) control its behavior; (9) and (ii) each site does not exhibit strictly periodic dynamics. Despite the lack of mathematical formalism, the similarities between limit cycle oscillators and spatially distributed excitable systems have been investigated by analytical, graphical, and topological methods (14-18). For example, reentry in a 1D ring of excitable elements is analogous to a limit cycle oscillation if the conduction speed is constant ensuring an unvarying period (15). In VF the period at any given site is not exactly periodic so the definition of a standard period (required for time encoding of phase) becomes subjective, and more importantly the mapping from the phase representation around a “clock” to the spatial distribution of phase around a ring becomes nonunique. State space encoding of phase overcomes the limitation of strict periodicity because every period corresponds to 2π, regardless of its duration (9, 14, 18, 19). Therefore, during VF, a direct mapping of cyclic phase defined in state space to the spatial distribution of phase is possible with state space encoding but not time encoding.
Methods
Study Protocol. The experimental protocol has been described in detail elsewhere (20). See Supporting Methods, which is published as supporting information on the PNAS web site, for additional details. Briefly, pigs (20-25 kg) of either sex were anesthetized and maintained under physiologic conditions. The heart was isolated and perfused at a constant flow of 220 ml/min with 37 ± 1°C Tyrode's solution and gassed with 95% O2, 5% CO2. Biphasic, truncated exponential shocks (6/4 ms) were delivered between a 34-mm platinum-coated titanium coil defibrillation catheter electrode (Guidant, Indianapolis) in the right ventricle (cathodal, first phase) and a titanium mesh electrode (2.5-cm diameter) sutured to the right atrium from a defibrillator (Ventritex HVS-02, Ventritex, Sunnyvale, CA). VF was induced by delivering 60-Hz alternating current to the electrode at the catheter tip, and defibrillation shocks were applied 10 s after initiation. Shock strengths were incremented from 100 to 900 V in 100-V increments. Each defibrillation attempt was classified as success or failure based on the absence or presence of arrhythmic activity from the ECG and optical maps 2 s after the shock. Rescue shocks of 20-30 Joules were required for all failed attempts, and 2 min were allowed to elapse between VF episodes.
Optical Mapping. Diacetyl monoxime (20 mM/liter) was added to the perfusate to stop cardiac motion. Hearts were stained with 1-[3-sulfonatopropyl]-4-[β-[[2-(di-n-butylamino-6-napthyl]vinyl]pyridinium(di-4-ANEPPS) (10.4 μM/liter, Molecular Probes), and transmembrane activity from the anterior and posterior epicardial surfaces was recorded from 0.5 s before until 2.5 s after each shock by two charge-coupled device cameras (MiCam01, Sci-Media, Tokyo) each with 64 × 96 pixels and acquiring images at 250 frames per s (20). Each pixel corresponded to an epicardial area of 0.66 ± 0.14 mm2. The fluorescence signals were filtered by using a five-point median temporal filter followed by a 3 × 3 × 3 boxcar spatio-temporal filter. In contrast to our previous study, (20) a spatio-temporal filter was applied because we have found that phase map analysis is improved by smoothing repolarization. All recordings were normalized such that the minimum and maximum preshock values, and thus the action potential amplitude during VF for all sites, were identical. Movies of raw fluorescence, filtered fluorescence, and phase are provided as Movies 1-4, which are published as supporting information on the PNAS web site. Until it is possible to record transmembrane potential from many sites in the beating human heart, we are limited to animal studies in this regard; many issues remain to be resolved such as the effects of disease, species variations, heart isolation, diacetyl monoxime, etc.
Data Analysis. The fluorescence signal at each site, F(t), was converted to a “phase” signal, θ(t), as
 |
[1] |
where F50 was the 50% level of F(t) and τ was equal to 12 ms (9). Phase differences were computed as Δθ = θ(t + τ) - θ(t); this corresponds to a total time interval of 24 ms (see Eq. 1), which allowed us to study dynamics on the time scale of the duration of the shock (10 ms). Because τ > 0, phase decreases during an action potential, therefore Δθ < 0 indicates a phase advance, whereas Δθ > 0 indicates a phase delay. However, because of the cyclical nature of θ, |Δθ| is restricted to values <π, such that if Δθ is more negative than -π, it is actually a phase delay, and vice versa. We use the term PRC here to refer to graphs of Δθ versus θ(t).
The dynamic spatial patterns of transmembrane potential, F(x, y, t), were depicted as either phase maps, θ(x, y, t), or isochrone maps (9, 21, 22). One of the main advantages of our phase mapping technique is its spatial (<2 mm2) and temporal (<12 ms) localization; these scales (postsignal processing) are much smaller than the relevant dynamics (spiral wave core area is ≈30 mm2 and period is ≈90 ms) (20, 23). The sites where all phase values converge, specifically, the condition
 |
[2] |
denotes a PS where the line integral is along any closed curve, and the sign of this integral indicates its chirality. Although all PSs do not represent complete reentrant pathways, a PS is always present for complete reentry (rotor); thus, the number of PSs at any instant is greater than or equal to the number of reentrant waves (9). An isochrone map depicts the position of the wavefront as it propagates during one beat. First, the depolarization time was computed for each site as the time when θ =+π/2 (this corresponds to the time the fluorescence signal crosses the 50% level during depolarization). Second, contour maps were generated from the spatial distribution of depolarization times.
Results
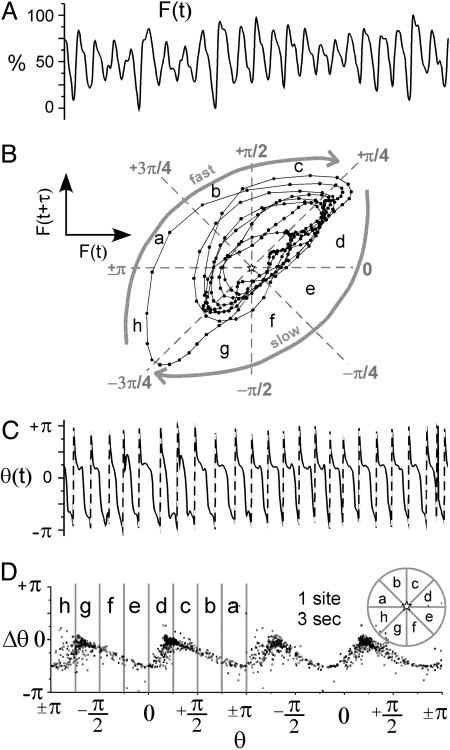
During VF, fluorescence signals from the heart surface exhibited a strong periodicity with action potentials of varied morphology and duration (Fig. 2A). Because of this strong (but not strict) periodicity, fluorescence signals plotted in reconstructed state space were characterized by trajectories circling around the midpoint (F50) in a clockwise direction (Fig. 2B) (9). The trajectories were characterized by a fast segment in the region where F(t + τ) > F(t), representing depolarization, and a slow portion, F(t + τ) < F(t), representing repolarization. A typical PRC generated from the phase signal from individual sites, θ(t), during VF is shown in Fig. 2D. These PRCs were not flat and exhibited small to moderate values of Δθ < 0 with most values between 0 and -π/2 (Fig. 2D) (see Fig. 7, which is published as supporting information on the PNAS web site).
Fig. 2.
VF (single site dynamics). (A) Fluorescence signal from a site on the surface of the heart, F(t), during 3 s of VF. (B) One second of fluorescence signal in A plotted in reconstructed state space, i.e., F(t + τ) versus F(t). (C) Phase signal, θ(t), computed from the signal in A using Eq. 1. The dashed lines indicate an artificial increase in phase caused by the cyclical nature of the atan function. (D) PRC generated from fluorescence signal in A. The PRC data are plotted twice to span two full cycles (4 π) as is typical for PRCs. The stars indicate the origin in state space, i.e., F50, F50; see Methods.
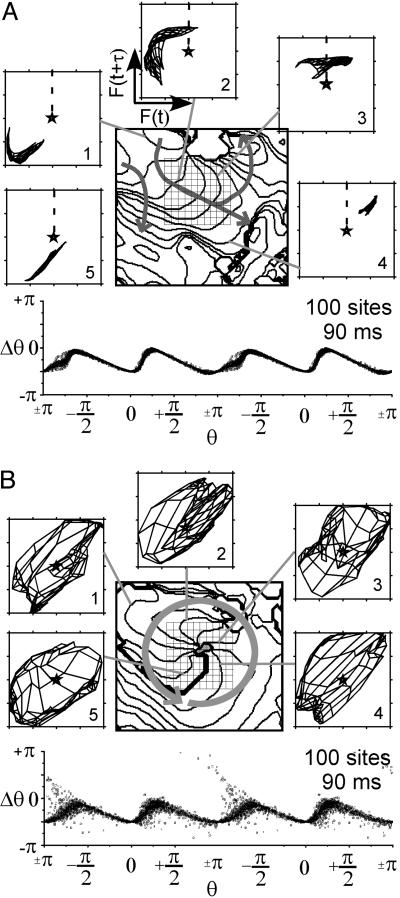
The relationship between the dynamics of the spatial patterns of fluorescence, F(x, y, t), during VF and phase resetting is shown in Fig. 3. F(x, y, t) during VF was complex and varied, yet electrical impulse propagation on small spatial (≈2 cm) and short time (≈80 ms) scales could be characterized as roughly planar, reentrant, wave collision, and formation and annihilation of PSs. The mapping of F(x, y, t), to reconstructed state space (24) and the associated phase dynamics that characterize planar wave propagation (Fig. 3A) and reentry (Fig. 3B) are shown. The dynamics of a central 10 × 10 pixel region of F(x, y, t), as indicated by the square grid in Fig. 3, are mapped to state space while maintaining the spatial relationship through a “mesh” such that neighboring pixels are connected by lines. For example, the mesh of F(x, y, t) during pure plane wave propagation would collapse to a line in state space (18). The pattern of wavefront propagation is shown in Fig. 3A. As the waves propagate through this central 10 × 10 pixel region, its F(x, y, t) mesh moves as a group around the state space origin (F50) in a clockwise manner. This mesh moves similarly to the trajectories for a single site and hence the PRC associated with this region is similar to that for a single cell during pacing (see Fig. 7). The PRC generated from phase for these 100 sites for the duration of this beat is shown under the isochrone map in Fig. 3A. A similar figure for wave collision is seen in Fig. 8, which is published as supporting information for the PNAS web site. The state space dynamics and phase resetting of F(x, y, t) during reentry were quite different (Fig. 3B). During reentry, the F(x, y, t) mesh covered the state space origin (F50) during the entire rotation period, although the mesh rotated. The sites near the center of the reentrant wave exhibited very small amplitude oscillations and thus remained near the origin in state space. For this reason, and because the tip of the wave rotated around a small region (gray stippled area), a number of sites exhibited large phase changes in the PRC.
Fig. 3.
VF [state space dynamics of planar (A) and reentrant (B) propagation]. (A Upper and B Upper) Isochrone maps indicate the position of the wavefront every 8 ms during one beat. Arrows indicate the direction of propagation. (A Lower and B Lower) PRC generated from a 10 × 10 pixel region indicated by grid in the isochrone map. Fluorescence signals from this same region are plotted in reconstructed state space (numbers represent sequence and gray lines indicate the corresponding isochrone; dashed line indicates depolarization time).
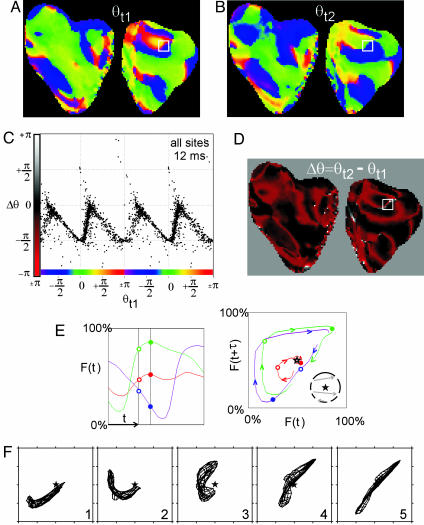
Phase maps during VF (Fig. 4 A and B) were similar to those reported previously (9). To construct PRCs (for all sites), we subtracted phase images separated in time by 12 ms. The representation of spatial data as a PRC is justified here because, unlike time-encoded phase, state space-encoded phase exhibits a direct mapping from state space to real space even for aperiodic phenomena (see Introduction for more details). The spatial distribution of the change in phase, Δθ(x, y), during VF (over a 12-ms interval) is shown in Fig. 4D, and the corresponding PRC is shown in Fig. 4C. The interpretation of these spatial PRCs and Δθ(x, y) is aided by examining the events occurring during the formation and termination of opposite chirality PS pairs (Fig. 4 E and F). During both PS pair initiation and annihilation wave propagation is blocked in the isthmus between the PSs (9). These two events result in important topological changes in the phase distribution (i.e., the generation or mutual annihilation of PS pairs) and are associated with large phase gradients in the isthmus. Successful propagation in front of the “line of block” corresponds to a trajectory in state space that encircles the origin (Fig. 4E, green). Unsuccessful propagation behind the line of block corresponds to a trajectory in state space that does not encircle the origin (Fig. 4E, purple). Sites along the isthmus, between sites that blocked and those that did not, exhibited a large but continuous (albeit modulus 2π) Δθ gradient (red site represents a site very close to the line of block, Fig. 4E). The associated dynamics of F(x, y, t) in state space (Fig. 4F) demonstrate a transition of the mesh rotating around the origin (F50) before the formation of the PS pair to the mesh spanning the origin immediately after the formation of the singularities. The important dynamics of PS formation is the stretching of the mesh of points across the origin in state space such that the resulting distribution encompasses all values of θ (see figure 3 in ref. 18). Therefore, the few sites exhibiting Δθ > + π/2 and Δθ <-π/2 occur in regions near the center of reentry (Fig. 3B) and where propagation is blocked because new singularity pairs are formed (Fig. 4) or singularity pairs are mutually annihilated.
Fig. 4.
Phase resetting during VF. (A and B) Phase maps from the surface of the pig heart (front surface on left, back surface on right) at time t1 (A) and time t2 (B); t2 - t1 = 12 ms. (C) PRC generated from all sites; Δθ plotted versus the phase at time t1, i.e., D plotted versus A, only every fourth point is plotted for clarity. (D) A map of the change in phase (Δθ) from time t1 to time t2, specifically, the phase map in B minus the phase map in A.(E) One hundred milliseconds of the fluorescence signal F(t) from sites ahead (green), behind (purple), and near (red) a line of block (within white box in A, B, and D). The black vertical bars indicate the time of the phase maps in A and B, i.e., t1 and t2.(Right) The same fluorescence signals plotted in reconstructed state space. The open circles indicate the values of F(t = t1), and filled circles represent values of F(t = t2). (F) Fluorescence signals from within the white box are plotted in reconstructed state space during the formation of a pair of PSs.
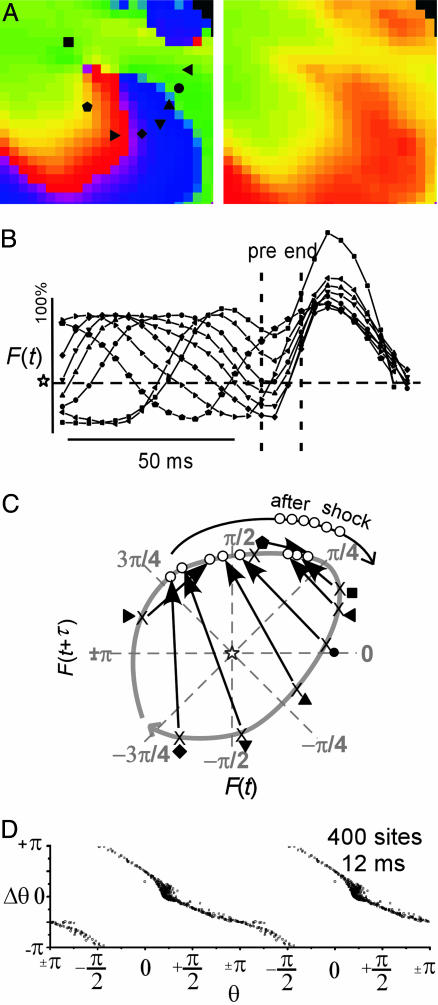
The spatial distribution of current crossing the cardiac membrane during a shock depends on the electric field as well as the heart geometry, resulting in a very complex pattern of local stimulus (25). Usually, each PRC is generated for a particular stimulus strength, so if we are generating PRCs from phase maps and the stimulus strength varies across the heart surface, what are we to do? VF is maintained by spiral waves (i.e., rotors) rotating around PSs, (9) therefore successful defibrillation must result in the elimination of all PSs (19, 27). Therefore, it is not the exact spatial distribution of local stimulus that is important, but the interaction of the local stimulus and the existing phase distribution that is required to eliminate PSs. First, we examine the events occurring during the elimination of a spiral wave. The elimination of a spiral wave resulting from a 500-V shock (unsuccessful defibrillation) is shown in Fig. 5. Immediately before the shock, the continuous progression of phase around the PS is evident (Fig. 5A Left), while the singularity does not exist at the end of the shock (Fig. 5A Right). The shock acts primarily to depolarize this region, followed by a fairly synchronous repolarization process (Fig. 5B). Sites at various phases are forced by the shock to new locations in reconstructed state space (Fig. 5C). Importantly, all of these sites were shifted to the fast portion of state space, which allowed the grouping of sites in state space after the shock and hence the synchronous recovery (see the open circles on the black line labeled “after shock” in Fig. 5C). The spatial PRC (for this region only) shown in Fig. 4D exhibits strong, (type 0) resetting. Therefore, the mechanism of spiral wave termination is shock-induced phase resetting from the slow to the fast portion of state space, which breaks the continuity of phase around the singularity. In addition, this resetting occurs via a critical combination of delayed recovery of sites early in repolarization (+π/4 > θ > -π/4) and excitation of sites in late repolarization (-π/2 > θ > -3π/4). These particular shock-induced phase changes for sites experiencing repolarization immediately preceding the shocks are available in Fig. 9A, which is published as supporting information on the PNAS web site, as a function of shock strength. Fig. 5 illustrates the similarities between strong (type 0) phase resetting associated with shock-induced spiral wave termination and strong resetting associated with a stimulus that knocks a limit cycle oscillator out of its basin of attraction (see Fig. 1).
Fig. 5.
Shock-induced termination of a spiral wave. (A) Phase maps from a small (20 × 20 pixels) region containing a PS from the heart surface immediately before (Left) and after (Right) a 500-V shock. (B) Fluorescence signals, F(t), from the sites surrounding the PS before, during, and after the shock (symbols correspond to locations shown in A). (C) Shock-induced movement of sites surrounding the PS in reconstructed state space. The arrows indicate how these sites were shifted by the shock; the open circles represent the state immediately after the shock. (D) PRC generated from the data in A.
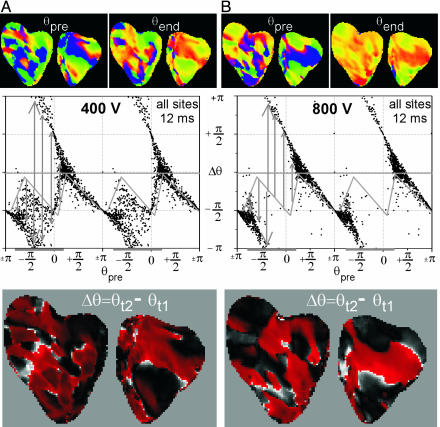
Overall, the shape of the PRCs constructed from all sites exhibited progressively larger differences compared with the PRC during VF as shock strength increased. The shape of the PRC changed from weak (type 1) to strong (type 0), resetting as shock strength increased from 100 to 900 V (see Fig. 6; PRCs from all episodes at even shock strengths are available in Fig. 10, which is published as supporting information on the PNAS web site). We have previously shown that the number of postshock PSs decreased with shock strength to zero for 600 V and above (26).
Fig. 6.
Phase resetting during defibrillation shocks. (A) Unsuccessful defibrillation resulting from a 400-V shock. (B) Successful defibrillation resulting from a 800-V shock. (A Top and B Top) Phase maps immediately preceding the shock, θpre, and at the end of the shock, θend.(A Middle and B Middle) The associated PRCs (i.e., Δθ versus θpre, where Δθ = θend - θpre) for all sites. The gray diagonal lines indicate the PRC during VF, the horizontal gray bars indicate the slow portion of the VF cycle, and the vertical gray bars indicate the shock-induced resetting. (A Bottom and B Bottom) The spatial distribution of Δθ.
Discussion
The mechanisms of cardiac defibrillation have been debated for many years (27). Prominent theories include: (i) the “critical mass hypothesis” that states reentrant waves must be eliminated in a sufficient region of the heart such that the reentrant waves in the unaffected region self-extinguish, (ii) the “extension of recovery hypothesis” that states shocks act to prolong the repolarization process such that postshock wave fronts cannot propagate because they all encounter refractory tissue, and (iii) the “synchronization of recovery hypothesis” that states shocks act to synchronize the repolarization process such that postshock wave fronts do not encounter regions of heterogeneous refractoriness, causing the reinitiation of reentrant waves and VF. A comparison of our results with more traditional measures is available in Fig. 9.
Here, we present a strategy to analyze defibrillation in terms of phase resetting that provides a comprehensive picture of the requirements for termination of multiple unstable spiral waves. Because VF is maintained by reentrant spiral waves, a theory that encompasses the events required to terminate PSs is necessary. It should be appreciated that the reinitiation (as opposed to continuation) of VF may occur after strong defibrillation shocks (26). The condition for terminating a spiral wave is to disrupt the continuous change in phase around the singularity, and this disruption can only be accomplished by distorting the rings of phase around the singularity such that they do not encircle the singularity (this corresponds to type 0 resetting as shown in Fig. 1). The spatial complexity of VF as well as the short lifetime of most singularities (i.e., its short-term unpredictability) makes the analysis of the effects defibrillation shocks extremely difficult. Using PRCs and the similarity of spiral wave dynamics to limit cycle oscillators we have shown the criterion to eliminate all PSs during VF.
Supplementary Material
Acknowledgments
This work is dedicated to the memory of Art Winfree. We thank John P. Wikswo, Jr., and Niels Otani for valuable discussion, Leon Glass for providing feedback on an earlier version of the manuscript, Raymond E. Ideker for financial support, and the reviewers for helpful suggestions that improved the manuscript considerably. This work was supported by National Institutes of Health Grants R01-HL63267 (to R.A.G.), R01-HL42760 (to Raymond E. Ideker), and TRF RSA4680010 (to N.C.).
Author contributions: R.A.G. and N.C. designed research; R.A.G. and N.C. performed research; R.A.G. contributed new reagents/analytic tools; R.A.G. analyzed data; and R.A.G. wrote the paper.
This paper was submitted directly (Track II) to the PNAS office.
Abbreviations: PS, phase singularity; VF, ventricular fibrillation; PRC, phase resetting curve.
References
- 1.Zankin, A. & Zabothinsky, A. (1970) Nature 255, 535-538. [Google Scholar]
- 2.Winfree, A. T. (1972) Science 175, 634-636. [DOI] [PubMed] [Google Scholar]
- 3.Davidenko, J. M., Pertsov, A. V., Salomonsz, R., Baxter, W. & Jalife, J. (1992) Nature 355, 349-351. [DOI] [PubMed] [Google Scholar]
- 4.Palsson, E. & Cox, E. C. (1996) Proc. Natl. Acad. Sci. USA 93, 1151-1155. [DOI] [PMC free article] [PubMed] [Google Scholar]
- 5.Levine, H., Aranson, I., Tsimring, L. & Truong, T. V. (1996) Proc. Natl. Acad. Sci. USA 93, 6382-6386. [DOI] [PMC free article] [PubMed] [Google Scholar]
- 6.Haim, D., Li, G., Ouyang, Q., McCormick, W. D., Swinney, H. L., Hagberg, A. & Meron, E. (1996) Phys. Rev. Lett. 77, 190-193. [DOI] [PubMed] [Google Scholar]
- 7.Ouyang, Q., Swinney, H. L. & Li, G. (2000) Phys. Rev. Lett. 84, 1047-1050. [DOI] [PubMed] [Google Scholar]
- 8.Coullet, P., Gil, L. & Lega, J. (1989) Phys. Rev. Lett. 62, 1619-1622. [DOI] [PubMed] [Google Scholar]
- 9.Gray, R. A., Pertsov, A. M. & Jalife, J. (1998) Nature 392, 75-78. [DOI] [PubMed] [Google Scholar]
- 10.Winfree, A. T. (1994) Science 266, 1003-1006. [DOI] [PubMed] [Google Scholar]
- 11.Jalife, J. & Antzelevitch, C. (1979) Science 206, 695-697. [DOI] [PubMed] [Google Scholar]
- 12.Guevara, M. R., Glass, L. & Shrier, A. (1981) Science 214, 1350-1353. [DOI] [PubMed] [Google Scholar]
- 13.Glass, L. (1988) From Clocks to Chaos (Princeton Univ. Press, Princeton).
- 14.Winfree, A. T. (2000) The Geometry of Biological Time (Springer, New York).
- 15.Glass, L. & Josephson, M. E. (1995) Phys. Rev. Lett. 75, 2059-2062. [DOI] [PubMed] [Google Scholar]
- 16.Winfree, A. T. (1977) Science 197, 761-763. [DOI] [PubMed] [Google Scholar]
- 17.Keener, J. P. (2004) J. Theor. Biol. 230, 459-473. [DOI] [PubMed] [Google Scholar]
- 18.Otani, N. F. & Hwa, R. (1994) Physica D. 77, 434-455. [Google Scholar]
- 19.Oprisan, S. A., Thirumalai, V. & Canavier, C. C. (2003) Biophys. J. 84, 2919-2928. [DOI] [PMC free article] [PubMed] [Google Scholar]
- 20.Chattipakorn, N., Banville, I., Gray, R. A. & Ideker, R. E. (2001) Circulation 104, 1313-1319. [DOI] [PubMed] [Google Scholar]
- 21.Gray, R. A. & Banville, I. (2002) in Quantitative Cardiac Electrophysiology, eds. Cabo, C. & Rosenbaum, D. S. (Dekker, New York), pp. 623-659.
- 22.Banville, I., Chattipakorn, N. & Gray, R. A. (2004) J. Cardiovasc. Electrophysiol. 15, 455-463. [DOI] [PubMed] [Google Scholar]
- 23.Pertsov, A. M., Davidenko, J. M., Salomonsz, R., Baxter, W. T. & Jalife, J. (1993) Circ. Res. 72, 631-650. [DOI] [PubMed] [Google Scholar]
- 24.Larson, C., Dragnev, L. & Trayanova, N. (2003) Ann. Biomed. Eng. 31, 768-780. [DOI] [PubMed] [Google Scholar]
- 25.Tang, A. S. L., Wolf, P. D., Afework, Y., Smith, W. M. & Ideker, R. E. (1992) Circulation 85, 1857-1864. [DOI] [PubMed] [Google Scholar]
- 26.Chattipakorn, N., Banville, I., Gray, R. A. & Ideker, R. E. (2004) Cardiovasc. Res. 61, 39-44. [DOI] [PubMed] [Google Scholar]
- 27.Dillon, S. M. & Gray, R. A. (2001) in Foundations of Arrhythmogenesis, eds. Spooner, P. M. & Rosen, M. R. (Dekker, New York), pp. 513-546.
Associated Data
This section collects any data citations, data availability statements, or supplementary materials included in this article.


