Abstract
Diffraction data acquisition is the final experimental stage of the crystal structure analysis. All subsequent steps involve mainly computer calculations. Optimally measured and accurate data make the structure solution and refinement easier and lead to more faithful interpretation of the final models. Here, the important factors in data collection from macromolecular crystals are discussed and strategies appropriate for various applications, such as molecular replacement, anomalous phasing, atomic-resolution refinement etc., are presented. Criteria useful for judging the diffraction data quality are also discussed.
Keywords: Diffraction data collection, Diffraction data quality, Data collection strategy
1 Introduction
Obtaining diffraction-quality crystals is obviously a necessary precondition for solving any macromolecular structure by X-ray diffraction methods. This may be a difficult endeavor, but once appropriate crystals are obtained, it is necessary to submit them to the diffraction data collection process. This is in fact the last truly experimental stage of the crystal structure analysis, because all succeeding steps involve mainly computer calculations, and may be modified and repeated with different programs or parameters. However, the availability of high quality of diffraction data makes the subsequent steps smoother and leads to more accurate and reliable results of the structure analysis.
In the first decades of protein crystallography the data collection process was long, tedious, and required a high level of competence and attention from the experimenters. The enormous progress achieved in the last decades in the hardware and software involved in the macromolecular data collection has changed this situation. Currently diffraction data may often be successfully measured and processed by researchers who lack deep knowledge of the underlying principles, by conducting the synchrotron experiments remotely from their own laboratories, using their own laptops. Nevertheless, in spite of the availability of very powerful radiation sources, highly automatic hardware controls, very efficient detectors, and intelligent processing programs, data collection is a scientific process, not a mere technicality. The sub-optimal data quality, lower than the level that the crystal is capable of providing, will rebound painfully in all further steps of structure analysis.
However, in practice it is seldom possible to obtain an “ideal” set of diffraction data, characterized by very high resolution, accuracy, and completeness. Unfortunately, it is difficult to satisfy all these requirements at the same time. Measuring very weak, high-resolution reflections involves long exposure to X-rays, which introduces significant radiation damage resulting in diminished accuracy or incomplete data. Collecting and merging data from a series of crystals may alleviate this problem, if all crystals are perfectly isomorphous, otherwise the data accuracy may suffer again. In practice, the data collection process involves various compromises between several requirements, but these compromises should be chosen according to certain principles, depending on the particular intended application of diffraction data. The theory underlining the diffraction data acquisition on two-dimensional detectors can be found in several publications [1-3] and practical guidance during the experiment can be obtained from the strategy programs, such as e.g. BEST [4].
Different planned applications put different priorities on various characteristics of measured data sets. Diffraction data intended for the final atomic model refinement should extend to as high a resolution as the crystal can provide. Certain level of radiation damage can be tolerated, or data may be merged from multiple crystals. If exposures necessary to adequately measure the weak, high-resolution reflections lead to many saturated detector pixels, multiple passes of data collection are advisable with different effective exposures.
The data intended for structure solution by molecular replacement do not need to extend to high resolution, since only relatively low resolution data are used in this approach anyway. Since this method is based on the comparison of Patterson functions, the strongest reflections are especially prominent, and the completeness of the low-resolution data is therefore very important. Similarly, what is important for the identification of potential small-molecule ligands is rapid measurement of a large number of data sets, but their resolution is not so crucial. After identification of the complexes, high-resolution data may be collected afterwards.
Data to be used for phasing based on anomalous signal must be of as high accuracy as possible, since the anomalous differences are very small, on the order of a few percent of the total reflection intensities, or even smaller in case of sulfur utilized as an anomalous scatterer. Radiation damage should be avoided by limiting the exposures, or by measuring data from multiple crystals. The data collected from heavy-atom derivatives should have similar, perhaps somewhat less stringent characteristics.
Often only one set of data is collected and used for structure solution and refinement. It should then partially satisfy various, somewhat contradicting requirements. Intelligent decisions need to be made in order to achieve in such cases the optimal compromise. The following sections will discuss the most important factors influencing the quality of diffraction data collected by the single-crystal rotation mode.
2 Data completeness
2.1 Asymmetric unit in reciprocal space
A complete data set should contain all reflections within the asymmetric unit of the reciprocal space for the particular symmetry of the crystal. The concept of the asymmetric unit in the reciprocal space is different from the asymmetric unit of the cell in the crystal direct space. In direct space the asymmetric unit is a fraction of the cell that by the action of all symmetry operations of the crystal space group, completely covers the whole unit cell. The volume of such an asymmetric unit is Vcell/n, where n is the number of independent symmetry operators of the space group. The proposed definitions of direct cell asymmetric units are presented for each space group in the International Tables, Vol. A [5] and usually have the shape of a parallelepiped, except in cubic symmetry where the shapes are more complicated.
An asymmetric unit in the reciprocal space has the shape of a wedge with its apex at the origin, extending away to the limit of data resolution and bounded by the symmetry elements of the crystal point group (or, rather, its Laue symmetry). In the following text the term “asymmetric unit” will always refer to the reciprocal space. The definition of the reciprocal space asymmetric unit depends on the point group, not the space group, and is e.g. the same for crystals of P422, P43212 or I4122 symmetries. An example of the asymmetric unit in the reciprocal space for the crystal of 622 symmetry is shown in Fig. 1. The definitions of reciprocal space asymmetric units for all “macromolecular” (i.e. not containing centers of symmetry or mirror planes) crystal classes standardized according to CCP4 are presented in Table 1. However, these definitions apply to the native data, where the anomalous scattering is not taken into account. As a consequence of the anomalous diffraction effects, reflections related by the center of symmetry or mirrors have different intensities, hence it is necessary to record all reflections in the “anomalous asymmetric unit”, comprising two native asymmetric units related by the center of symmetry or mirror planes existing in the Laue symmetry corresponding to the crystal symmetry class.
Fig. 1.
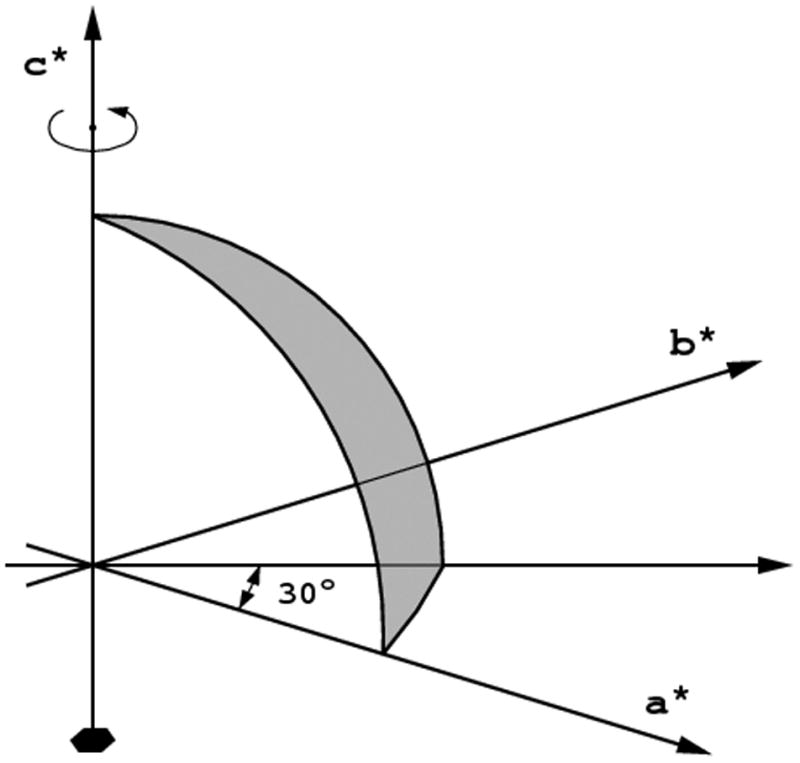
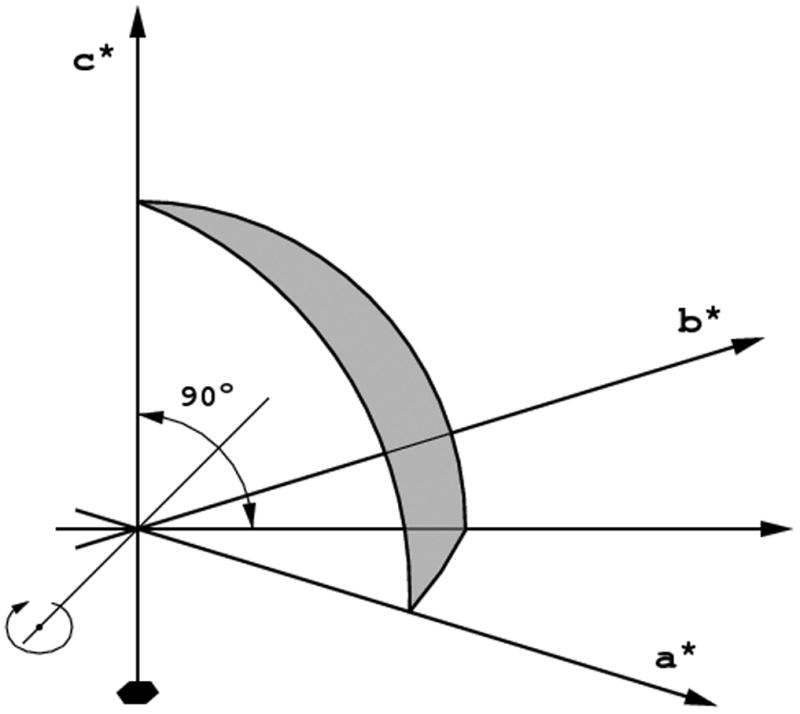
The asymnmetric unit for the point group 622. a) If the crystal is rotated around the six-fold axis, the complete data set may be achieved after 30° of total rotation; b) if the crystal is rotated around the axis lying in the a,b-plane, 90° of rotation is necessary.
Table 1.
Definition of the reciprocal space asymmetric units according to the CCP4 standard.
| Crystal system | Point group | Reflection class | Conditions for indices | ||
|---|---|---|---|---|---|
| Triclinic | 1 | hkl | ± h | ± k | l ≥ 0 |
| hk0 | h ≥ 0 | ± k | l = 0 | ||
| 0k0 | h = 0 | k > 0 | l = 0 | ||
| Monoclinic | 2 | hkl | ± h | k ≥ 0 | l ≥ 0 |
| hk0 | h ≥ 0 | k ≥ 0 | l = 0 | ||
| 0k0 | h = 0 | k > 0 | l = 0 | ||
| Orthorhombic | 222 | hkl | h ≥ 0 | k ≥ 0 | l ≥ 0 |
| Tetragonal | 4 | hkl | h > 0 | k > 0 | l ≥ 0 |
| 0kl | h = 0 | k ≥ 0 | l ≥ 0 | ||
| 422 | hkl | h ≥ 0 | h ≥ k ≥ 0 | l ≥ 0 | |
| Trigonal | 3 | hkl | h ≥ 0 | k > 0 | l ≥ 0 |
| 00l | h = 0 | k = 0 | l > 0 | ||
| 312 | hkl | h ≥ 0 | h ≥ k ≥ 0 | ± l | |
| h0l | h ≥ 0 | k = 0 | l ≥ 0 | ||
| 321 | hkl | h ≥ 0 | h ≥ k ≥ 0 | ± l | |
| hhl | h ≥ 0 | k = h | l ≥ 0 | ||
| Hexagonal | 6 | hkl | h > 0 | k > 0 | l ≥ 0 |
| 0kl | h = 0 | k ≥ 0 | l ≥ 0 | ||
| 622 | hkl | h ≥ 0 | h ≥ k ≥ 0 | l ≥ 0 | |
| Cubic | 23 | hkl | h ≥ 0 | k ≥ h | l ≥ h |
| 0kl | h = 0 | k > h | l ≥ h | ||
| 432 | hkl | h ≥ 0 | k ≥ l | l ≥ h | |
| 0kl | h = 0 | k > l | l ≥ h | ||
The diffraction condition for reflections originating from a crystal exposed to the X-ray beam is formulated by the Bragg's law, λ = 2dsinθ, which is conveniently illustrated by the Ewald construction, Fig. 2. If the crystal is stationary during exposure, only a few reflections are diffracting. More reflections come into diffraction condition if the crystal is rotated. This is the basis of the standard rotation method of diffraction data collection, most popular in macromolecular crystallography.
Fig. 2.
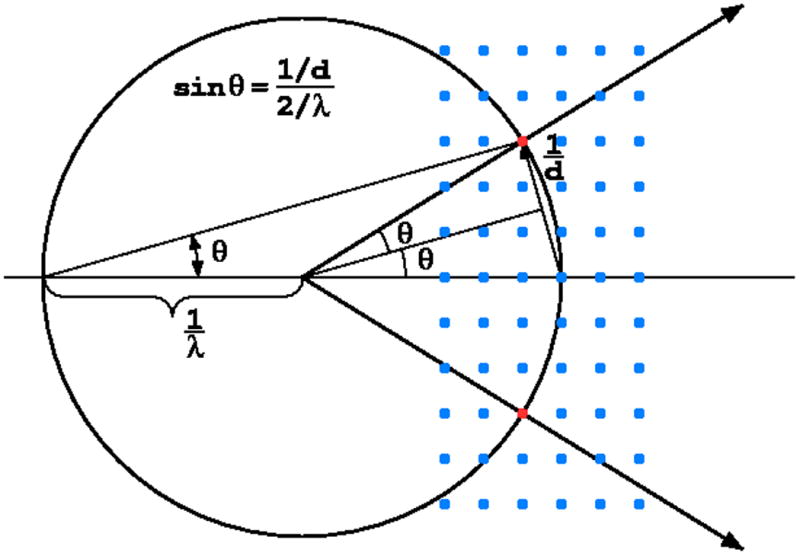
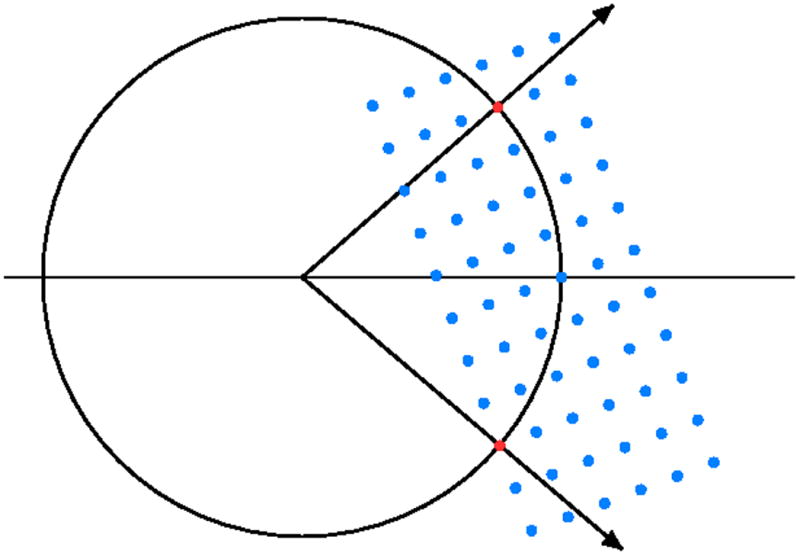
The Ewald construction illustrates the Bragg's law in three dimensions. This figure shows the central section of the Ewald sphere of the radius 1/λ representing the X-radiation and reflections in reciprocal lattice rrepresenting the crystal. a) If the reciprocal lattice point lies at the surface of the Ewald sphere, the trigonometric conditions corresponding to the Bragg's law are fulfilled. b) To bring more reflections to the diffraction condition, the crystal has to be rotated.
Two other approaches are also possible. Data can be acquired from a large number of exposures from many stationary crystals in random orientations, eventually acquiring highly redundant and complete set of data. This approach requires special methods for estimation of reflection intensities, since the reciprocal lattice points do not cross the surface of the Ewald sphere and the individual estimations are lower that the full reflection intensities. This method of data collection is by necessity used at the X-ray laser facilities (XFELs).
Another, Laue approach involves again a stationary crystal, but irradiated with the white, non-monochromatized X-ray radiation. In this case instead of moving the crystal and reflections to diffracting position, the particular X-ray wavelength (i.e. appropriate size of the Ewald sphere) from the continuous spectrum is adjusted to each reflection (Fig. 3). This method can be used to trace certain short-lived reaction states during chemical processes taking place in the crystal, although it has certain theoretical and practical limitations, especially influencing the completeness of low resolution reflections [6]. The Laue approach may be therefore useful for only certain special applications and will not be further addressed in this text.
Fig. 3.
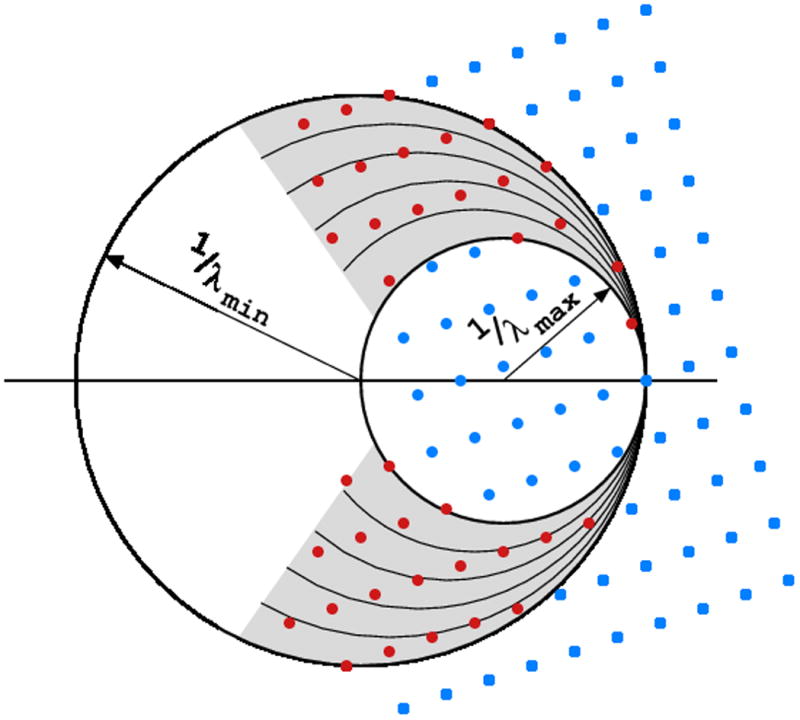
If the X-rays are polychromatic (“white”, not monochromatized), the multitude of different wavelengths invokes diffraction of many reflections, even if the crystal is stationary.
2.2 Total rotation range
To achieve full data completeness, all reflections within the asymmetric unit, or their symmetry equivalents, have to be measured at least once. The minimal amount of crystal rotation necessary to fully cover the asymmetric unit depends on the crystal symmetry class (Fig. 4). Table 2 summarizes these values for all macromolecular point groups, for crystals oriented symmetrically with respect to the goniostat spindle axis. In the arbitrary crystal orientation, it is hard to estimate the necessary rotation range, and it is then better to rely on the advice of strategy programs, such as BEST [4], run on the basis of the initial test diffraction image(s).
Fig. 4.
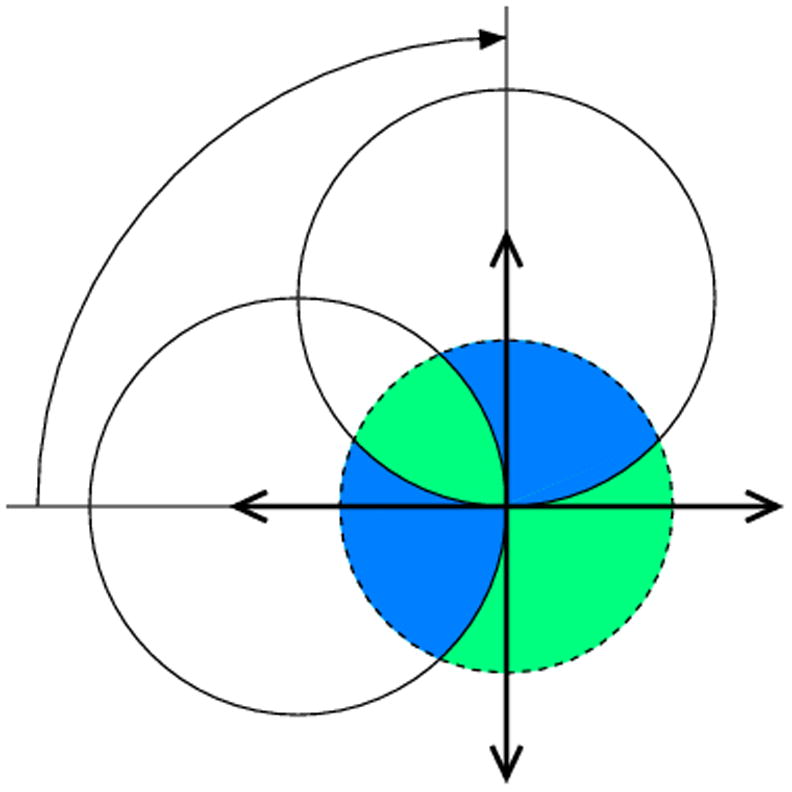
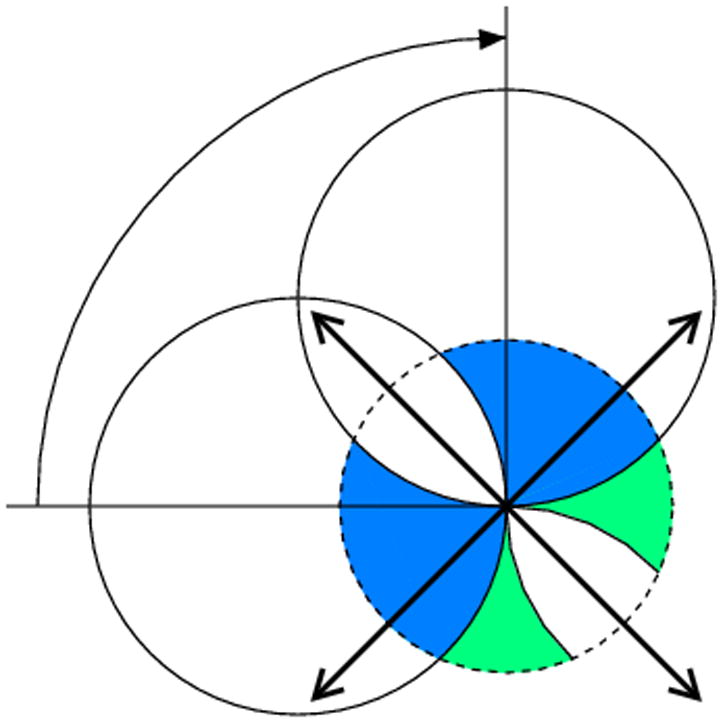
If the orthorhombic crystal is rotated around one of its two-fold axes, 90° of total rotation leads to the complete data set only if (a) it starts at the parallel orientation of its other axes with respect to the beam direction or detector plane, but in the diagonal orientation (b) the data will not be complete, since the region marked in white will not be covered.
Table 2.
Minimal amount of crystal rotation (°) necessary to obtain complete data depending on the crystal symmetry class and its orientation with respect to the spindle axis; (ab) means any direction in the ab-plane.
| Crystal class | Native data | Anomalous data |
|---|---|---|
| 1 | 180 (any) | 180+2θmax (any) |
| 2 | 180 (b), 90 (ac) | 180 (b), 180+2θmax (ac) |
| 222 | 90 (ab, ac, bc) | 90 (ab, ac, bc) |
| 4 | 90 (c, ab) | 90 (c), 90+θmax (ab) |
| 422 | 45 (c), 90 (ab) | 45 (c), 90 (ab) |
| 3 | 60 (c), 90 (ab) | 60+2θmax (c), 90+θmax (ab) |
| 32 | 30 (c), 90 (ab) | 60+2θmax (c), 90 (ab) |
| 6 | 60 (c), 90 (ab) | 60 (c), 90+2θmax (ab) |
| 622 | 30 (c), 90 (ab) | 30 (c), 90 (ab) |
| 23 | ∼60 | ∼70 |
| 432 | ∼35 | ∼45 |
Of course, 360° of total crystal rotation will always provide the maximum coverage possible to obtain in a single rotation pass of the crystal. That, however, does not guarantee full completeness of data, and the effect of the “blind region” will be addressed in the following section. However, 360° of crystal rotation is not necessary in most cases that include crystals with symmetry higher than P1.
Here one of the compromises is evident. More crystal rotation delivers more multiple measurements of the symmetry-equivalent reflections, theoretically resulting in more accurate estimation of the average intensities but, simultaneously, longer exposures lead to more radiation damage, which may spoil these benefits. The compromise depends on circumstances, such as crystal robustness, beam intensity, and detector properties. For example, if the intrinsic detector background is negligible (as is case of the photon counting pixel detectors), it may be advisable to use wider total rotation ranges with somewhat attenuated X-ray beam intensity.
2.2 Rotation range per a single exposure, mosaicity, wide and fine slicing
In the rotation method of diffraction data collection, reflection intensities are recorded on a series on consecutive images recorded when a crystal is exposed to X-rays during small rotation around the goniostat spindle axis. The number of reflections recorded on each image depends on several factors. The density of reflections in the reciprocal space is constant and is related to the crystal unit cell volume. One degree rotation of a virus crystal may produce the image with thousands of reflections. On the other hand, a crystal of a small molecule may lead to only very few visible reflection spots, and this is the useful practical check whether the crystallized material is a macromolecule, or a serendipitously precipitated salt from the solution buffer.
In contrast to the precession method, in the screenless rotation method the geometry of reciprocal space is distorted on diffraction images. The straight lines of reflections in the reciprocal space are represented as hyperbolas and reflections in the individual planes in the reciprocal space are grouped on diffraction images in lunes limited by elliptical boundaries. The successive lunes become wider (in the direction perpendicular to the spindle axis) when the amount of rotation per image, Δφ, increases. This results from the cross-section of the cone diffracting rays by the plane of reflections projected on the flat plane of a detector, as illustrated in Fig. 5. The density of reflection profiles in each lune depends on the crystal cell dimensions in directions parallel to the plane, whereas the gap between the successive lunes depends on the distance between two consecutive reciprocal lattice planes and, therefore, the cell dimension in the direction perpendicular to the planes or, in other words, parallel to the X-ray beam. To avoid the possibility of excessive overlap of reflection profiles, it is therefore advisable to orient the crystal at the goniostat with the longest cell dimension more or less parallel to the spindle axis, so that it never becomes parallel to the X-ray beam.
Fig. 5.
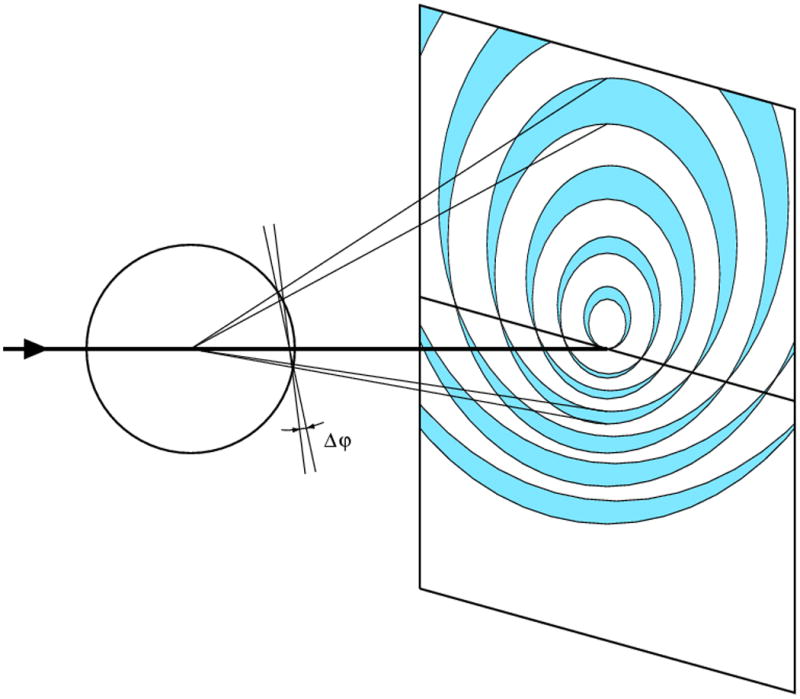
Reflections in each plane of the reciprocal space will give rise to one “lune” at the detector. The width of each lune depends on the amount of crystal rotation during the exposure. Too wide rotations cause the lunes to overlap at the high diffraction angles, which may also lead to overlap of individual reflection profiles.
The kinematic theory of diffraction assumes that crystals are built from small mosaic blocks, slightly misoriented from each other by a small angle η. As a consequence, diffraction of each reflection from mosaic crystals is not instantaneous, but occurs during a small angular range of crystal rotation. This can be represented by the reciprocal lattice reflections having certain finite size, not being the infinitesimally small mathematical points. As a practical consequence, some reflections start diffracting on one image, but continue diffracting on the next image, while the corresponding reciprocal lattice points cross the surface of the Ewald sphere. The intensity of such partially recorded reflections (partials) are spread over spots on multiple images, in contrast to reflections fully recorded on one image. The time and angular interval spent by each reflection in crossing the Ewald sphere, and the total diffraction rocking curve, depends also on the beam divergence δ and its bandpass Δλ/λ. Although synchrotron radiation is usually highly collimated, beam divergence is not negligible and may differ in the horizontal and vertical directions, depending on the properties of the source, monochromator, and focusing mirrors of a particular beam line. These effects are illustrated in the direct and reciprocal space in Figs. 6a,b.
Fig. 6.

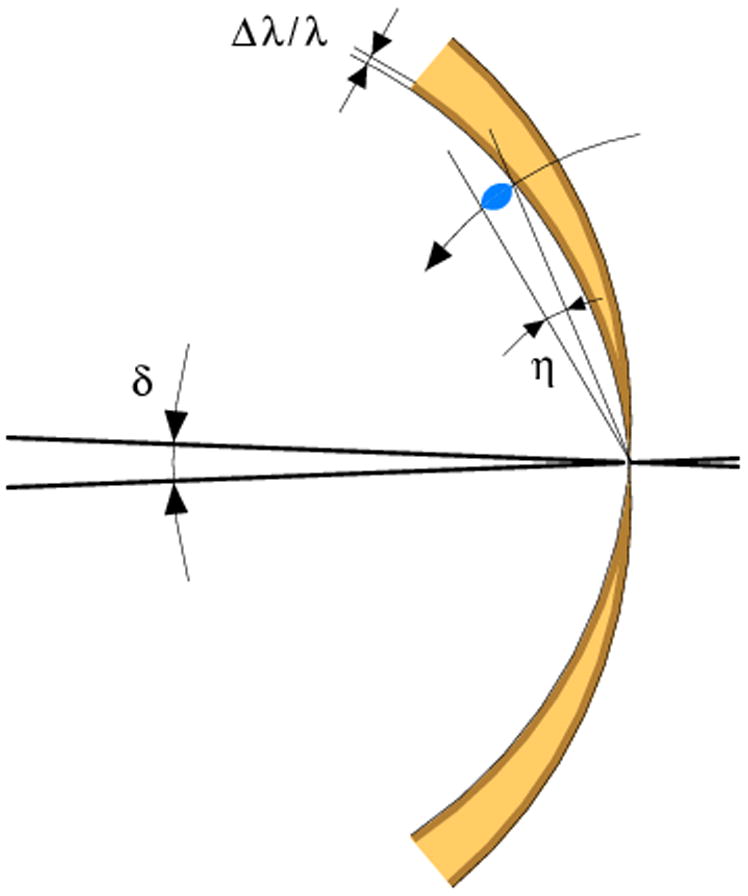
A schematic representation of the beam divergence (δ), crystal mosaicity (η) and beam wavelength bandpass (Δλ/λ) in the direct (a) and reciprocal (b) space.
There are two ways of data collection, the wide slicing and fine slicing approaches, depending on the relation between the rocking width and the crystal rotation interval. In the first case some reflections are fully recorded and some are partially recorded. In the second case all reflections are multiple partials (Fig. 7). In the wide slicing approach, reflection profiles can be built from detector pixels only in two dimensions of the detector window. In the fine slicing approach the profiles can be constructed in three dimensions in the so-called shoe-boxes, with the third direction being orthogonal to the detector plane, which may lead to more accurate estimation of the total reflection intensities. In addition, since the image width Δφ is larger than the width of the rocking curve, the background accumulates during the whole exposure. Consequently, the signal-to-noise ratio in wide slicing mode is worse than in the fine slicing approach.
Fig. 7.
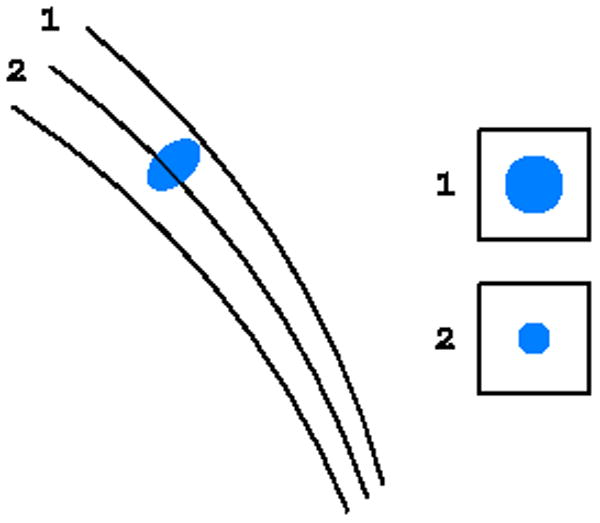
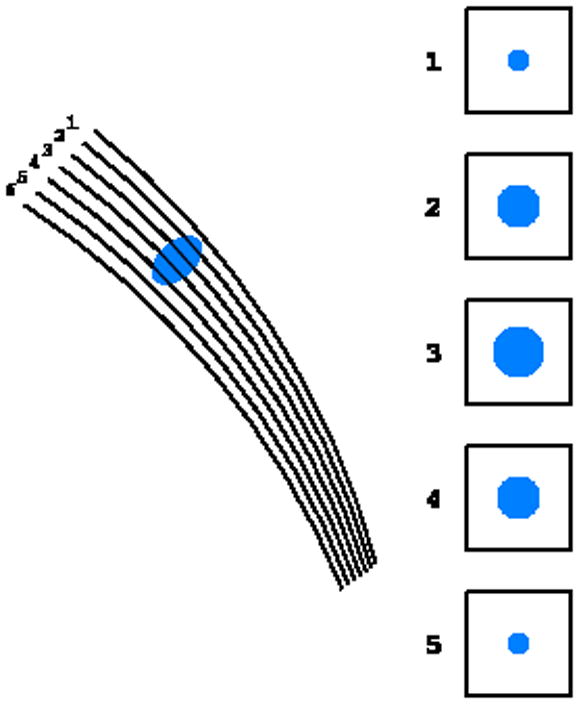
The principle of the (a) wide slicing, when each reflection is either fully recorded on one image or split among two images, and (b) fine slicing, when each reflection is partially recoded on several consecutive images.
2.3 Blind region
Even if the crystal is rotated by 360°, those reciprocal lattice points that lie close to the rotation axis will never cross the surface of Ewald sphere (Fig. 8). Reflections in this “blind region” or “cusp” cannot be recorded in a single rotation pass of data collection with one orientation of the crystal. The blind region width depends on the curvature of the Ewald sphere and therefore on the X-ray wavelength. The short wavelength (and large Ewald sphere radius) minimizes the width of the blind region. The data resolution is always limited to 2/λ, since according to the Bragg's equation sinθ = λ/2d ≤ 1.0. Aiming at atomic resolution data, one has to use very short X-ray wavelength.
Fig. 8.
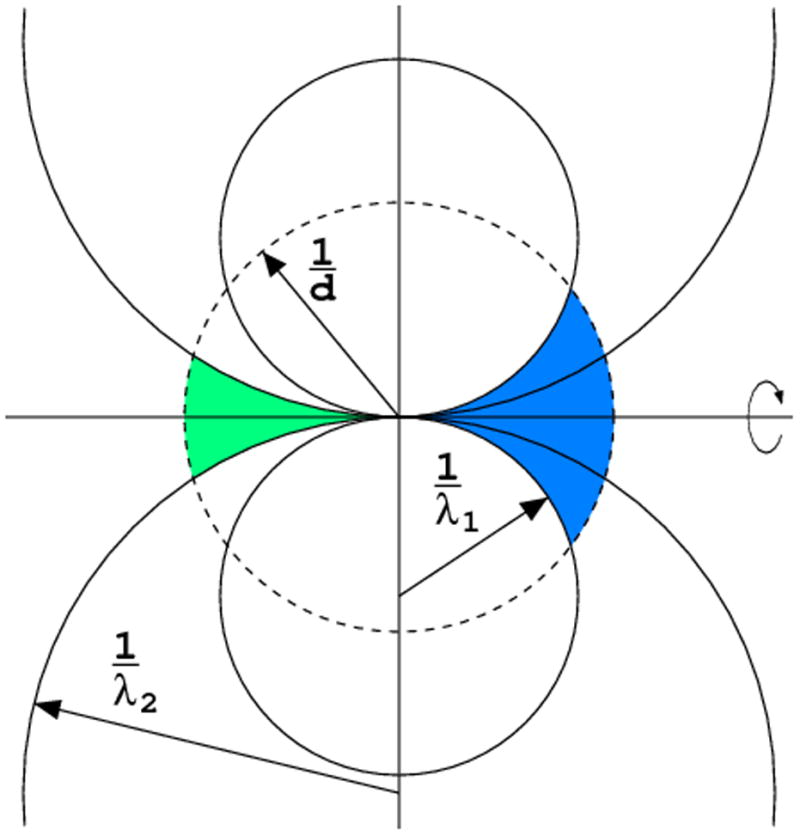
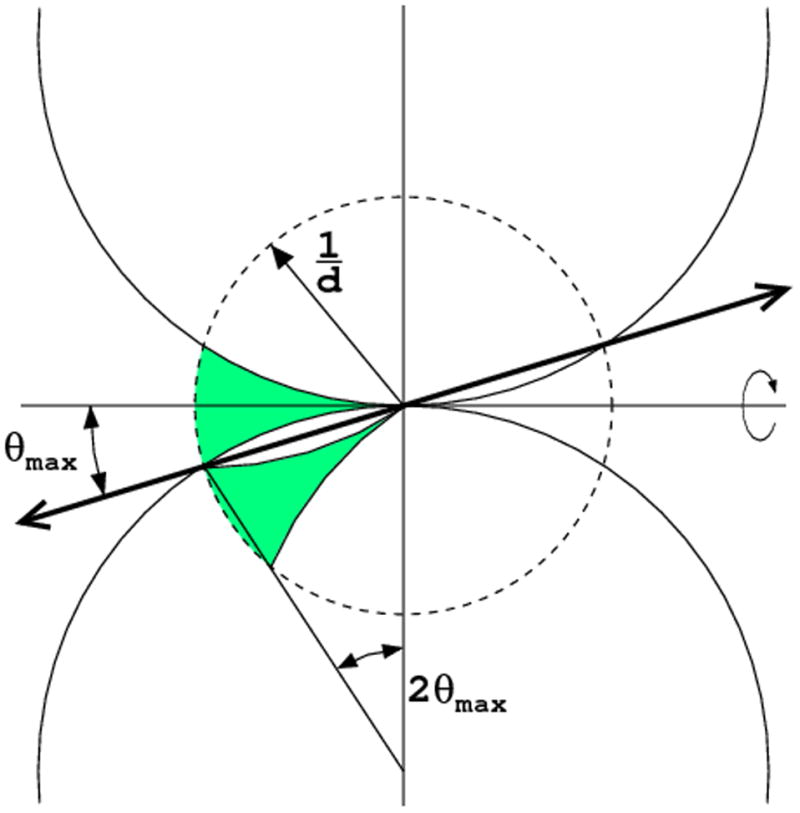
Even after 360° rotation some reflections, in the blind region, close to the rotation axis, will never cross the Ewald sphere. (a) The blind region is wider for long wavelength than for the short wavelength, when the curvature of the Ewald sphere is lower. (b) If the unique symmetry axis of the crystal is misset from the spindle axis direction by more than θmax, all reflections in the blind region have their symmetry equivalents measurable in other parts of reciprocal space.
Fortunately, if the crystal has a symmetry axis and it is misset from the direction of the spindle axis by the angle corresponding to the highest data resolution θmax, all reflections within the blind region have their symmetry mates in other regions of reciprocal space and full data completeness can be achieved (Fig. 8b). However, the blind region negatively affects the data completeness only if the crystal has P1 symmetry or it is rotated around its unique symmetry axis. The latter situation occurs in one of the approaches to collection of anomalous data, aimed at recording Bijvoet-related reflections on the same image.
2.4 Saturated detector pixels
Two-dimensional detectors have certain limit of intensity that can be stored in each pixel. If the electronics of the detector stores numbers as 16-bit integers, the maximum pixel values are 216-1=65535, and all higher intensities are truncated, which leads to some reflections being “overloaded” (Fig. 9). Some detectors, such as PILATUS, work with 20-bit arithmetic and have therefore a much higher dynamic range.
Fig. 9.
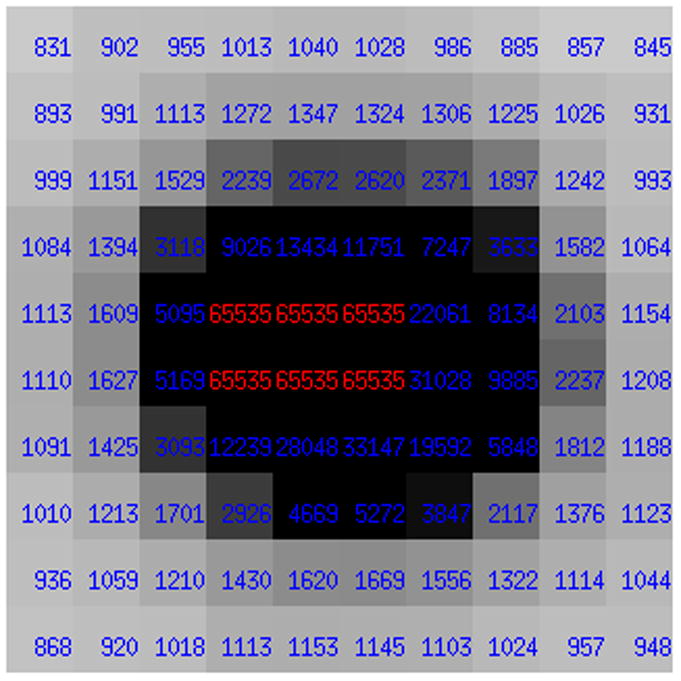
Very strong reflections may have some pixels in their profiles at the detector overloaded, when very high intensity becomes truncated at a level of, for example, 216-1=65535.
As a result of this limitation, it is not possible to adequately record the most intense, low resolution reflections and the very weak, high resolution reflections simultaneously, on the same rotation pass with the same exposures. The strongest reflections are most important for any phasing methods and most strongly modulate all kinds of electron density maps. Missing them will negatively influence all subsequent steps of the crystal structure analysis.
A practical solution to avoid overloads is to collect data in multiple passes with different effective exposures. The “low resolution” pass should be performed first, when the crystal is not significantly radiation damaged, aiming at resolution extending only to the limit where overloads will occur in the high exposure pass. The exposure times and X-ray beam attenuation should be adjusted to avoid any overloaded pixels in the reflection profiles and the rotation amount per image may be relatively large. In the next, “high-resolution” pass, effective exposures may be increased up to ten times and the other parameters should be appropriately adjusted. All intensities from all passes are then scaled and merged together. The problem of overloads is less severe with the fine slicing mode of data collection, when intensities of strong reflections are spread over multiple images.
2.5 Beam size
If the crystal is of high quality, it is always beneficial to expose its total volume, making use of its full diffraction potential. The beam size should preferably be adjusted to the crystal size, to avoid unnecessary excessive background on the recorded diffraction images. This is not always achievable if the crystals are shaped as plates or needles. There are, however, instances when it is advisable to use beam with a cross-section much smaller than the crystal size.
Sometimes large crystals are highly non-uniform throughout their volume, with diffraction properties (mosaicity, resolution) varying in different parts of the whole specimen. It is obviously more productive to collect data from the well-behaving part of such a crystal than from the whole sample. For long, needle-like crystals it is possible to collect data with small beam size from several parts, moving it along the spindle axis after several images (Fig. 10a). Many synchrotron facilities allow for the “helical” approach, in which a crystal is moved successively while it rotates (Fig. 10b). The small beam size (and a high level of collimation) may also be beneficial if the crystal cell dimensions are very large, in order to diminish the overlap of reflection profiles at the detector window.
Fig. 10.
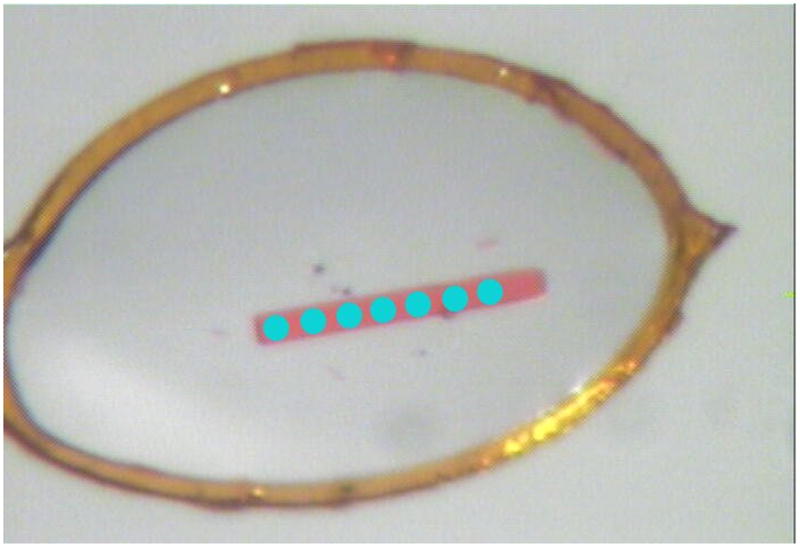
Using X-ray beam collimated to small size, it is possible to collect data from several places along the long crystal (a), or move such a crystal, while it rotates in the so-called helical data collection protocol (b).
2.6 Radiation damage
Radiation damage, incurred in macromolecular crystals during exposure to X-rays, has been a curse of protein crystallography from its early days. Currently, with the routine use of very intense X-ray synchrotron beam sources, radiation damage is still a very important issue, which has to be taken into account in the practice of macromolecular crystallography [7]. Even if crystals are cooled to temperatures of about 100 K, their total diffraction intensity diminishes by a factor of two after absorbing X-ray doses of 20-40 MGy. More importantly, some specific damage, in the form of decarboxylation of acidic residues, breakage of disulfide bonds, various conformational changes of amino acid side chains etc., occurs at much smaller doses, and that may lead to potential misinterpretation of various structural features and biologically important functional results.
Cryo-cooling diminishes the secondary damage effects resulting from diffusion of certain active radicals throughout the crystal. However, the primary radiation damage following absorption of X-ray quanta is inevitable. The radiation damage can only be mitigated by reduction of exposure time or attenuation of the X-ray beam intensity. A certain degree of damage may be allowed if data are to be used for final model refinement, but for anomalous phasing applications any damage must be avoided.
If the data are to be used for final structure refinement, the total dose should not exceed the so-called Garman limit of 20 MGy [8]. For data used for anomalous phasing this limit should be much lower. It is advisable to evaluate radiation damage at the early stages of data collection. Some strategy programs, e.g. BEST or RADDOSE can be used to estimate the appropriate exposures that permit to collect the complete data within the selected total absorbed dose.
The useful criteria of radiation damage are the scaling B factors and Rmerge values. As a rule of thumb, the absorption of 1 MGy results in the increase of the scaling B-factor by about 1 A2. Often degradation of the reflection profiles and loss of high resolution intensities can be judged by visual inspection of diffraction images. The Rmerge and χ2 values as a function of the image number may show characteristic “smiley” behavior, with highest values at the beginning and end of the range and lowest values in the middle (Fig. 11), since the average merged intensities are closest to those recorded in the middle of the set and most different from those measured at the start and end of the session.
Fig. 11.
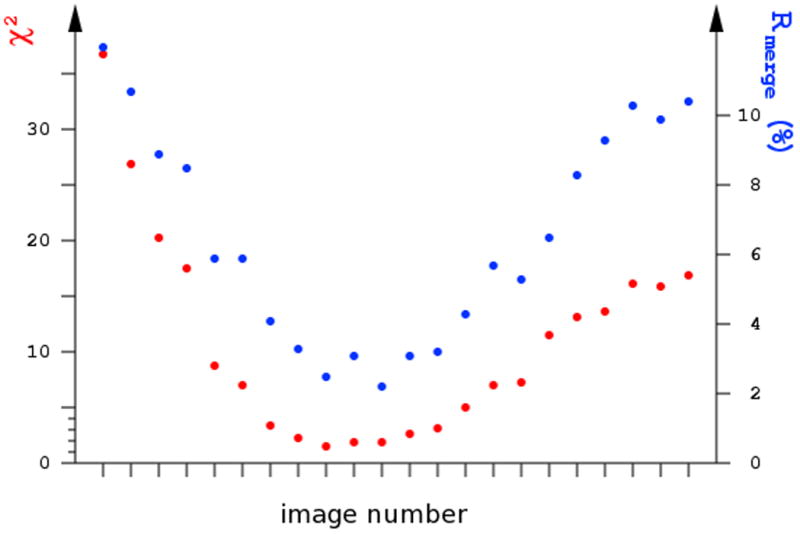
Radiation damage can be visualized if the dependence Rmerge or χ2 values for individual images form a “smiley” curve, where the intensities differ mostly form their average at the beginning and the end of the series of images.
2.7 Alternative indexing and merohedral twinning
If the crystal point group symmetry is lower than the symmetry of the crystal lattice, reflections can be indexed in more than one way. Such cases occur when the crystal has a polar axis, when its two directions are not equivalent (Fig. 12). This affects the following crystal classes: 4, 3, 32, 6 and 23, and all space groups with various screw axes within these classes. The problem of multiple ways of indexing may also occur if certain unit cell parameters lead to lattices having by chance higher metric symmetry than the true symmetry of the crystal structure. For example, a monoclinic crystal with a=c will “pretend” to be orthorhombic C-centered.
Fig. 12.
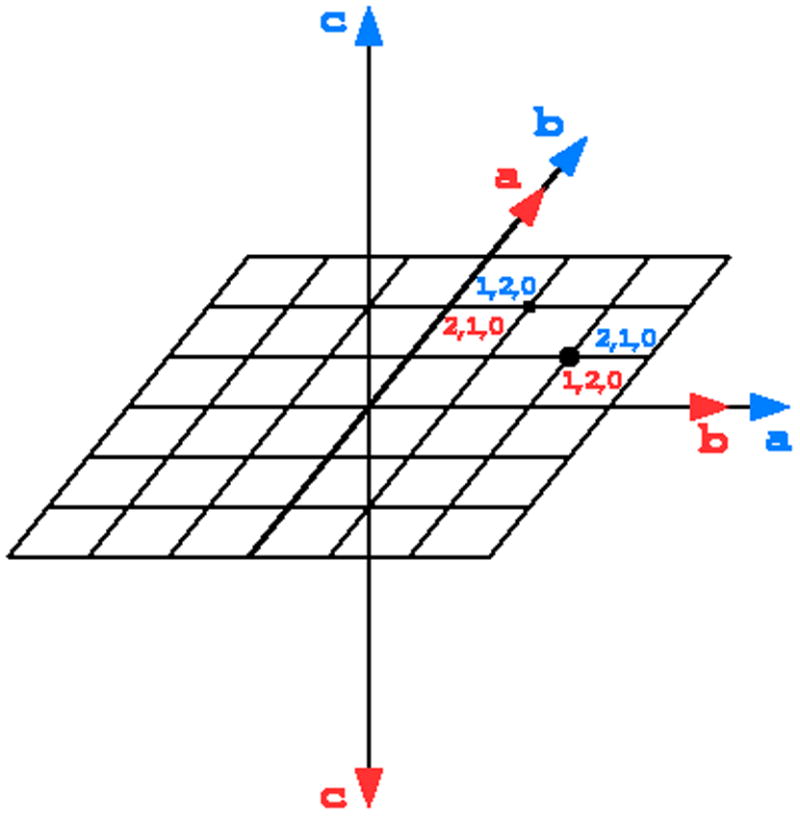
In space groups possessing polar rotation axes, it is possible to index reflections in two (or more), non-equivalent ways. Both ways are correct, but if data are measured from more than one crystal, the indexing scheme has to be the same for all contributing parts.
The same crystal classes are also vulnerable to merohedral twinning when small, individual domains within a single crystalline specimen are mutually related by the symmetry operation belonging to the symmetry of the lattice, but not existing in the set of symmetry operations of the true point group of the crystal structure. Reflection intensities measured from perfectly merohedrally twinned crystal can be successfully merged in a higher than actual crystal symmetry. The presence of twinning can only be identified from various tests based on the statistics of reflection intensities (see [9] and the chapter by Thompson in this volume).
If the crystal symmetry is not known, it is advisable to assume than it is lower than the full symmetry of the lattice, for example 4 instead of 422 etc., and to adjust the strategy appropriately. For example, for a tetragonal crystal rotated around its fourfold axis, it is safer to collect the total of 90° of data with half exposure, than the minimum 45° required for the complete set in 422 symmetry, in case that the crystal will turn out to be twinned. The data can be tested for twinning early, before achieving full completeness. Such programs as xtriage [10] or POINTLESS [11] can be run even with a partial data set, when the crystal still resides at the goniostat, so that the strategy can be modified appropriately.
3 Practical protocols
There is an unfortunate tendency to measure diffraction data blindly, by collecting 180° of total data with 0.1° wide images with full beam intensity and starting from an arbitrary crystal orientation. However, data acquisition is in fact a complicated scientific procedure, and such a simplistic treatment of data collection as a mere technicality may often lead to less than optimal results. It is much better to start by performing some initial tests and on this basis selecting most appropriate protocol and parameters for subsequent process of data collection. At the contemporary synchrotron facilities the initial testing may take more time than the measurement of the whole data set but, nevertheless, it is always beneficial to proceed according to optimized protocols rather than to rely on some default parameters that may turn out to be inappropriate.
Of course, at the beginning of any diffraction experiment it is necessary to place the crystal in the X-ray beam. One can assume that the beamline setup is perfect, but it may be advisable to check if the beam and the goniostat are properly aligned. This can be done first by centering a small object (a sharp needle, a small crystal, or an empty loop), so that it rotates around its own center while the spindle axis revolves and marking this place within the camera window. Next, a fluorescent object (a blob of fluorescent salt or a thin YAG plate) can be put at the goniostat to check if the beam is centered exactly at the rotation axis of the spindle. When the crystal is mounted for an experiment, it is important that it should rotate around its own center, to ensure the uniformity of intensities during scaling and merging procedure. If it is intended to expose a small part of a large crystal with a small beam, the crystal position must be adjusted accordingly, with the selected crystal fragment located exactly at the spindle axis. This is not always coincident with the cross-hair of the viewing camera.
3.1 Test exposures
It is good to start the data collection session by exposing a couple of test exposures at two orthogonal orientations, such as 0° and 90°, since sometimes one of the test images may look acceptable, but the orthogonal one may disclose unacceptable characteristics. Many features can be immediately judged by eye, if the crystal is single or split, if the reflection profiles are highly diffused or overlapping, etc. One of the exposures can be recorded with relatively intense beam in order to estimate the resolution limit of diffraction. A test image should be indexed (or even integrated) and the apparent crystal symmetry established. This allows one to select the optimal data collection parameters, such as the total and per image rotation ranges, spindle axis start position, crystal-to-detector distance, X-ray beam attenuation, and exposure time. Preferably, this may be done with the use of one of the strategy programs.
3.2 Selection of wavelength
For collecting data from native crystals it is not necessary to select any particular X-ray wavelength. At the home sources there is usually no choice, since most facilities are equipped with copper anodes delivering X-rays of 1.54 Å, or more rarely with molybdenum anodes with 0.71 Å (appropriate for high resolution data) or chromium anodes with 2.29 Å (appropriate for measuring anomalous data from lighter elements, such as S, P, Ca). At synchrotron facilities native data are usually collected with wavelengths close to 1 Å, optimal from the point of view of beam line optics and beam flux. Only aiming at very high resolution it may be necessary to use the short X-ray wavelength and as short as possible crystal-to-detector distance. Sometimes the parallel or angular detector offset from the central position may be used to increase the diffraction angles of highest resolution reflections.
If the aim is to measure anomalous data, the wavelength should be selected appropriately. For MAD work, it is necessary to record the fluorescence spectrum around the absorption edge of the selected anomalous scatterer, which can be then interpreted by the program CHOOCH [12]. One can select to measure data at three wavelengths, the peak, edge and high-energy remote (50-100 eV beyond the edge) values, or only at two wavelengths, the edge and high-energy remote, omitting the fluorescence peak value, where the absorption is the highest, especially with anomalous scatterers such as lanthanides or tantalum. For MAD data one should use modest effective exposures, to avoid incurrence of radiation damage.
For SAD work, the wavelength can be selected either at the peak value, or at the high-energy remote. The latter does not require recording the fluorescence spectra. Similarly, aiming at recording the anomalous signal from relatively light elements, such as sulfur, phosphorus or calcium that have no absorption edges in the accessible range of wavelengths on most of synchrotron beam lines, the wavelength should be set to longer values, in the vicinity of 2 Å [13].
3.3 Choice of symmetry
Unless the crystal symmetry is known in advance, it has to be established during data collection and reflection merging. The particular space group is not important at this stage, only the point group is relevant for data collection strategy. Initial indexing may suggest the Bravais lattice of highest symmetry, but the metric of the lattice may have higher symmetry than the true symmetry of the structure. The obvious cases are the hemihedral crystal classes, such as 4 in the 422 (in fact 4/mmm) lattice, 3, 32, 6 in the 622 (6/mmm) lattice or 23 in 432 (m3m) lattice, but serendipitous agreement of the unit cell parameters with higher symmetry crystal systems sometimes may occur. The true point group may be only established at the stage of data merging, and even then perfect (pseudo)merohedral twinning may not be easily identified.
It is therefore advisable to adopt a strategy appropriate for the lower potential crystal symmetries. The integrated data can be merged even before a complete set is achieved or such partial data sets may be submitted to POINTLESS [11], to select the true symmetry operations of the crystal point group. The strategy can be then modified, for example by covering the extended total crystal rotation range.
The photon counting pixel detectors, characterized by very low intrinsic noise, offer a version of the data collection strategy where data are collected over a wide total rotation range with diminished beam intensity. Because of low noise, data quality does not suffer, but higher data multiplicity and assurance that data are complete even if the crystal symmetry is lower than apparent from the initial indexing are beneficial.
However, it is always advisable to start data collection at the optimally selected crystal orientation (spindle axis position), which ensures the earliest achievement of high completeness, even if the crystal dies because of radiation damage during the process.
3.4 Data quality
Several criteria can be used to judge the data quality. Some are more popular than others and various criteria have different statistical validity. Some factors are global, other relate to narrow resolution bins. The traditional criteria are the data resolution limit and the Rmerge value, calculated as Rmerge = (Σhkl Σi |Ii - <I>|) / (Σhkl Σi Ii). In addition, in the presentation of refined structures required are the data completeness, average multiplicity of measurements of equivalent reflections, and the average ratio of intensities to their uncertainties, I/σ(I). These values are given for all data and for the highest resolution bin.
However, none of these criteria is fully objective and statistically perfect. The Rmerge value increases (becomes worse) with increased multiplicity, while the data quality certainly improves. It is therefore better to use more statistically valid versions, Rmeas = (Σhkl [n/(n-1)]Σi |Ii - <I>|) / (Σhkl Σi Ii) [14] or Rpim = (Σhkl [1/(n-1)]Σi |Ii - <I>|) / (Σhkl Σi Ii) [15]. The average signal-to-noise ratio I/σ (I) is a good indicator, under the condition that the uncertainties σ(I) are estimated correctly. This is not always easy, since their evaluation depends on proper detector calibration, reflection profile and background estimation and other factors, and the proper counting statistics or the recorded X-ray quanta may not apply directly. There are ways to check and correct the level of uncertainties by comparing them with the expected statistics using, for example, the normal probability plots. It is worth paying attention to this issue since the correct estimation of uncertainties is important for all phasing and refinement methods based on statistical maximum likelihood principles. Usually required in all presentations are the overall and highest resolution data completeness, which should be high, preferably above 95% and 75%, respectively. However, highly informative is also completeness of data in the lowest resolution shell, where it may be affected by the overloaded reflections. As mentioned earlier, these strongest reflections are very important and missing them not only negatively affects the process of structure solution and refinement, but also biases the other statistical indicators such as Rmerge or I/σ(I).
Traditionally, the accepted data resolution limit used to be point where the I/σ (I) ratio drops below 2.0. However, detailed statistical analysis of the relationship between the accuracy and R factors of measured data (Rmeas) and those of refined structural models (R and Rfree) [16] shows that even weaker reflections contain useful information. It has been suggested that the most informative and statistically sound criterion to objectively judge the resolution limit of diffraction data is CC1/2, the correlation coefficient between two, randomly split and merged groups of reflections [16]. Data resolution may be extended to a limit where CC1/2 is still about 0.3-0.5. The I/σ (I) ratio may then drop to values even lower than 0.5 and Rmeas may rise above 1.0. Several practical tests confirmed that the presence of very weak reflections does not harm the quality of the refined structural models, but it is not clear if their inclusion is highly [17] or marginally [18,19] beneficial. In fact, selection of the data resolution limit remains a rather subjective and not highly objective decision.
Anomalous signal in the data can be judged by the average Bijvet ratio ΔFanom/F (as a function of resolution) and by the CCanom, the correlation coefficient between signed anomalous differences in two randomly split halves of the data. Useful for phasing anomalous signal exists in resolution ranges where CCanom is higher than 0.3 [20].
Diffraction data collection at contemporary synchrotron beam lines is highly automated due to the presence of very sophisticated but user-friendly control systems of hardware and software. However, it is still a scientific process, not a mere technicality. To ensure the optimal quality of data several important decisions have to be made, satisfying several, often contradictory requirements. It is beneficial, if the experimenter is aware of all the involved issues and is able to make decisions that lead to as good data quality as his crystals can deliver.
References
- 1.Arndt UW, Wonacott AJ. The rotation method in crystallography. North Holland, Amsterdam: 1977. [Google Scholar]
- 2.Dauter Z. Data collection strategies. Acta Crystallogr. 1999;D55:1703–1717. doi: 10.1107/s0907444999008367. [DOI] [PubMed] [Google Scholar]
- 3.Dauter Z, Wilson KS. Principles of monochromatic data collection. In: Rossmann MG, Arnold E, editors. International tables for crystallography. F. 2001. pp. 177–195. [Google Scholar]
- 4.Popov AN, Bourenkov GP. Choice of data-collection parameters based on statistic modelling. Acta Crystallogr. 2003;D59:1145–1153. doi: 10.1107/s0907444903008163. [DOI] [PubMed] [Google Scholar]
- 5.Hahn T, editor. International Tables for Crystallography. A. Springer; Dordrecht: 2005. [Google Scholar]
- 6.Cruickshank DWJ, Helliwell JR, Moffat K. Multiplicity distribution of reflections in Laue diffraction. Acta Crystallogr. 1987;A43:656–674. [Google Scholar]
- 7.Garman EF. Radiation damage in macromolecular crystallography: what is it and why should we care? Acta Crystallogr. 2010;D66:339–351. doi: 10.1107/S0907444910008656. [DOI] [PMC free article] [PubMed] [Google Scholar]
- 8.Owen RL, Rudiño-Pinera R, Garman EF. Experimental determination of the radiation dose limit for cryocooled protein crystals. Proc Natl Acad Sci USA. 2006;103:4912–4917. doi: 10.1073/pnas.0600973103. [DOI] [PMC free article] [PubMed] [Google Scholar]
- 9.Yeates TO. Detecting and overcoming crystal twinning. Methods Enzymol. 1997;276:344–358. [PubMed] [Google Scholar]
- 10.Zwart PH, Grosse-Kunstleve RW, Adams PD. Xtriage and Fest: automatic assessment of data quality and substructure structure factor estimation. CCP4 Newsletter. 2005:43. [Google Scholar]
- 11.Evans PR. Scaling and assessment of data quality. Acta Crystallogr. 2006;D62:72–82. doi: 10.1107/S0907444905036693. [DOI] [PubMed] [Google Scholar]
- 12.Evans G, Pettifer R. CHOOCH: a program for deriving anomalous-scattering factors from X-ray fluorescence spectra. J Appl Crystallogr. 2001;34:82–86. [Google Scholar]
- 13.Mueller_Dieckmann C, Panjikar S, Tucker PA, Weiss MS. On the routine use of soft X-rays in macromolecular crystallography. Part III. The optimal data collection wavelength. Acta Crystallogr. 2005;D61:1263–1272. doi: 10.1107/S0907444905021475. [DOI] [PubMed] [Google Scholar]
- 14.Diederichs K, Karplus PA. Improved R-factor for diffraction data analysis in macromolecular crystallography. Nat Struct Biol. 1997;4:269–275. doi: 10.1038/nsb0497-269. [DOI] [PubMed] [Google Scholar]
- 15.Weiss MS, Hilgenfeld R. On the use of merging R factor as a quality indicator for X-ray data. J Appl Crystallogr. 1997;30:203–205. [Google Scholar]
- 16.Karplus PA, Diederichs K. Linking crystallographic model and data quality. Science. 2012;336:1030–1033. doi: 10.1126/science.1218231. [DOI] [PMC free article] [PubMed] [Google Scholar]
- 17.Wang J. Estimation of the quality of refined protein crystal structures. Prot Sci. 2015;24:661–669. doi: 10.1002/pro.2639. [DOI] [PMC free article] [PubMed] [Google Scholar]
- 18.Evans PR, Murshudov GN. How good are my data and what is the resolution? Acta Crystallogr. 2013;D69:1204–1214. doi: 10.1107/S0907444913000061. [DOI] [PMC free article] [PubMed] [Google Scholar]
- 19.Luo Z, Rajashankar K, Dauter Z. Weak data do not make a free lunch, only a cheap meal. Acta Crystallogr. 2014;D70:253–260. doi: 10.1107/S1399004713026680. [DOI] [PMC free article] [PubMed] [Google Scholar]
- 20.Schneider TR, Sheldrick GM. Substructure solution with SHELXD. Acta Crystallogr. 2002;D58:1772–1779. doi: 10.1107/s0907444902011678. [DOI] [PubMed] [Google Scholar]


