

Abstract
Background
Individuals with opioid use disorders have high rates of mortality relative to the general population. The relationship between treatment process and mortality is unknown.
Aim
To examine the association between 7 process measures and 12- and 24-month mortality.
Methods
Retrospective cohort study of patients with opioid use disorders who received care from the Veterans Administration between October 2006 and September 2007. Logistic regression models were used to examine the association between 12 and 24-month mortality and 7 patient-level process measures, while risk-adjusting for patient characteristics. Process measures included quarterly physician visits, any opioid use disorder pharmacotherapy, continuous pharmacotherapy, psychosocial treatment, Hepatitis B/C and HIV screening, and no prescriptions for benzodiazepines or opioids. We conducted sensitivity analyses to examine the robustness of our findings to an unobserved confounder.
Results
Among individuals with opioid use disorders, not being prescribed opioids or benzodiazepines, receipt of any psychosocial treatment and quarterly physician visits were significantly associated with lower mortality at both 12 and 24 months, but Hepatitis and HIV screening, and measures related to opioid use disorder pharmacotherapy were not. Sensitivity analyses indicated that the difference in the prevalence of an unobserved confounder would have to be unrealistically large given the observed data, or there would need to be a large effect of the confounder, to render these findings non-significant.
Conclusions And Relevance
This is the first study to show an association between process measures and mortality in patients with opioid use disorders and provides initial evidence for their use as quality measures.
Keywords: Mortality, Opioid use disorders, Process measures, Measure validation, Quality improvement, Quality of care
1. Introduction
Opioid use disorders (OUDs), including both heroin and prescription opioid use disorders, are associated with high rates of mortality both in the United States and worldwide (Degenhardt et al., 2011; Degenhardt et al., 2014a; Gomes et al., 2014; Martins et al., 2015; Rudd et al., 2016b). Mortality risks for individuals with opioid use disorders range from 6-20 times higher than the general population, and opioid-related mortality has increased dramatically during the past two decades, particularly with the increasing misuse of prescription opioids (Centers for Disease Control and Prevention (CDC), 2011; Frenk et al., 2015; Rudd et al., 2016a; Rudd et al., 2016b). Younger individuals are disproportionately affected and bear the greatest burden of premature mortality. In addition to being associated with medical illnesses such as endocarditis and hepatitis, OUDs complicate the treatment of other conditions (e.g., acute and chronic pain, conditions requiring surgical intervention) and are associated with higher costs (Birnbaum et al., 2011; Meyer et al., 2014; Ronan and Herzig, 2016).
Reducing the mortality associated with OUDs is an ongoing public health challenge and an important goal for health care systems. While health care systems have little ability to decrease some causes of premature mortality, such as injuries and homicides, they may influence mortality through the quality of the care they deliver. Health care providers can decrease the mortality risk of patients with OUDs through recognition and treatment of worsening chronic health problems, preventing iatrogenic causes of mortality or through influencing patients' drug use and subsequent risk behaviors by providing effective treatment (Davoli et al., 2007; Gaither et al., 2016a, b; Grossbard et al., 2014).
Understanding the relationship between the quality of care provided and mortality can help health care systems reduce the increased mortality experienced by persons with OUDs. Quality of care is commonly examined using either measures of process, which assess the care provided to the patient, or outcomes, which assess the impact of the care on the patient's health or functioning. While improved patient outcomes are the gold standard for measuring quality, using outcome-based quality measures is challenging. Outcome data can be expensive and difficult to obtain; do not identify which care processes need to be improved; and outcome measures require risk adjustment. In contrast, process-based measures are more easily operationalized from electronic health records and can provide information about where performance is variable and quality improvement efforts should be targeted. Furthermore, administrative-data based process measures can be reported in real-time, allowing health care systems to take timely corrective action.
While the rationale for specific quality measures usually comes from practice guidelines and/or a synthesis of the literature, process measures should have demonstrated reliability and validity before being used as quality measures to improve performance. There are no reliable and valid quality measures for individuals with OUDs, and measures that have been developed and validated for use in substance use disorders more generally have not been specifically tested in opioid dependent populations (Garnick et al., 2002; Garnick et al., 2009; Harris et al., 2010). This is an important limitation, because disease-specific measures, when they draw attention to specific clinical processes, may be more actionable than generic measures for quality improvement efforts. However, unless process measures are associated with clinically meaningful outcomes, using them to monitor and improve performance will not result in the expected improvements.
Given the importance of mortality as a clinical outcome, we examined the association of 7 process-based measures with 12- and 24-month mortality among persons with OUDs. If these measures are associated with lower mortality, it would provide initial evidence that they could be used by health care systems as part of specific strategies to improve the care provided to individuals with OUDs and to decrease mortality. It would also provide initial evidence for the predictive validity of the measures.
2. Methods
2.1 Overview
This study was approved by the Institutional Review Boards of the Central Arkansas Veterans Healthcare Center and the University of Arkansas for Medical Sciences. The boards waived the requirement for informed consent as it was a minimal risk study. Administrative data was obtained from the Veterans Administration (VA) Medical SAS data sets. Mortality through September 30, 2009 was obtained from the VA Vital Status Mini File.
2.2 Study Population
We identified all veterans with OUDs using the International Classification of Diseases (ICD)-9 codes 304.0, 304.7, 305.5 found in the VA Medical SAS datasets, which represent the totality of care provided or paid for by VA in federal fiscal year (FY) 2007. Veterans were included in the study population if within FY2007 their utilization records contained at least one diagnosis code for an OUD, and if they had at least one inpatient episode or two outpatient encounters, one of which was related to OUD, to show active engagement with VA care. Patients were not required to be receiving treatment for their OUD.
2.3 Process Measures
Process measures were derived from a comprehensive literature review as part of a larger study. Discrete treatment recommendations were identified and potential measures were reviewed by a panel of technical experts and iteratively revised until a final set of measures of acceptable face validity and feasibility was produced with all necessary technical specifications (Watkins et al., 2011a; Watkins et al., 2016; Watkins et al., 2011b). The measure related to benzodiazepine and opioid use, and 3-month opioid pharmacotherapy were derived from those previously used to assess the treatment of Massachusetts and Pennsylvania Medicaid enrollees with OUDs (Baxter et al., 2015; Gordon et al., 2015; Stein et al., 2012). Because of the relatively low prevalence of the mortality outcome, we only included the 7 measures that were applicable to a broad set of individuals with OUDs. Receipt of Hepatitis B or C or HIV screening was defined as receiving a blood test for the illness during the observation year; HIV and Hepatitis C screening are recommended by the VA/DoD practice guideline for substance use disorders (U.S. Department of Veterans Affairs, 2016). No opioid and benzodiazepine use, a measure indicating the absence of possible inappropriate prescribing, was defined as not receiving either a prescription for an opioid analgesic or a benzodiazepine during the study period. Any OUD pharmacotherapy was defined as receiving at least one prescription during the study year for an FDA-approved medication for OUD, including long-acting and oral naltrexone, methadone or buprenorphine. We defined 3-month OUD pharmacotherapy as receiving at least 3 months of OUD pharmacotherapy; for both medication measures we required the methadone to be dispensed through an opioid treatment program to exclude use for pain. Given the importance of psychosocial interventions (U.S. Department of Veterans Affairs, 2016), receipt of any psychosocial treatment was defined as receiving at least one diagnosis-related psychosocial treatment visit in the observation year, including individual and group psychotherapy, family interventions, supported employment, skills training and intensive case management, but excluding opioid substitution therapy. The final measure describes an aspect of continuity of care, continuous care over time (Wierdsma et al., 2009), which we defined as receiving at least one physician visit for any diagnosis each quarter over a one-year period. We tested alternative specifications, including restricting the visit to an OUD or SUD diagnosis-related visit. Because the relationships observed were similar, we present data from the least restrictive version of the measure. Measures were assessed during FY 2007.
2.4 Outcome measure
Mortality was obtained from the VA Vital Status Mini File for the period from October 1, 2006 through September 30, 2009. The Mini File contains information from Medicare Vital Status file, the Social Security Administration Death Master file, Patient Treatment File, Veterans Beneficiary Identification Records Locator Subsystem Death File and Fee Basis. Death dates compiled from these combined data sources demonstrated very high sensitivity and exact agreement with dates from the National Death Index (Sohn et al., 2006).
2.5 Covariates
To risk-adjust mortality rates, we used variables available in the administrative data, including age, gender, racial/ethnic background, marital status, rural/urban location (Morrill et al., 1999), and whether the veteran had a service-connected disability for a mental or substance use disorder (SUD). Service-connection status was included because it is associated with illness severity and veterans with a service-connected disability are given priority access to services. Given that patients with multiple comorbidities show increased healthcare utilization but worse outcomes, a comorbidity measure based on the Charlson-Deyo comorbidity index (Deyo et al., 1992; Klabunde et al., 2000) was used to adjust for mortality risk due to physical health conditions. The index was modified by the VA Information Resource Center for use with mixed inpatient and outpatient data (VA Information Resource Center, 2014). We include for descriptive purposes the number and proportion of the population who had a new treatment episode, defined as having at least one substance use or mental health visit after a period of 5 months with no diagnosis-related visits (Harris et al., 2015).
2.6 Statistical Analyses
We examined descriptive statistics for 12- and 24-month mortality outcomes, patient risk-adjustment characteristics, and the measures of treatment process. We restricted analyses to the population of patients who were alive at the end of the observation period for each measure in order to unbiasedly estimate mortality following quality measure-specific landmark times (Dafni, 2011). For our primary analyses examining the overall process-outcomes association for each measure and mortality time point, we fit a logistic regression to model the probability of mortality, including the process measure and patient risk-adjustment characteristics as independent variables. Observations with missing covariate data or mortality information (approximately 4.3% of the population) were omitted from the outcomes analyses. We assessed the strength of association between a measure and mortality by examining the odds ratio of mortality for the measure and its 95% confidence interval (CI). We applied the predictive margins approach to the risk-adjusted logistic regression output to estimate the marginal effect on mortality of receipt of care measured by the process measure, holding constant the risk-adjustment patient characteristics (Graubard and Korn, 1999), and computed the marginal percent reduction in mortality associated with receiving a process measure. We also report the avoidable excess mortality number, which refers to the number of deaths that potentially could have been averted had the patient received the process of care specified by the measure. For a specific measure, the avoidable mortality number was calculated as the product of the difference in mortality rates between those who met and did not meet the measure, and the size of the population of patients who did not receive measured care. Standard errors of model coefficients were adjusted for the clustering of observations within one of 139 service areas. Service areas are geographic regions nested within 21 regionally-defined Veterans Integrated Service Networks.
We performed two secondary analyses. Because the overall association between the process measures and mortality might reflect differences between service areas (Finney et al., 2011), we also examined the within-service area associations by fitting logistic regression models similar to those described above but adding fixed-effect terms for service areas instead of cluster-adjusting for service areas. The estimated odds ratio for these analyses compares mortality risk by receipt of the process measure for patients within the same service area.
2.7 Sensitivity Analysis
A complication to examining the association between receipt of care and mortality using observational data is that the amount and type of care patients get could differ based on the severity of their illness in a way unexplained by the measured data on patient risk factors (Lin et al., 1998). We applied a sensitivity analysis approach to evaluate how sensitive our results would be to a hypothetical dichotomous unmeasured confounder, U, that was unavailable in the data and had a positive association with mortality. We implement this by assuming the true logistic regression model should contain an additional term, b*Ui, where b is the regression coefficient for Ui, the value of a hypothetical unobserved confounder for patient i. We examine how large an effect U would need to have to invalidate our statistically significant findings. For each process measure, we examine three scenarios under which U is associated with higher mortality:
The magnitude of the effect of U is the size of the average process measure effect across all of the analyses (OR(U)=exp(b3)=1.30)
The magnitude of the effect of U is equal to the maximum process measure effect (OR(U) =1.43)
The magnitude of the effect of U exceeds the largest observed effect of the process measure and risk-adjustment variables1 across all of the analyses (OR(U) =1.68). These values of OR(U) were chosen since effects of these magnitudes were found in our analyses, making them plausible estimates of the potential size of an unobserved confounder's effect (Griffin et al., 2012).
3. Results
In FY2007, 32,422 patients with OUDs accessed services provided or paid for by the VA. Table 1 shows their demographic and descriptive characteristics; 96% were male and the average age was 52 (SD=9). Sixty-eight percent had at least one new SUD treatment episode; 23% had co-occurring PTSD. The unadjusted mortality rate was 3.7% at 12 months (1,165 individuals) and 7.2% at 24 months (2,272).
Table 1. Characteristics of Veterans with Opioid Use Disorder Receiving Care from VHA, FY 2007 (N=32,422).
| Male, No. (%) | 31,072 (95.8) |
| Age, mean (SD) | 51.8 (9.0) |
| Race/Ethnicity* | |
| White, No. (%) | 14,726 (45.4) |
| Black, No. (%) | 9,422 (29.1) |
| Hispanic, No. (%) | 1,541 (4.7) |
| Other/Unknown, No. (%) | 6,733 (20.8) |
| Marital Status* | |
| Married, No. (%) | 8,316 (25.7) |
| Not Married, No. (%) | 23,932 (73.8) |
| Patient setting ** | |
| Rural, No. (%) | 3,960 (12.2) |
| Urban, No. (%) | 28,133 (86.8) |
| Service connected, No. (%) | 11,159 (34.4) |
| Mental Health Disorder | |
| Schizophrenia | 1,844 (5.7) |
| Bipolar I Disorder | 2,485 (7.7) |
| PTSD | 7,403 (22.8) |
| Major Depression | 4,088 (12.6) |
| Charlson-Deyo Morbidity Index | 0.62 (1.86) |
| With NTEa, No. (%) | 22,716 (70.1) |
| With SUD NTE, No. (%) | 22,131 (68.3) |
| With MH NTE, No. (%) | 7,085 (21.9) |
| Mortality | |
| 12-month, No. (%) | 1,165(3.7) |
| 24-month, No. (%) | 2,272 (7.2) |
Does not equal 100% due to missing data
RUCA code missing for 329 patients
New Treatment Episode
Adherence to the process measures ranged from a high of 79% (any psychosocial treatment) to a low of 12% (HIV screening). Ten percent of the population received a prescription benzodiazepine during the study period, 41% received a prescription opioid and 45% received either a prescription benzodiazepine or a prescription opioid. Twenty-five percent received any OUD pharmacotherapy, and 19% received OUD pharmacotherapy for at least three months. Thirty-three percent saw a physician at least once a quarter.
Figure 1 shows the risk-adjusted odds ratio estimates of 12- and 24-month mortality for the process measures in the primary outcomes analyses, where the odds ratios are represented as squares and their 95% confidence intervals as horizontal segments. Not being prescribed opioids and/or benzodiazepines, psychosocial treatment, and quarterly physician visits were significantly associated with lower odds of mortality at both 12- and 24-months (p<.01 for 12-month quarterly physician visits; p<.001 for the other measures and time points). The associations of hepatitis screening, HIV screening, receipt of OUD pharmacotherapy, and 3-month OUD pharmacotherapy with 12- and 24-month mortality were not significant.
Figure 1.
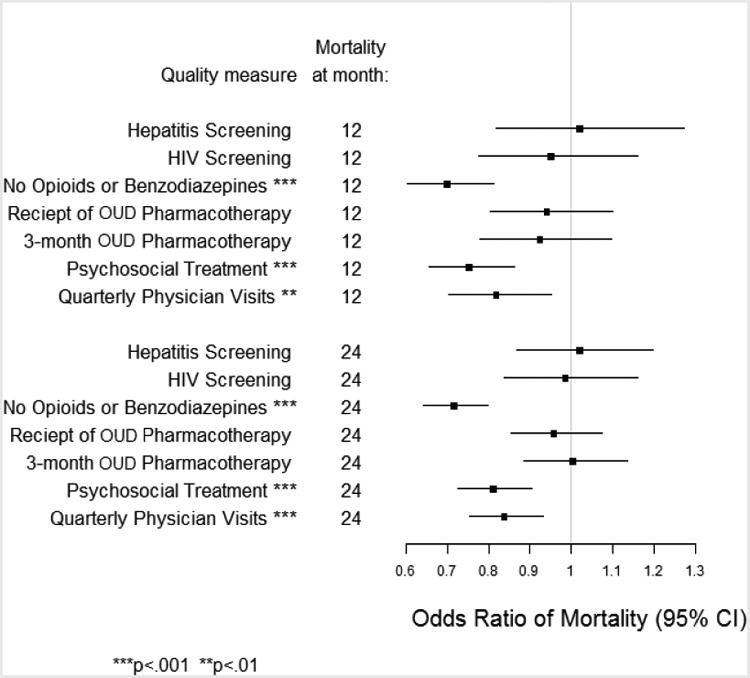
Mortality associated with receiving the care assessed by each process measure at 12-and 24-months in veterans with opioid use disorders (OUD).
Table 2 translates the model results shown in Figure 1 to predicted probabilities of mortality by receipt of each process measure, and shows the avoidable excess mortality for each measure. Receiving the care described by the measure reduced 12-month mortality by up to 29% (no prescription opioids or benzodiazepines).
Table 2. 12-Month and 24-Month Mortality by Measure Performance; Avoidable Excess Mortality (N=31,016).
| Process Measure | Mortality Rate-Received Measured Care (%) | Mortality Did not Rate-Receive Measured Care (%) | % Change | Avoidable Excess Mortality, No. |
|---|---|---|---|---|
| 12-Month Mortality | ||||
| Hepatitis screening | 3.8 | 3.7 | 2 | -27 |
| HIV screening | 3.6 | 3.7 | -5 | 27 |
| No prescription opioids or benzodiazepines*** | 3.1 | 4.3 | -29 | 159 |
| Receipt of any OUD pharmacotherapy | 3.5 | 3.7 | -6 | 46 |
| Receipt of OUD pharmacotherapy for at least 3 months | 3.5 | 3.7 | -7 | 50 |
| Psychosocial treatment*** | 3.5 | 4.5 | -24 | 53 |
| Quarterly physician visits** | 3.2 | 3.9 | -18 | 142 |
| 24-Month Mortality | ||||
| Hepatitis screening | 7.3 | 7.2 | 2 | -27 |
| HIV screening | 7.1 | 7.2 | -1 | 27 |
| No prescription opioids or benzodiazepines*** | 6.2 | 8.3 | -27 | 279 |
| Receipt of any OUD pharmacotherapy | 7.0 | 7.3 | -4 | 69 |
| Receipt of OUD pharmacotherapy for at least 3 months | 7.2 | 7.2 | 0 | 0 |
| Psychosocial treatment *** | 6.9 | 8.3 | -18 | 75 |
| Quarterly physician visits*** | 6.5 | 7.6 | -15 | 223 |
p<001;
p<.01
Figure 2 summarizes how large an effect an unobserved confounder would need to have to render non-significant the significant multivariate analysis findings (Lindenauer et al., 2014). Statistical significance depends on the prevalence of U for those who receive the process measure (P1: x-axis), the prevalence among those who do not receive the process measure (P0: y-axis), and the odds ratio of U. Darker shading indicates stronger effects of U are required to render the finding non-significant (p>0.05). Specifically, the dark gray / middle gray / light gray shading indicates combinations of P1 and P0 for which OR(U) = 1.68 / 1.43 / 1.30 would render the findings non-significant. Non-shaded areas represent combinations of P0 and P1 for which the significance of the findings holds for the three values of OR(U) examined. To put these hypothetical differences between P1 and P0 into context, we consider the difference in the prevalence of each dichotomous observed confounder (e.g., covariates in our regression models) by receipt of each measure. The largest observed difference between P1 and P0 across the measures in this study was 16.5 percentage points. For five of the six significant results, the difference between P1 and P0 would need to exceed at least 20 percentage points in order to render findings non-significant given the range of OR(U) examined here, with the difference needing to be as large as 50 percentage points for the opioids or benzodiazepines. Only for the sixth significant result, quarterly physician visits at 12 months, would a smaller difference between P1 and P0, of 10 percentage points, render the association non-significant if an unobserved confounder had the most extreme effect examined here (OR(U)=1.68); an unobserved confounder with a weaker effect would only render the finding non-significant if the difference between P1 and P0 were 20 percentage points or greater, larger than what was observed in our data. The robustness of the findings is supported by noting that the percentage point difference for P1 and P0 required to render findings non-significant is larger than any difference in our observed covariates, suggesting it is an unrealistically large difference to expect given the observed confounders.
Figure 2.
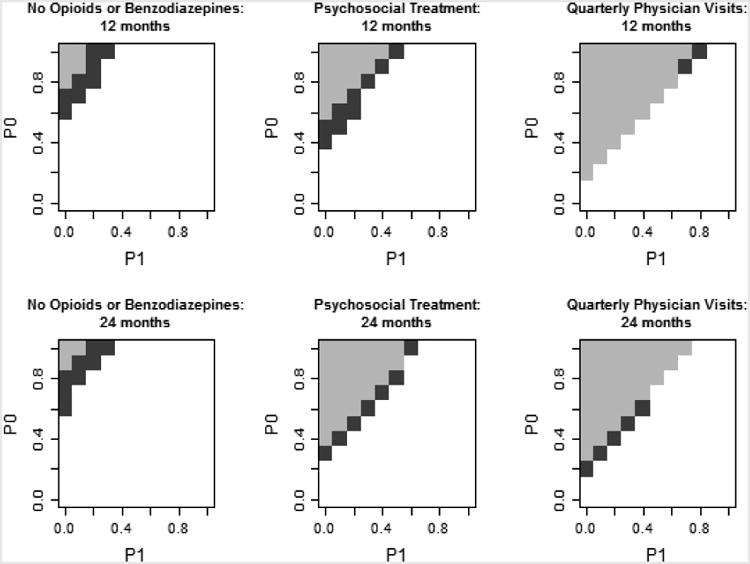
Sensitivity analysis of the potential impact of an unobserved confounder, U, on significant associations of the quality measure and mortality.
Areas with no shading remained significant for selected OR(U) values. Shaded areas represent combinations of P1, P0, and OR(U) that would result in a loss of significance of the QM-mortality association. Dark gray: OR(U)=1.68, middle gray: OR(U)=1.43, light gray: OR(U)=1.30.
4. Discussion
Among individuals with OUDs, receiving 3 of the 7 process measures was associated with lower 12- and 24-month mortality and provides initial evidence for their use as quality measures. Not being prescribed either prescription opioids or benzodiazepines, use of psychosocial treatment and quarterly physician visits were all associated with lower mortality at 12 and 24 months. It is important to note that while the population was at least minimally engaged with VA care, nearly 17% did not receive any VA outpatient SUD treatment during the measurement year, indicating that the population included individuals who were both in and out of formal SUD treatment. These results are consistent with other research that has shown increased mortality with the use of benzodiazepines for individuals who are on chronic opioids, and decreased mortality in individuals with SUDs on chronic opioid therapy who also received either inpatient or outpatient SUD treatment (Gaither et al., 2016a). Laboratory tests for Hepatitis B, C or HIV were not associated with lower mortality.
Surprisingly, we did not find an association with either OUD pharmacotherapy initiation or maintenance and mortality. Pharmacotherapy for OUD is a well-established component of treatment (Ries et al., 2009) and many studies have shown an association between OUD pharmacotherapy and mortality (Cornish et al., 2010; Degenhardt et al., 2009; Pierce et al., 2016). The lack of association in this population may be due to differences between this and other populations studied, the nature of the services they were receiving, or because of the well-documented increased risk of mortality during times of pharmacotherapy treatment initiation and cessation (Buster et al., 2002; Cornish et al., 2010; Cousins et al., 2016; Degenhardt et al., 2009; Kimber et al., 2015; Pierce et al., 2016; Pierce et al., 2015; Tjagvad et al., 2016). This is also an observational study and causal inferences cannot be made. Our findings underscore the importance of examining the relationship between OUD pharmacotherapy and mortality in different populations receiving services in a range of real world settings, and of creating OUD pharmacotherapy measures that take into account the variations in mortality risk associated with pharmacotherapy initiation, maintenance and cessation. It also underscores the importance of establishing both the reliability and predictive validity of process-based measures before they are adopted as quality measures.
Prior studies have suggested that substantial numbers of individuals treated for OUDs may be prescribed opioids and benzodiazepines (Stein et al., 2016). There are a number of mechanisms whereby prescribing either benzodiazepines or opioids to individuals with OUDs may lead to increased mortality (Charlson et al., 2009; Weisberg et al., 2015). Combination use increases the independent and synergistic sedative properties of both medications, and is the likely mechanism for the increased risk of overdose deaths (Jann et al., 2014; Jones et al., 2012; Vogel et al., 2013). Falls, fractures, automobile accidents and pulmonary-related illnesses are also associated with opioid and/or benzodiazepine use. Avoiding unnecessary prescriptions for opioids and/or benzodiazepines among individuals with OUDs is a prime target for intervention efforts, and could involve multiple complementary initiatives, including prescriber education, such as in the recent Surgeon General letter to prescribers (Surgeon General of the United States, 2016), and efforts to alert providers to such prescribing through electronic health records or prescription drug monitoring programs. Because some individuals with OUDs may be receiving either prescription opioids or benzodiazepines appropriately, this measure should receive further study.
OUDs are frequently co-morbid with medical problems (Centers for Disease Control and Prevention, 2012; Degenhardt et al., 2011; Degenhardt et al., 2014b; Ries et al., 2015), putting individuals at risk for polypharmacy (Dublin et al., 2011; Saunders et al., 2010; Woolcott et al., 2009) and poor care for their medical conditions. The few studies examining the link between utilization and mortality suggest that more service use could increase the receipt of preventive health services as well the early identification and management of new or worsening physical health problems (Druss et al., 2001; Meyer et al., 2014; Paddock et al., in press; Ronan and Herzig, 2016; Watkins et al., 2016). We found that frequent physician monitoring was associated with decreased mortality. Increasing integration of medical and SUD treatment services may facilitate higher rates of physical health monitoring in the future (Alford et al., 2011; Chung et al., 2016; Melek et al., 2014; Pincus et al., 2015).
Our findings of lower mortality rates with psychosocial treatment are consistent with other studies demonstrating that psychosocial treatment may result in decreased drug use and increased abstinence, and that abstinence from drugs is associated with reductions in mortality risk (Langendam et al., 2001; Peles et al., 2010; Scott et al., 2011). Mortality risk from overdose is lower during SUD treatment (Buster et al., 2002; Pierce et al., 2016), and treatment may permit earlier recognition of relapse or the development of medical complications. As the number of opioid-related deaths continues to increase, clinicians and policy makers need to consider how best to ensure that the population of individuals with OUD are able to receive effective psychosocial treatment.
Our study adds to initial work being done on measure development for OUDs (American Society of Addiction Medicine (ASAM), 2016; Harris et al., 2016; U.S. Department of Health and Human Services, n.d.). The American Psychiatric Association has proposed a measure that captures the proportion of individuals with OUDs who were counselled regarding treatment options, and the Washington Circle group has developed and tested for feasibility an opioid pharmacotherapy initiation measure. The National Committee on Quality Assurance has put forward a related measure on HIV testing in injection drug users. While our measures do not speak specifically to these development processes, none of these measures have been tested for validity, and our results highlight the importance of examining the association of proposed measures with a range of outcomes before accepting them as valid measures of quality. While public reporting of performance can enhance transparency and the value of health care, unless quality measures are both reliable and valid, using them to improve performance poses risks for clinicians, patients and consumers (Austin et al., 2016). Unfortunately there is no agreed upon standard for how reliable and valid a measure should be before it is accepted and used in public reporting, quality improvement efforts or pay for performance programs.
Strengths of our study include the large, population-based database, the importance of the clinical outcome, and the ease with which these measures can be operationalized. The proposed measures can be populated using administrative data available in many settings, making them feasible to implement and report. Because the measures reflect specific clinical processes, they can provide timely and actionable information to health care systems about where quality needs to be improved. The robustness of our main findings is supported by the sensitivity analysis. Either the difference in the prevalence of an unobserved confounder would have to be unrealistically large given the observed covariate data, or a relatively large effect of an unobserved confounder would be required in order to render these findings non-significant.
Our findings must be viewed within the context of study limitations. The VA system is an organizationally and financially integrated system of care, and we do not know if our results will generalize to care outside of the VA system. We used ICD-9 codes to identify individuals with OUD, and cannot assess the validity of how the codes were applied, which may create selection bias. We note however that the population included all veterans identified and recorded as having an OUD, regardless of whether they were receiving treatment. We cannot distinguish between those who had an OUD related to prescription opioid misuse and those who were using heroin or other illicit opioids, or whether the population included individuals in sustained remission whose ICD-9 diagnosis had not been updated. Observational data analyses can identify associations, but not causal mechanisms. Though sensitivity analyses establish the robustness of our associations for a plausible range of unobserved confounding, results could be sensitive to other types of confounding. Study data is from FY 2007, although all process measures reflect recommended clinical practices that have not changed since FY2007. The association between the continuity of care and the psychosocial treatment measure and mortality was independent of the visit type, suggesting that similar relationships with mortality should be observed today, even if the specific treatment processes have changed.
5. Conclusions
At a time when health care systems are increasingly focused on measuring, assessing, and providing incentives to improve quality (Glied et al., 2015; Patel et al., 2015), the lag in the development of behavioral health measures as compared to physical health measures is concerning (Institute of Medicine, 2006). Our findings of an association between three of our seven process measures and mortality provide support for the predictive validity of these measures and for their use as quality measures. It also furthers the development and validation of quality measures for OUDs.
Highlights.
Better quality is associated with lower mortality in people with opioid disorders
By improving quality, health systems may reduce avoidable excess mortality
Avoiding unnecessary prescription opioids and benzodiazepines is a prime target
Psychosocial treatment and treatment continuity is associated with lower mortality
Acknowledgments
This material is the result of work supported with resources and the use of facilities at the Central Arkansas Veteran Healthcare Center, Little Rock, AR. Research reported in this publication was supported by the National Institute on Drug Abuse of the National Institutes of Health under Award Number R01DA033953. The content is solely the responsibility of the authors and does not necessarily represent the official views of the National Institutes of Health. The sponsors had no role in the design and conduct of the study; collection, management, analysis, and interpretation of the data; and preparation, review, or approval of the manuscript. Dr. Watkins had full access to all of the data in the study and takes responsibility for the integrity of the data and the accuracy of the data analysis. The views expressed in this article are those of the authors and do not necessarily reflect the position or policy of the Department of Veterans Affairs or the United States government. The authors acknowledge the editorial assistance of Tiffany Hruby, RAND Corporation and Carrie Edlund, MS, University of Arkansas for Medical Sciences. No additional compensation was received for their services.
Role of Funding Source: Nothing declared.
Footnotes
For non-dichotomous predictors age and Charlson index, the odds ratios reflect the effect of age/10 and a change of 0.1 points in the Charlson comorbidity index, respectively.
Author Disclosure: Contributors: Each author has contributed significantly to the work and agrees to the submission. Katherine E. Watkins obtained funding, designed the study, developed quality measures, interpreted data, and drafted and edited the article. Susan M. Paddock specified statistical models, led analyses, reviewed results, and reviewed and edited the manuscript. Teresa J. Hudson oversaw the IRB review and obtaining data, reviewed results, and reviewed and edited the manuscript. Songthip Ounpraseuth conducted analyses, reviewed results, and reviewed and edited the manuscript. Amy M. Schrader conducted analyses, and reviewed and edited the manuscript. Kimberly A. Hepner participated in the study design, data interpretation and reviewed and edited the manuscript. Bradley D. Stein helped develop quality measures, data interpretation, and reviewed and edited the manuscript.
Conflict of Interest: No conflict declared.
Publisher's Disclaimer: This is a PDF file of an unedited manuscript that has been accepted for publication. As a service to our customers we are providing this early version of the manuscript. The manuscript will undergo copyediting, typesetting, and review of the resulting proof before it is published in its final citable form. Please note that during the production process errors may be discovered which could affect the content, and all legal disclaimers that apply to the journal pertain.
References
- Alford DP, LaBelle CT, Kretsch N, Bergeron A, Winter M, Botticelli M, Samet JH. Collaborative care of opioid-addicted patients in primary care using buprenorphine: Five-year experience. Arch Intern Med. 2011;171:425–431. doi: 10.1001/archinternmed.2010.541. [DOI] [PMC free article] [PubMed] [Google Scholar]
- American Society of Addiction Medicine (ASAM) Standards and Performance Measures. [Accessed on October 3 2016];2016 http://www.asam.org/quality-practice/standards-and-performance-measures.
- Austin JM, McGlynn EA, Pronovost PJ. Fostering transparency in outcomes, quality, safety, and costs. JAMA. 2016;316:1661–1662. doi: 10.1001/jama.2016.14039. [DOI] [PubMed] [Google Scholar]
- Baxter JD, Clark RE, Samnaliev M, Aweh G, O'Connell E. Adherence to buprenorphine treatment guidelines in a Medicaid program. Subst Abus. 2015;36:174–182. doi: 10.1080/08897077.2014.991469. [DOI] [PubMed] [Google Scholar]
- Birnbaum HG, White AG, Schiller M, Waldman T, Cleveland JM, Roland CL. Societal costs of prescription opioid abuse, dependence, and misuse in the United States. Pain Med. 2011;12:657–667. doi: 10.1111/j.1526-4637.2011.01075.x. [DOI] [PubMed] [Google Scholar]
- Buster MC, van Brussel GH, van den Brink W. An increase in overdose mortality during the first 2 weeks after entering or re-entering methadone treatment in Amsterdam. Addiction. 2002;97:993–1001. doi: 10.1046/j.1360-0443.2002.00179.x. [DOI] [PubMed] [Google Scholar]
- Centers for Disease Control and Prevention. HIV infection and HIV-associated behaviors among injecting drug users - 20 cities, United States, 2009. MMWR Morbid Mortal Wkly Rep. 2012;61:133–138. [PubMed] [Google Scholar]
- Centers for Disease Control and Prevention (CDC) Vital signs: Overdoses of prescription opioid pain relievers---United States, 1999--2008. MMWR Morb Mortal Wkly Rep. 2011;60:1487–1492. [PubMed] [Google Scholar]
- Charlson F, Degenhardt L, McLaren J, Hall W, Lynskey M. A systematic review of research examining benzodiazepine-related mortality. Pharmacoepidemiol Drug Saf. 2009;18:93–103. doi: 10.1002/pds.1694. [DOI] [PubMed] [Google Scholar]
- Chung H, Rostanski N, Glassberg H, Pincus HA. Advancing Integration of Behavioral Health into Primary Care: A Continuum-Based Framework. United Hospital Fund; New York: 2016. [Google Scholar]
- Cornish R, Macleod J, Strang J, Vickerman P, Hickman M. Risk of death during and after opiate substitution treatment in primary care: Prospective observational study in UK General Practice Research Database. BMJ. 2010;341:c5475. doi: 10.1136/bmj.c5475. [DOI] [PMC free article] [PubMed] [Google Scholar]
- Cousins G, Boland F, Courtney B, Barry J, Lyons S, Fahey T. Risk of mortality on and off methadone substitution treatment in primary care: A national cohort study. Addiction. 2016;111:73–82. doi: 10.1111/add.13087. [DOI] [PubMed] [Google Scholar]
- Dafni U. Landmark analysis at the 25-year landmark point. Circ Cardiovasc Qual Outcomes. 2011;4:363–371. doi: 10.1161/CIRCOUTCOMES.110.957951. [DOI] [PubMed] [Google Scholar]
- Davoli M, Bargagli AM, Perucci CA, Schifano P, Belleudi V, Hickman M, Salamina G, Diecidue R, Vigna-Taglianti F, Faggiano F Group, V.E.S. Risk of fatal overdose during and after specialist drug treatment: the VEdeTTE study, a national multi-site prospective cohort study. Addiction. 2007;102:1954–1959. doi: 10.1111/j.1360-0443.2007.02025.x. [DOI] [PubMed] [Google Scholar]
- Degenhardt L, Bucello C, Mathers B, Briegleb C, Ali H, Hickman M, McLaren J. Mortality among regular or dependent users of heroin and other opioids: A systematic review and meta-analysis of cohort studies. Addiction. 2011;106:32–51. doi: 10.1111/j.1360-0443.2010.03140.x. [DOI] [PubMed] [Google Scholar]
- Degenhardt L, Charlson F, Mathers B, Hall WD, Flaxman AD, Johns N, Vos T. The global epidemiology and burden of opioid dependence: Results from the global burden of disease 2010 study. Addiction. 2014a;109:1320–1333. doi: 10.1111/add.12551. [DOI] [PubMed] [Google Scholar]
- Degenhardt L, Larney S, Randall D, Burns L, Hall W. Causes of death in a cohort treated for opioid dependence between 1985 and 2005. Addiction. 2014b;109:90–99. doi: 10.1111/add.12337. [DOI] [PubMed] [Google Scholar]
- Degenhardt L, Randall D, Hall W, Law M, Butler T, Burns L. Mortality among clients of a state-wide opioid pharmacotherapy program over 20 years: Risk factors and lives saved. Drug Alcohol Depend. 2009;105:9–15. doi: 10.1016/j.drugalcdep.2009.05.021. [DOI] [PubMed] [Google Scholar]
- Deyo RA, Cherkin DC, Ciol MA. Adapting a clinical comorbidity index for use with ICD-9-CM administrative databases. J Clin Epidemiol. 1992;45:613–619. doi: 10.1016/0895-4356(92)90133-8. [DOI] [PubMed] [Google Scholar]
- Druss BG, Bradford WD, Rosenheck RA, Radford MJ, Krumholz HM. Quality of medical care and excess mortality in older patients with mental disorders. Arch Gen Psychiatry. 2001;58:565–572. doi: 10.1001/archpsyc.58.6.565. [DOI] [PubMed] [Google Scholar]
- Dublin S, Walker RL, Jackson ML, Nelson JC, Weiss NS, Von Korff M, Jackson LA. Use of opioids or benzodiazepines and risk of pneumonia in older adults: A population-based case-control study. J Am Geriatr Soc. 2011;59:1899–1907. doi: 10.1111/j.1532-5415.2011.03586.x. [DOI] [PMC free article] [PubMed] [Google Scholar]
- Finney JW, Humphreys K, Kivlahan DR, Harris AH. Why health care process performance measures can have different relationships to outcomes for patients and hospitals: Understanding the ecological fallacy. Am J Public Health. 2011;101:1635–1642. doi: 10.2105/AJPH.2011.300153. [DOI] [PMC free article] [PubMed] [Google Scholar]
- Frenk SM, Porter KS, Paulozzi LJ. Prescription opioid analgesic use among adults: United States, 1999-2012. NCHS Data Brief. 2015:1–8. [PubMed] [Google Scholar]
- Gaither JR, Goulet JL, Becker WC, Crystal S, Edelman EJ, Gordon K, Kerns RD, Rimland D, Skanderson M, Justice AC, Fiellin DA. The association between receipt of guideline-concordant long-term opioid therapy and all-cause mortality. J Gen Intern Med. 2016a;31:492–501. doi: 10.1007/s11606-015-3571-4. [DOI] [PMC free article] [PubMed] [Google Scholar]
- Gaither JR, Goulet JL, Becker WC, Crystal S, Edelman EJ, Gordon K, Kerns RD, Rimland D, Skanderson M, Justice AC, Fiellin DA. The effect of substance use disorders on the association between guideline-concordant long-term opioid therapy and all-cause mortality. J Addict Med. 2016b;10:418–428. doi: 10.1097/ADM.0000000000000255. [DOI] [PMC free article] [PubMed] [Google Scholar]
- Garnick DW, Lee MT, Chalk M, Gastfriend D, Horgan CM, McCorry F, McLellan AT, Merrick EL. Establishing the feasibility of performance measures for alcohol and other drugs. J Subst Abuse Treat. 2002;23:375–385. doi: 10.1016/s0740-5472(02)00303-3. [DOI] [PubMed] [Google Scholar]
- Garnick DW, Lee MT, Horgan CM, Acevedo A Washington Circle Public Sector, W. Adapting Washington Circle performance measures for public sector substance abuse treatment systems. J Subst Abuse Treat. 2009;36:265–277. doi: 10.1016/j.jsat.2008.06.008. [DOI] [PMC free article] [PubMed] [Google Scholar]
- Glied SA, Stein BD, McGuire TG, Beale RR, Duffy FF, Shugarman S, Goldman HH. Measuring performance in psychiatry: A call to action. Psychiatr Serv. 2015;66:872–878. doi: 10.1176/appi.ps.201400393. [DOI] [PubMed] [Google Scholar]
- Gomes T, Mamdani MM, Dhalla IA, Cornish S, Paterson JM, Juurlink DN. The burden of premature opioid-related mortality. Addiction. 2014;109:1482–1488. doi: 10.1111/add.12598. [DOI] [PMC free article] [PubMed] [Google Scholar]
- Gordon AJ, Lo-Ciganic WH, Cochran G, Gellad WF, Cathers T, Kelley D, Donohue JM. Patterns and quality of buprenorphine opioid agonist treatment in a large medicaid program. J Addict Med. 2015;9:470–477. doi: 10.1097/ADM.0000000000000164. [DOI] [PubMed] [Google Scholar]
- Graubard BI, Korn EL. Predictive margins with survey data. Biometrics. 1999;55:652–659. doi: 10.1111/j.0006-341x.1999.00652.x. [DOI] [PubMed] [Google Scholar]
- Griffin BA, McCaffrey D, Ramchand R, Hunter SB, Suttorp M. Assessing the sensitivity of treatment effect estimates to differential follow-up rates: Implications for translational research. Health Serv Outcomes Res Methodol. 2012;12:84–103. doi: 10.1007/s10742-012-0089-7. [DOI] [PMC free article] [PubMed] [Google Scholar]
- Grossbard JR, Malte CA, Saxon AJ, Hawkins EJ. Clinical monitoring and high-risk conditions among patients with SUD newly prescribed opioids and benzodiazepines. Drug Alcohol Depend. 2014;142:24–32. doi: 10.1016/j.drugalcdep.2014.03.020. [DOI] [PubMed] [Google Scholar]
- Harris AH, Ellerbe L, Phelps TE, Finney JW, Bowe T, Gupta S, Asch SM, Humphreys K, Trafton J. Examining the specification validity of the HEDIS quality measures for substance use disorders. J Subst Abuse Treat. 2015;53:16–21. doi: 10.1016/j.jsat.2015.01.002. [DOI] [PubMed] [Google Scholar]
- Harris AH, Humphreys K, Bowe T, Tiet Q, Finney JW. Does meeting the HEDIS substance abuse treatment engagement criterion predict patient outcomes? J Behav Health Serv Res. 2010;37:25–39. doi: 10.1007/s11414-008-9142-2. [DOI] [PubMed] [Google Scholar]
- Harris AH, Weisner CM, Chalk M, Capoccia V, Chen C, Thomas CP. Specifying and pilot testing quality measures for the American society of addiction medicine's standards of care. J Addict Med. 2016;10:148–155. doi: 10.1097/ADM.0000000000000203. [DOI] [PMC free article] [PubMed] [Google Scholar]
- Institute of Medicine. Improving the Quality of Health Care for Mental and Substance-Use Conditions. National Academies Press; Washington, DC: 2006. [PubMed] [Google Scholar]
- Jann M, Kennedy WK, Lopez G. Benzodiazepines: A major component in unintentional prescription drug overdoses with opioid analgesics. J Pharm Pract. 2014;27:5–16. doi: 10.1177/0897190013515001. [DOI] [PubMed] [Google Scholar]
- Jones JD, Mogali S, Comer SD. Polydrug abuse: A review of opioid and benzodiazepine combination use. Drug Alcohol Depend. 2012;125:8–18. doi: 10.1016/j.drugalcdep.2012.07.004. [DOI] [PMC free article] [PubMed] [Google Scholar]
- Kimber J, Larney S, Hickman M, Randall D, Degenhardt L. Mortality risk of opioid substitution therapy with methadone versus buprenorphine: A retrospective cohort study. Lancet Psychiatry. 2015;2:901–908. doi: 10.1016/S2215-0366(15)00366-1. [DOI] [PubMed] [Google Scholar]
- Klabunde CN, Potosky AL, Legler JM, Warren JL. Development of a comorbidity index using physician claims data. J Clin Epidemiol. 2000;53:1258–1267. doi: 10.1016/s0895-4356(00)00256-0. [DOI] [PubMed] [Google Scholar]
- Langendam MW, van Brussel GH, Coutinho RA, van Ameijden EJ. The impact of harm-reduction-based methadone treatment on mortality among heroin users. Am J Public Health. 2001;91:774–780. doi: 10.2105/ajph.91.5.774. [DOI] [PMC free article] [PubMed] [Google Scholar]
- Lin DY, Psaty BM, Kronmal RA. Assessing the sensitivity of regression results to unmeasured confounders in observational studies. Biometrics. 1998;54:948–963. [PubMed] [Google Scholar]
- Lindenauer PK, Stefan MS, Shieh MS, Pekow PS, Rothberg MB, Hill NS. Outcomes associated with invasive and noninvasive ventilation among patients hospitalized with exacerbations of chronic obstructive pulmonary disease. JAMA Intern Med. 2014;174:1982–1993. doi: 10.1001/jamainternmed.2014.5430. [DOI] [PMC free article] [PubMed] [Google Scholar]
- Martins SS, Sampson L, Cerda M, Galea S. Worldwide prevalence and trends in unintentional drug overdose: A systematic review of the literature. Am J Public Health. 2015;105:2373. doi: 10.2105/AJPH.2015.302843a. [DOI] [PMC free article] [PubMed] [Google Scholar]
- Melek S, Norris D, Paulus J. Economic Impact of Integrated Medical-Behavioral Healthcare: Implications for Psychiatry. Milliman, Inc; Denver, CO: 2014. [Google Scholar]
- Meyer R, Patel AM, Rattana SK, Quock TP, Mody SH. Prescription opioid abuse: A literature review of the clinical and economic burden in the United States. Popul Health Manag. 2014;17:372–387. doi: 10.1089/pop.2013.0098. [DOI] [PMC free article] [PubMed] [Google Scholar]
- Morrill R, Cromartie J, Hart LG. Metropolitan, urban, and rural communting areas: Toward a better depiction of the U.S. settlement system. Urban Geogr. 1999;20:727–748. [Google Scholar]
- Paddock SM, Hepner KA, Hudson TJ, Ounprasuth S, Schrader AM, Sullivan G, Watkins KE. Association between process-based quality indicators and mortality for patients with substance use disorders. J Stud Alcohol Drug. doi: 10.15288/jsad.2017.78.588. in press. [DOI] [PMC free article] [PubMed] [Google Scholar]
- Patel MM, Brown JD, Croake S, Lewis R, Liu J, Patton L, Potter DE, Scholle SH. The current state of behavioral health quality measures: Where are the gaps? Psychiatr Serv. 2015;66:865–871. doi: 10.1176/appi.ps.201400589. [DOI] [PubMed] [Google Scholar]
- Peles E, Schreiber S, Adelson M. 15-Year survival and retention of patients in a general hospital-affiliated methadone maintenance treatment (MMT) center in Israel. Drug Alcohol Depend. 2010;107:141–148. doi: 10.1016/j.drugalcdep.2009.09.013. [DOI] [PubMed] [Google Scholar]
- Pierce M, Bird SM, Hickman M, Marsden J, Dunn G, Jones A, Millar T. Impact of treatment for opioid dependence on fatal drug-related poisoning: A national cohort study in England. Addiction. 2016;111:298–308. doi: 10.1111/add.13193. [DOI] [PMC free article] [PubMed] [Google Scholar]
- Pierce M, Bird SM, Hickman M, Millar T. National record linkage study of mortality for a large cohort of opioid users ascertained by drug treatment or criminal justice sources in England, 2005-2009. Drug Alcohol Depend. 2015;146:17–23. doi: 10.1016/j.drugalcdep.2014.09.782. [DOI] [PMC free article] [PubMed] [Google Scholar]
- Pincus HA, Jun M, Franx G, van der Feltz-Cornelis C, Ito H, Mossialos E. How can we link general medical and behavioral health care? International models for practice and policy. Psychiatr Serv. 2015;66:775–777. doi: 10.1176/appi.ps.201400461. [DOI] [PubMed] [Google Scholar]
- Ries R, Krupski A, West II, Maynard C, Bumgardner K, Donovan D, Dunn C, Roy-Byrne P. Correlates of opioid use in adults with self-reported drug use recruited from public safety-net primary care clinics. J Addict Med. 2015;9:417–426. doi: 10.1097/ADM.0000000000000151. [DOI] [PMC free article] [PubMed] [Google Scholar]
- Ries RK, Miller SC, Fiellin DA. Principles of Addiction Medicine. Lippincott Williams and Wilkins; Philadelphia, PA: 2009. [Google Scholar]
- Ronan MV, Herzig SJ. Hospitalizations related to opioid abuse/dependence and associated serious infections increased sharply, 2002-12. Health Aff (Millwood) 2016;35:832–837. doi: 10.1377/hlthaff.2015.1424. [DOI] [PMC free article] [PubMed] [Google Scholar]
- Rudd RA, Aleshire N, Zibbell JE, Gladden RM. Increases in drug and opioid overdose deaths--United States, 2000-2014. MMWR Morb Mortal Wkly Rep. 2016a;64:1378–1382. doi: 10.15585/mmwr.mm6450a3. [DOI] [PubMed] [Google Scholar]
- Rudd RA, Seth P, David F, Scholl L. Increases in drug and opioid-involved overdose deaths - United States, 2010-2015. MMWR Morb Mortal Wkly Rep. 2016b;65:1445–1452. doi: 10.15585/mmwr.mm655051e1. [DOI] [PubMed] [Google Scholar]
- Saunders KW, Dunn KM, Merrill JO, Sullivan M, Weisner C, Braden JB, Psaty BM, Von Korff M. Relationship of opioid use and dosage levels to fractures in older chronic pain patients. J Gen Intern Med. 2010;25:310–315. doi: 10.1007/s11606-009-1218-z. [DOI] [PMC free article] [PubMed] [Google Scholar]
- Scott CK, Dennis ML, Laudet A, Funk RR, Simeone RS. Surviving drug addiction: The effect of treatment and abstinence on mortality. Am J Public Health. 2011;101:737–744. doi: 10.2105/AJPH.2010.197038. [DOI] [PMC free article] [PubMed] [Google Scholar]
- Sohn MW, Arnold N, Maynard C, Hynes DM. Accuracy and completeness of mortality data in the Department of Veterans Affairs. Popul Health Metr. 2006;4:2. doi: 10.1186/1478-7954-4-2. [DOI] [PMC free article] [PubMed] [Google Scholar]
- Stein B, Gordon A, Sorbero M, Dick A, Schuster J, Farmer C. The impact of buprenorphine on treatment of opioid dependence in a Medicaid population: Recent service utilization trends in the use of buprenorphine and methadone. Drug Alcohol Depend. 2012;123:72–78. doi: 10.1016/j.drugalcdep.2011.10.016. [DOI] [PubMed] [Google Scholar]
- Stein B, Mendelsohn J, Gordon A, Dick A, Burns R, Sobero M, Liccardo Pacula R. Opioid analgesic and benzodiazepine prescribing among Medicaid-enrollees with opioid use disorders: The role of provider communities. J Addict Dis. 2016;22:1–9. doi: 10.1080/10550887.2016.1211784. [DOI] [PMC free article] [PubMed] [Google Scholar]
- Surgeon General of the United States. The Surgeon General's Call to End the Opioid Crisis. [Accessed on September 6 2016];2016 http://turnthetiderx.org/
- Tjagvad C, Skurtveit S, Linnet K, Andersen LV, Christoffersen DJ, Clausen T. Methadone-related overdose deaths in a liberal opioid maintenance treatment programme. Eur Addict Res. 2016;22:249–258. doi: 10.1159/000446429. [DOI] [PubMed] [Google Scholar]
- U.S. Department of Health and Human Services. Agency for Healthcare Research and Quality. [Accessed on October 4 2016]; n.d. Substance Use Treatment Programs/Centers https://www.qualitymeasures.ahrq.gov/search?f_Measurement_Setting=Substance+Use+Treatment+Programs%2fCenters&fLockTerm=Substance+Use+Treatment+Programs%2fCenters)
- U.S. Department of Veterans Affairs. VA/DoD clinical practice guidelines: Management of substance use disorder (SUD) (2015) [Accessed on October 3 2016];2016 :106. http://www.healthquality.va.gov/guidelines/MH/sud/
- VA Information Resource Center. Calculating a Comorbidity Index for Risk Adjustment using VA or Medicare Data. U.S. Department of Veterans Affairs, Health Services Research and Development Service, VA Information Resource Center; Hines, IL: 2014. [Google Scholar]
- Vogel M, Knopfli B, Schmid O, Prica M, Strasser J, Prieto L, Wiesbeck GA, Dursteler-Macfarland KM. Treatment or “high”: Benzodiazepine use in patients on injectable heroin or oral opioids. Addict Behav. 2013;38:2477–2484. doi: 10.1016/j.addbeh.2013.05.008. [DOI] [PubMed] [Google Scholar]
- Watkins KE, Horvitz-Lennon M, Caldarone LB, Shugarman LR, Smith B, Mannle TE, Kivlahan DR, Pincus HA. Developing medical record-based performance indicators to measure the quality of mental healthcare. J Healthc Qual. 2011a;33:49–66. doi: 10.1111/j.1945-1474.2010.00128.x. quiz 66-47. [DOI] [PubMed] [Google Scholar]
- Watkins KE, Paddock SM, Hudson TJ, Ounpraseuth S, Schrader AM, Hepner KA, Sullivan G. Association between quality measures and mortality in individuals with co-occurring mental health and substance use disorders. J Subst Abuse Treat. 2016;69:1–8. doi: 10.1016/j.jsat.2016.06.001. [DOI] [PMC free article] [PubMed] [Google Scholar]
- Watkins KE, Smith B, Paddock SM, Mannle TE, Woodroffe A, Solomon J, Sorbero ME, Farmer CM, Hepner KA, Adamson DM, Forrest L, Call C, Pincus HA. Veterans Health Administration Mental Health Program Evaluation: Capstone Report (TR-956) RAND Corporation; Santa Monica, CA: 2011b. [Google Scholar]
- Weisberg DF, Gordon KS, Barry DT, Becker WC, Crystal S, Edelman EJ, Gaither J, Gordon AJ, Goulet J, Kerns RD, Moore BA, Tate J, Justice AC, Fiellin DA. Long-term prescription of opioids and/or benzodiazepines and mortality among HIV-infected and uninfected patients. J Acquir Immune Defic Syndr. 2015;69:223–233. doi: 10.1097/QAI.0000000000000591. [DOI] [PMC free article] [PubMed] [Google Scholar]
- Wierdsma A, Mulder C, de Vries S, Sytema S. Reconstructing continuity of care in mental health services: A multilevel conceptual framework. J Health Serv Res Policy. 2009;14:52–57. doi: 10.1258/jhsrp.2008.008039. [DOI] [PubMed] [Google Scholar]
- Woolcott JC, Richardson KJ, Wiens MO, Patel B, Marin J, Khan KM, Marra CA. Meta-analysis of the impact of 9 medication classes on falls in elderly persons. Arch Intern Med. 2009;169:1952–1960. doi: 10.1001/archinternmed.2009.357. [DOI] [PubMed] [Google Scholar]