

SUMMARY
Integrative brain functions depend on widely distributed, rhythmically coordinated computations. Through its long-ranging connections with cortex and most senses, the thalamus orchestrates the flow of cognitive and sensory information. Essential in this process, the nucleus reticularis thalami (nRT) gates different information streams through its extensive inhibition onto other thalamic nuclei; however, we lack an understanding of how different inhibitory neuron subpopulations in nRT function as gatekeepers. We dissociated the connectivity, physiology, and circuit functions of neurons within rodent nRT, based on parvalbumin (PV) and somatostatin (SOM) expression, and validated the existence of such populations in human nRT. We found that PV but not SOM cells are rhythmogenic, and that PV and SOM neurons are connected to and modulate distinct thalamocortical circuits. Notably, PV but not SOM neurons modulate somatosensory behavior and disrupt seizures. These results provide a conceptual framework for how nRT may gate incoming information to modulate brain-wide rhythms.
eTOC blurb
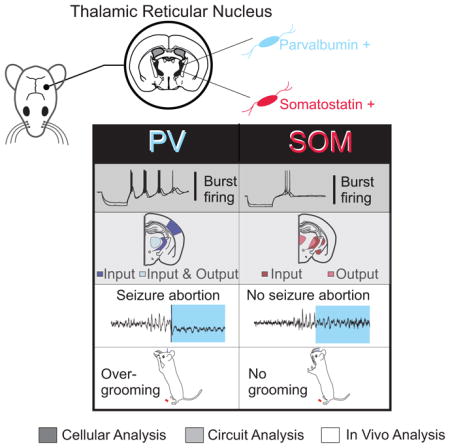
Clemente et al. deconstruct the reticular thalamus (nRT) at the cellular, circuit, and behavioral levels. They find that parvalbumin- and somatostatin-expressing neurons in nRT have distinct cellular and circuit properties, segregate along predominantly non-overlapping neuronal pathways, and differentially modulate thalamocortical rhythmogenesis, somatosensory behavior, and generalized seizures.
INTRODUCTION
The nucleus reticularis thalami (nRT) is the “guardian of the gateway” in the thalamocortical circuit, given its role in modulating interactions between the cerebral cortex and thalamus (Crick, 1984; Halassa and Acsády, 2016). The nRT modulates thalamocortical oscillations that underlie functions like such as attention, sensation, sleep, and consciousness (Calabrò et al., 2015; Crick, 1984; Steriade, 2005). Disruptions in this circuit correlate with neurological (Paz et al., 2010; Slaght et al., 2002) and psychiatric disorders (Ferrarelli and Tononi, 2011; Zhang et al., 2010).
The nRT contains inhibitory neurons that release gamma-aminobutyric acid (GABA). It is the main source of inhibition for the excitatory relay thalamus in rodents (Gentet and Ulrich, 2003; Houser et al., 1980). The nRT has been thought to include mainly parvalbumin-expressing neurons (PV) (Csillik et al., 2005; Hou et al., 2016; Jones and Hendry, 1989) but somatostatin-positive cells (SOM) were recently found in rodent nRT (Ahrens et al., 2015; Wells et al., 2016). These cells have not been detailed in humans. PV and SOM neurons have distinct functions in the cortex and hippocampus (reviewed by Kim et al., 2016), while little is known about whether they mediate different functions of the nRT. Further, the existence of functionally distinct neuron types within the nRT has been suggested (Halassa et al., 2014; Lee et al., 2007) but not associated with molecular markers.
nRT neurons can orchestrate brain-wide network activity (Crick, 1984; Halassa and Acsády, 2016). Brief optogenetic stimulation of nRT neurons in vivo induces spindles in the cortex during non-rapid eye movement sleep (Halassa et al., 2011), while sustained stimulation increases delta band power similar to slow-wave sleep (Lewis et al., 2015). Variations in anatomical connections between nRT and thalamic relay cells differentially modulate cortical oscillatory activity and attention (Halassa et al., 2014; Macdonald et al., 1998), but it remains unknown whether these different functions are mediated by cellular substrates that can be distinguished by molecular markers.
Because the nRT does not project directly back onto the cortex, nRT modulation of specific cortical regions depends on its topographical organization and connections with thalamic relay nuclei (Crabtree, 1992; Lam and Sherman, 2011). However, it remains unknown whether the different cell types in the nRT (i.e. PV and SOM cells) project to distinct thalamocortical relay nuclei to produce different functions in vivo.
We hypothesize that the nRT’s multiple functions are mediated by PV and SOM neurons that are anatomically connected to different circuits. Here, we deconstruct nRT PV and SOM neuron populations by assessing their intrinsic electric and synaptic membrane properties, pre- and post-synaptic connectivity, and functions within the thalamocortical circuit during normal and pathological behaviors.
RESULTS
PV and SOM Neurons Segregate Differentially within the nRT
We evaluated the location of PV and SOM neurons across the anterior-posterior (Figure 1A), medial-lateral, and dorsal-ventral axes of the nRT (Figure 1B) with genetic and immunohistochemical approaches. For validation of specificity and selectivity of Cre lines, see Supplemental Methods and Figure S1. PV and SOM cells were located across the entire anterior-posterior axis of the nRT. High-resolution confocal images distinguished singly labeled PV and SOM cells within the somatosensory nRT (Figures 1C–D), identifying a previously undescribed population of SOM neurons in the nRT that do not express PV. We divided the somatosensory nRT into tiers based on their projection patterns onto thalamic relay nuclei as described by (Lam and Sherman, 2011; Pinault and Deschênes, 1998) (Figure 1B & E). The distribution of SOM neurons was significantly different only in the medio-lateral axis of the somatosensory nRT. The number of singly labeled SOM cells was significantly lower than PV cells only in the central tier of the middle sector of the nRT (Figures 1E and 1B). Only a minority of neurons displayed both neurochemical markers (10–20%) in the somatosensory nRT (Figure 1E).
Figure 1. PV and SOM Neurons Segregate Differentially Across Thalamic Reticular nucleus (nRT) Boundaries.

(A) Representative composite images (individual images, 10x) of coronal brain sections from SOM-Ai14 (red) mice labeled with PV-antibody (green). Sections span anterior, middle, and posterior portions of the nRT. Left: full coronal slices; nRT outlined in white. Right: higher-magnification images of the nRT. Scale bar: 500 μm.
(B) Confocal images (20x) of the head, middle, and tail portions of the somatosensory nRT. Scale bar: 20 μm. Middle portion divided into tiers by white lines.
(C) High magnification confocal images showing examples of non-overlapping populations of individual neurons labeled for either PV (green) or SOM (red). Scale bar: 20 μm.
(D) Confocal Z-stack (25 slices, depth: 9.32 μm, 0.37 μm interval) showing a population of non-overlapping red SOM cells and a single green PV cell. Scale bar, 20 μm.
(E) Left, quantification of nRT neurons expressing markers for PV (grey), SOM (black), or both (overlay, orange). Data represent mean ± SEM analyzed with a Mann-Whitney test and α=0.05. (*p<0.05, **p<0.01, ***p<0.001). Analysis includes 4 mice (n=2 slices per mouse, 1 image per nRT region). Right, divisions of nRT into “head,” “middle,” and “tail.” Middle was divided into tiers from most medial (1), central (2), and most lateral (3) according to (Lam and Sherman, 2011; Pinault and Deschenes, 1998). nRT, nuclear reticular thalamus. See also Figure S1.
PV and SOM Neurons Exhibit Different Intrinsic Membrane Excitability
The electrophysiological properties of neurons vary depending on their location in the nRT (Lee et al., 2007). Not all nRT cells have the classic rebound bursting mediated by low-threshold, transient Ca2+ -dependent depolarizations, called low-threshold calcium spikes (LTS) (Contreras et al., 1992; Jahnsen and Llinás, 1984). We sampled neurons across anterior-posterior, medial-lateral, and dorsal-ventral axes of the somatosensory nRT (Figure S2).
Passive and active membrane properties
To assess the properties of PV and SOM neurons between postnatal day 30 and 50 (P30–P50), we crossed PV-Cre and SOM-Cre mice with Ai32 mice expressing Cre-dependent channelrhodopsin-2 (ChR2). We identified cells via whole-cell patch-clamping based on their opsin expression (Figure S2). We found that the membrane input resistance (Rin), time constant (τm), resting potential (Vm) and capacitance (Cm) were similar in PV and SOM neurons (Table S1; Figure 2A,F), supporting that PV and SOM neurons have similar passive membrane properties. Also, PV and SOM neurons showed similar mean frequency-current (F-I) slope and rheobase [i.e., the minimal current intensity required to trigger an action potential (AP)] (Table S1; Figures 2E–2F)).
Figure 2. PV and SOM Neurons in nRT Exhibit Distinct Firing Properties.

(A–D) Data from 14 PV cells from 4 mice and 16 SOM cells from 8 mice.
(A) Representative traces showing that PV (top two traces), but not SOM neurons (bottom two traces), exhibit strong post-inhibitory rebound burst firing upon hyperpolarization induced by −120 and −80 pA current pulses.
(B) Number of rebound LTS-type bursts. Data from 14 PV cells with burst and 12 SOM cells with burst.
(C) Number of action potentials on first rebound burst.
(D) Frequency of action potentials on first rebound burst.
(E) Average F–I curve obtained from 14 PV and 16 SOM cells.
(F) Representative traces of tonic firing from a PV and a SOM cell. Injected currents: 60 pA, top trace; 80 pA, second trace from top; 100 pA, second trace from bottom; and 120 pA, bottom trace.
(G) Representative traces showing T-type calcium current for PV and bursting SOM cells of the nRT. Inset: maximal T-currents normalized to the peak (t=0) to show similar decay kinetics.
(H) T-type current density, the maximal amplitude divided by the individual cell capacitance.
(I) T-current decay time constant.
(J) Normalized current amplitude plotted as a function of the pre-pulse membrane potential best-fitted with a Boltzmann function (R2 =0.99 for both fits).
(K) Half-maximal voltage (V50%) taken from Boltzmann function (data from 11 PV cells from 4 mice and 10 bursting SOM cells from 8 mice). All data represented as mean ± SEM, compared with a Mann-Whitney test and α=0.05. (*p<0.05, **p<0.01, ***p<0.001). See also Figures S2, S3 and Tables S1, S2.
Low-threshold calcium spikes
In all PV neurons (14 of 14 cells), a hyperpolarization to −95 mV or more was followed by a rebound of excitation characterized by a LTS crowned by a burst of APs. Of 14 PV neurons, 12 displayed repetitive rebound bursts and 2 produced single bursts (Figure 2A). Of 16 SOM neurons, 12 evoked a weak LTS after the same hyperpolarizing steps, and 4 did not evoke an LTS at all (Figure 2A).
We assessed the firing properties of these post-inhibitory rebound bursts. After similar responses to membrane potential hyperpolarizations, the maximal number of rebound bursts was threefold higher in PV than SOM neurons (Figure 2B). Also, the number of APs within the first burst and the intra-burst frequency of APs within the first burst were higher in PV than SOM neurons (Figure 2C–2D).
T-type calcium current
Next, we studied if differences in LTS and post-inhibitory rebound bursting were controlled by T-type calcium currents (Figure 2G–K). The peak T-current density was higher in PV neurons (Figure 2H) compared to SOM neurons with LTS burst. The voltage-dependence of the steady-state inactivation (SSI) of T-currents was similar in PV and SOM neurons (Figure 2J)—similar half-maximal SSI voltages (V50%) and decay time constants (Figures 2I and 2K)—suggesting that PV and SOM neurons have similar biophysical properties of T-currents. The differences in T-currents between PV and SOM neurons did not depend on the specific location of the neuron within the dorsal-ventral, anterior-posterior, or medio-lateral axes. Thus, small T-current produces the weaker post-inhibitory rebound LTS bursting in SOM neurons, suggesting that SOM neurons contain fewer and/or more dendritically located T-type calcium channels.
To further validate PV-Cre, we used “INTRSECT” mice (Fenno et al., 2014) in which we selectively expressed ChR2 with the combinatorial virus (Cre-On, Flp-Off) in PVCre/SOMFlp (PV*) mice. This approach expressed ChR2 in PV neurons that do not express SOM. We examined the electrophysiological properties of neurons and found that PV* and PV neurons have similar intrinsic membrane properties, including post-inhibitory rebound bursting and T-currents (Figure S6A–D).
Spontaneous synaptic activity
PV and SOM neurons had similar spontaneous excitatory and inhibitory postsynaptic currents (sEPSCs and sIPSCs) (Figure S3; Table S2).
PV and SOM Neurons of the nRT Project to Distinct Thalamocortical Relay Nuclei
To determine the post-synaptic targets of PV and SOM neurons, we injected virus containing enhanced Yellow Fluorescent Protein (eYFP) (Figures 3A,C,E) or ChR2-eYFP (Figures 3B,D,F) in the nRT of PV-Cre and SOM-Cre mice. nRT axons robustly expressed ChR2-eYFP 2–4 weeks post-injection, so we could activate axonal terminals while patching from thalamocortical relay cells in different nuclei. By evoking IPSCs, we verified that the projections observed with eYFP were functional. The major targets of PV neurons were the ventroposteromedial relay thalamic nuclei (VPM), ventroposterolateral (VPL) (Figure 3A,B left), and PO (Figure 3C,D left; see also Figure S4B). The major targets of SOM neurons were the intralaminar (IL) thalamocortical nuclei, in particular the parafascicular nucleus (PF) (Figure 3E,F right; see also Figure S4A), and to a lesser extent, the ventroposterolateral (VPL) (Figure 3A,B right) and the ventromedial (VM) thalamocortical relay nuclei. At high magnification, we saw axonal boutons and varicosities in the targeted structures (Figure 3 insets). The eIPSCs were recorded with kynurenic acid (2 mM) to block glutamatergic transmission and were abolished by the GABAA receptor blocker picrotoxin (data not shown). Patched cells were not directly activated, supporting that the opsin was not expressed in thalamocortical cells.
Figure 3. PV and SOM Neurons of the nRT Project to Distinct Thalamic Relay Nuclei.

(A,C,E) Examples of eYFP-labeled projections 4 weeks after eYFP injection into the middle nRT of PV-Cre (left) and SOM-Cre (right) mice observed at 20x. Inset, 100x image showing axonal varicosities (white arrowhead).
(B,D,F) Examples of eIPSCs recorded from thalamocortical relay cells 4 weeks after ChR2 injection into the middle nRT of PV-Cre (left) and SOM-Cre (right) mice (age of injection: P30). eIPSCs were evoked by placing optical fiber proximal to patched cell and activating 450 nm laser for 5 ms.
(A) Labeling showing eYFP expressing axons and axonal varicosities (inset) in VPL of both PV-Cre and SOM-Cre animals. Section imaged was located 1 mm posterior to Bregma.
(B) eIPSC were obtained from patching VPL cells in PV-Cre (cells with eIPSCs: 11/12) and SOM-Cre (cells with eIPSCs: 8/8) mice.
(C) Labeling showing eYFP-expressing axons and axonal varicosities (inset) in VPM of PV-Cre but not SOM-Cre animals. Section imaged was located 1 mm posterior to Bregma.
(D) eIPSC was obtained from patching VPM cells in PV-Cre (10/11 cells) but not SOM-Cre (0/12 cells) animals.
(E) Labeling showing eYFP expressing axons and axonal varicosities (inset) in PF/IL of SOM-Cre and but not PV-Cre animals. Section imaged was located 1 mm posterior to Bregma.
(F) eIPSC was obtained from patching PF/IL cells in SOM-Cre (8/11) but not PV-Cre (0/10) animals.
(G) Summary diagram showing location of recorded cells. Grey circles, cells from PV-Cre animals; black circles, cells from SOM-Cre animals; full circles, locations with eIPSCs; empty circles, locations without eIPSCs. Depicted images represent the expression pattern observed in seven injected PV-Cre and seven SOM-Cre animals. eIPSC recordings were obtained from three PV-Cre and three SOM-Cre animals. Injections of nRT all targeted “middle” nRT at 1.3 posterior from Bregma. eIPSC, evoked inhibitory postsynaptic currents; IL, intralaminar nuclei; PF, parafascicular, VPL, ventroposterolateral; VPM, ventroposteromedial. Large scale: 100 μm; inset scale: 10 μm. See also Figure S4.
Optical stimulation was specific to nRT cells. We validated that the virus specifically targeted the nRT by serially sectioning the brain and noting the eYFP somatic expression in all mice (Figure S4). We observed the same targets with different viral volumes (see Supplemental Experimental Procedures).
PV and SOM Neurons in the Human nRT
The development and organization of the primate thalamus, particularly the organization of the GABAergic system, are different from rodents (Jones, 2007). A whole brain study found SOM immunoreactivity in the human thalamus but provided no direct evidence of cell bodies or axons (Bouras et al., 1987), and the co-localization of SOM and PV neurons had not been examined. We immunostained postmortem human thalami (Figure 4) and found SOM neurons at both anterior (Figure 4A) and posterior levels (not shown), and at dorsal and ventral positions. We also found varicose SOM axons in human thalamic sections containing the higher-order thalamocortical relays, including the IL (Figure 4E), mediodorsal, anteroventral, ventral anterior, and midline nuclei (Figure 4D). Notably, we discovered a distinct SOM+PV- subpopulation in human nRT, similar to mice.
Figure 4. SOM cells in the Human nRT and SOM Projections to Higher-Order Thalamic Nuclei.

(A) Coronal section of the human thalamus at an anterior level (black arrowhead, nRT; small rectangles, position of the respective higher power images).
(B) SOM cells in the human nRT. Note the more scattered distribution of the neurons relative to the rodent condition due to the larger number of crossing fiber bundles.
(C) High-power images of SOM neurons displaying variable soma shape.
(D–E) Varicose SOM axons in the higher-order mediodorsal (D) and intralaminar (E) nuclei (black arrowheads).
(F–G) Some cells express only SOM (white arrowheads). SOM can co-localize with PV in certain nRT cells (asterisks). Scale bars: A, 1 mm; B, D–E, 50 μm; C, 25 μm; F–G, 20 μm. AV, anteroventral; IL, intralaminar; MD, midline; nRT, nuclear reticular thalamus; VA, ventral anterior thalamic nuclei.
Optical Activation of nRT PV but Not SOM Neurons Generates Oscillations in nRT-VB Microcircuit
Because PV neurons exhibit stronger intrinsic oscillatory properties than SOM neurons, we hypothesized that PV neurons are more likely to initiate network oscillations within the nRT-ventrobasal (VB) thalamic microcircuit. We used horizontal thalamic slices that conserve the connectivity between the nRT and VB thalamus (VB = VPM + VPL), in which we could assess nRT-VB intra-thalamic network oscillations independent of other structures (e.g., cortex) (Huntsman et al., 1999; Paz et al., 2011a, 2013; Makinson et al., 2017).
We measured intra-thalamic oscillations evoked by a single optical stimulation of PV or SOM neurons in slices prepared from PV-Cre or SOM-Cre mice expressing ChR2 (Figure 5). With an array, we recorded multi-unit (MU) activity within the nRT and VB thalamus (Figure 5A). Optical activation of PV neurons evoked rhythmic oscillatory bursting activity in VB (Figure 5B), similar to previous work using electrical stimulations of the internal capsule (Huntsman et al., 1999; Makinson et al., 2017; Paz et al., 2011a, 2013; Barthó et al., 2014). Activation of SOM cells in the nRT evoked firing in VPL but not in VPM (Figure 5B). The number of active channels in VB (with a circuit oscillation evoked by an optical stimulation of nRT) and evoked bursts was higher in PV- than SOM-stimulated slices (Figure 5C,D). Evoked oscillatory firing in VB resulted from circuit oscillations in nRT-VB-nRT loops rather than direct activation of VB cells with light, because the light did not induce direct firing in VB channels (Figure 5B) and the VB neurons did not express ChR2 (see above). Optical activation of either PV or SOM cells also evoked a similar instantaneous firing in the nRT (Figures 5B,E), suggesting that weaker VB firing in SOM-stimulated slices is not due to weaker activation of SOM compared with PV neurons.
Figure 5. Thalamic Circuit Oscillations Evoked by Activation of PV or SOM Neurons in Thalamic Slices.

(A) Schematic of setup for thalamic oscillation experiments. Multiunit (MU) array is placed across the nRT, ventrobasal (VB) thalamus, and midline nuclei (Mid. Nuc.). A 200 μm optic fiber was placed on the nRT, identified by its direct proximity to the white tracts of the internal capsule (i.c).
(B) Representative traces of thalamic oscillatory MU activity recorded in nRT and VB evoked by local optogenetic activation of nRT PV (top) or SOM (bottom) neurons in thalamic slices from P30–P40 PV-Cre and SOM-Cre mice. Instantaneous firing induced by optical stimulation was similar in PV and SOM mice (PV=385±73Hz, SOM=270±63Hz; p>0.5, Mann-Whitney test). Inset: autocorrolegrams derived from peristimulus time histograms for individual response observed in Ch5. Ch5 was chosen, because PV and SOM activation evoked a response in this channel for these slices. Blue line: autocorrelation calculated from data, Black line: smoothened autocorrelation to allow for easier visualization of oscillations.
(C) Quantification of number of active channels in VB with an evoked oscillatory response. Location of nRT and VB was visually verified for each recording.
(D) Number of total evoked bursts recorded in all VB channels. Data for C and D were analyzed from five sweeps obtained from four PV slices and five SOM slices from three animals per group.
(E) Representative rate meters showing the spike firing rate (10 ms bins) obtained from recordings shown in panel B. For clarity, only 1 s-long recordings and eight channels are shown. Channel 1 and Channels 2–8 depict firing rates in nRT and VB, respectively. Note that in PV slices (top), the evoked firing lasts longer and is observed in more channels compared with SOM (bottom) slices. Scale for normalized instantaneous frequency showed to the right of top rate meter that was generated using 10 ms bins. All data represented as mean ± SEM, compared with a Mann-Whitney test and α=0.05. (*p<0.05, **p<0.01, ***p<0.001).
These findings support that PV neurons are the main oscillation generators in the nRT-VB somatosensory circuit because PV nRT neurons can generate circuit oscillations in the nRT–VPL/VPM–nRT loop, while SOM nRT neurons can generate circuit oscillations in VB only via the nRT–VPL–nRT loop.
Retrograde Synaptic Labeling Unveils Distinct Inputs to PV and SOM nRT Neurons
To learn whether nRT PV and SOM cells receive projections from distinct brain regions, we used a modified rabies, trans-synaptic tracing strategy (Wall et al., 2010, 2013) in PV or SOM Cre–expressing mouse lines. The first injection contained Cre-dependent adeno-associated viruses (AAV) expressing the avian tumor virus receptor A (TVA) tagged with mCherry and the rabies glycoprotein (RG). The second contained a modified rabies virus (EnvA) and was injected 21 days after the first injection (Figure 6A), which allowed rabies to infect cells in a Cre-dependent manner and be retrogradely trafficked to label inputs onto nRT neurons (Wall et al., 2010, 2013). We report the proportions of input cells in Figure 6B, because our helper virus did not allow us to simultaneously visualize starter and input cells. Inputs were normalized across each animal to prevent mice with many labeled inputs from biasing total input proportion. Only inputs that were detected in at least three mice were included in the analysis. For SOM-Cre (n=3) and PV-Cre (n=5) animals, we detected 150±46 and 307±40 total input cells, respectively (p>0.5, Mann-Whitney test).
Figure 6. PV and SOM Neurons Receive Inputs from Distinct Brain Regions.

(A) Experimental design. SOM-Cre or PV-Cre mice were injected in the middle nRT (1.3 mm posterior to Bregma) with AAV expressing TVA-mCherry and rabies glycoprotein (RG) in a Cre-dependent manner at Day 0, and then with monosynaptic rabies virus (EnvA) containing eGFP that only infects cells expressing TVA and spreads retrogradely to presynaptic cells at day 21. Mice were perfused, and presynaptic populations were labeled with eGFP at day 28.
(B) Presynaptic projections at 0.8 mm posterior to Bregma onto SOM cells (left) and PV cells (right) at the anterior nuclei (AN) and somatosensory cortex (S1). Data are represented as mean ± SEM.
(C) Top panels show composite images of coronal sections at −0.46mm (left) and −1.2mm (middle) and −1.8mm posterior to Bregma show presynaptic projections onto nRT PV cells in S1: somatosensory cortex, VPM: ventroposteromedial relay thalamus, GPe: globus pallidus, nRT, and CeA: central amygdala. Bottom panels show individual high-magnification images from these sections; scale 200 μm.
(D) Top panels show composite images of coronal sections at −0.46mm (left) and and −1.4mm posterior to Bregma show presynaptic projections onto nRT SOM cells in GPe, nRT, and CeA. Bottom panels show individual high-magnification images from these sections; scale 200 μm. These results were observed consistently in three SOM-Cre and five PV-Cre mice. See also Figure S5.
We found distinct populations of afferent neurons targeting PV and SOM neurons in the nRT (Figures 6B–C). When targeting SOM nRT cells, presynaptic cells were labeled in VPL and anterior thalamic nuclei (AN) (Figure 6B). SOM cells also received input from extrathalamic sources, including the central amygdala (CeA) and basal ganglia [the external segment of globus pallidus (GPe)] (Figure 6C). When targeting PV nRT cells, we saw presynaptic labeling mainly in the VPM and S1 cortex (Figures 6B–C). We found a small number of input cells in GPe and none in CeA or AN when targeting PV cells (Figure 6C). We also found input cells in the nRT when targeting both PV and SOM cells, with SOM cells having significantly more input cells (Figure 6C), suggesting that dendro-denritic or axo-dendritic intra-nRT connections exist preferentially onto SOM cells.
These projections are not exhaustive (Jones, 2007), because the virus may not have infected all nRT cells across the medial-lateral, dorsal-ventral, and anterior-posterior axes. However, our results show that within the same nRT regions, SOM and PV neurons are targeted by different brain regions. Importantly, the starter cells infected with the TVA-mCherry virus were located specifically in the nRT (Figure S5). A subpopulation of VPM cells expresses PV, and larger volume injections in nRT led to viral expression in VPM (see Supplemental Methods), but this did not change the input cell location that was mainly restricted to S1BF.
PV Cells More Robustly Induce Sigma Oscillations in the S1 Cortex During Free Behavior
As PV and SOM neurons segregate into different input-output circuits, we asked whether they could differentially control cortical states during free behavior. We designed devices containing multiple electro-corticogram (ECoG) screws in the cortex and a chronic multi-site optrode in the nRT (Figure 7A). A single, unilateral 20 ms-long optical activation of PV neurons evoked higher frequency and more robust oscillations than SOM neurons, mainly in the 7–15 Hz sigma range (Figures 7B–E). Such stimulations of nRT were previously shown to produce 7–15 Hz sleep spindles in the cortex (Halassa et al., 2011), but the cellular subtype of the nRT spindle generator remained unknown.
Figure 7. Selective Optical Activation of PV and SOM Neurons in nRT Modulates Cortical Rhythms.

(B–E, M) Data collected from PV-Cre x Ai32 and SOM-Cre x Ai32 mice, age > P30.
(F–K) Data collected from PV-Cre and SOM-Cre mice that expressed ChR2 via viral injections in nRT.
(A) Diagram of recording and stimulation locations for in vivo experiments. Left: Approximate location of an optrode (i.e., optical fiber and two tungsten depth electrodes implanted unilaterally in the nRT. Right: Optrode and ECoG recording sites (S1, somatosensory cortex) and optrode on mouse skull.
(B) Representative wavelet time-frequency spectrograms and associated single-trial ECoG traces from ipsilateral S1 in PV (left) and SOM (right) mice. Blue rectangles indicate stimulation of ChR2-expressing PV or SOM neurons (unilateral, single, 20 ms-long light pulse, 450 nm).
(C) Representative ECoG traces from S1 cortex averaged per mouse (n=100–300 sweeps/trial). Blue line, stimulation of ChR2-expressing PV or SOM neurons (unilateral, single, 20 ms-long light pulse, 450 nm); black line, duration of oscillatory response in the ECoG.
(D) Mean ± SEM of frequency (Hz) and average number of cycles per stimulation (i.e., ECoG spikes); averages from ~200 trials per n=10 PV-Cre and 10 SOM mice, respectively. Mann-Whitney Rank Sum test: *p<0.05.
(E) Cumulative probability distribution of 7–15 Hz frequency in S1 ECoG, evoked by stimulation of nRT PV vs. SOM stimulation. ***p<0.001, two-sample KS test. (PV, 2309 events from n = 10 PV-Cre x Ai32 mice; SOM, 2003 events from n = 10 SOM-Cre x Ai32 mice).
(F, G) Representative wavelet time-frequency spectrograms and associated single-trial ECoG traces of optical stimulation during ongoing spike-and-wave seizures in PV (F) and SOM (G) mice. PFC, iS1 (ipsilateral S1), cS1 (contralateral S1), and ipsilateral V1 ECoG example traces are shown, as well as LFP and MU signals from nRT. Blue boxes indicate 4 s epoch of blue light stimulation (450 nm, 15–35 mW).
(H) Zoom of MU activity in the thalamus during ongoing spike-and-wave seizures in a PV- mouse. Blue-light mediated activation of ChR2 increases MU activity in thalamus that corresponds to decreased power in the ECoG (blue box).
(I) Individual cumulative probability distribution plots of the change in RMS power (post–pre) from a PV (grey) and SOM (black) mouse for all seizure interruption trials within one mouse (PV trials = 16, SOM trials = 12). Inset shows an example trace from a SOM in nRT. Light stimulation enhanced an ongoing seizure. *p<0.05, two-sample KS test.
(J) Population cumulative probability distribution plots of change in RMS power from PV (n = 4, grey) and SOM (n = 5, black) mice of all seizure interruption trials comparing RMS power 2 s before and after the stimulation. *p<0.05, two-sample KS test. Inset, mean ± SEM of change in RMS power shown in J. *p<0.05, Mann-Whitney Rank Sum.
(K) RMS power 2 s before and after light stimulation for PV (grey) and SOM (black) mice. *p<0.05, Mann-Whitney Rank Sum Test, n.s. p>0.1.
(M) Schematic of the adhesive removal task showing placement of tape contralateral to the optical stimulation of nRT and sequence of behavior during the task: 1) attachment of the tape to the left mystacial pad, 2) contact with tape, 3) and additional grooming of the mystacial area once tape is removed.
(N) Comparison of time (s) spent grooming after removing adhesive during sham, light stimulation, or light alone (not during adhesive removal task) between PV (n = 10) and SOM (n = 11) mice. Analysis with a two-way mixed-model ANOVA shows a significant effect of treatment F (3, 57) = 4.261, p = 0.0088, and no significant effects for genotype or interaction between genotype and treatment. Post hoc multiple comparison tests (Sidak’s, 6 comparisons per family) show a significant effect of treatment only in sham1 vs. light (*p<0.05) in the PV cohort. Note: PV and SOM mice performed comparably for contact and response time across all treatment conditions (data not shown). See also Figure S6.
We also determined if we could reproduce the major effects of PV activation on the ECoG in PV-Cre mice by activating only PV* cells in the nRT. Using the INTRSECT approach (Fenno et al., 2014), we selectively activated PV* cells in the nRT, which induced sigma-range oscillations in the S1 cortex (Figure S6 F–I) similar to that seen in PV-Cre mice.
PV but Not SOM Cells Affect Somatosensory-Related Whisker Behavior
Because PV cells more robustly modulate VPM and S1 cortical areas (Figures 5, 7), and because VPM is preferentially involved in whisker-related sensation, we hypothesized that PV cells would be preferentially involved in whisker-related behavior. With the adhesive-tape task (Bouet et al., 2009; Fleming et al., 2013), we tested whether disrupting the output of PV or SOM cells onto thalamocortical nuclei would alter somatosensory behavior. In PV-Cre-Ai32 and SOM-Cre-Ai32 mice, we placed adhesive tape on the left whiskers and manipulated the activity of PV or SOM cells in the right nRT that is functionally related to left-whisker perception. We manipulated the activity of ChR2-expressing PV or SOM cells with an optogenetic approach that has been established to disrupt thalamocortical output onto the cerebral cortex in a behavioral context (Reinhold et al., 2015). Activating PV but not SOM cells induced abnormal grooming of the whisker pad area that outlasted the optical stimulation protocol. Indeed, PV-targeted mice continued scratching the whisker pad area even after the tape was removed (Figure 7L, M). No such behavior was induced with light alone (Figure 7M), suggesting that manipulating nRT PV but not SOM neurons alters sensory perception in the mice during the task.
Optogenetic Targeting of PV but Not SOM Cells Instantaneously Disrupts Seizures
Given that nRT PV activation generates more robust oscillations in the cerebral cortex, we asked whether targeting these cells during seizures could effectively disrupt generalized cortical oscillations. We used low doses of pentylenetetrazol (PTZ), an established model of pharmacologically-induced generalized seizures mainly involving thalamocortical circuits (Beenhakker and Huguenard, 2009; Malafosee, 1994). We then used an optogenetic approach to selectively modulate PV or SOM nRT neurons during free behavior. Such optogenetic manipulations have been used to silence relay thalamocortical output and assess their effect on cortical states (Lewis et al., 2015). We found that a unilateral optical stimulation of nRT PV cells readily disrupted bilateral generalized seizures (Figure 7G,I,J,K) in PV-Cre mice injected with ChR2. We validated this result in PV* mice, in which targeting the PV+SOM- population immediately aborted ongoing seizures (Figure S6J-I). In contrast, activation of nRT SOM cells in SOM-Cre mice injected with ChR2 had much more stochastic effects on ongoing seizures (Figure 7H,I,J,K). The differences between PV and SOM mice did not result from differences in behavioral states (see Methods).
DISCUSSION
The distinct effects of PV and SOM neurons on circuits have been extensively studied in other brain structures (Kim et al., 2016; Phillips and Hasenstaub, 2016; Wilson et al., 2012), but not in the nRT. Our study is the first to assign cellular and circuit properties to neuron populations of the nRT that can be differentially targeted with distinct molecular markers. We also provide the first evidence that singly labeled PV and SOM neurons co-exist in the human nRT. In mice, we found that PV and SOM neurons have distinct electrophysiological properties, segregate into different anatomical locations across the nRT, and participate in predominantly non-overlapping anatomical pathways that distinctly modulate thalamocortical circuits both in vitro and in vivo.
Who are the best pacemakers for thalamocortical thythmogenesis?
The nRT needs LTS-mediated burst firing to generate spindle oscillatory activity in the thalamocortical circuit (Bazhenov et al., 2000; Beenhakker and Huguenard, 2009; Deschenes et al., 1984; Steriade et al., 1987). The nRT-VB loop is a key node of thalamocortical rhythm generation, because thalamocortical VB cells also fire LTS-mediated rebound bursts after hyperpolarization induced by nRT GABAergic inputs (Jahnsen and Llinás, 1984). We found that PV, but not SOM neurons, have large T-currents, are rhythmogenic and recruit more robust oscillatory spindle-like activity in the cortex, suggesting that PV neurons are the main spindle rhythm generators in thalamocortical circuits. We also found that unilateral optogenetic targeting of PV nRT cells disrupts generalized seizures, supporting that PV cells are preferentially involved in rhythmogenic thalamocortical circuits and could be “choke points” for seizure disruption (Paz and Huguenard, 2015). In contrast, targeting SOM cells can either interrupt or enhance seizures, suggesting a more nuanced effect on seizure rhythms. Thus, the PV nRT–VPM loop is the main pacemaking circuit in the somatosensory thalamus, in part because PV cells can fire more powerful rebound bursts and have more robust reciprocal connectivity with VPM neurons that are wired to oscillate in the sigma range. We propose that SOM nRT projections to the relay thalamus generate different global forebrain activity, which requires further studies.
Potential Roles of Biased Inputs-Outputs of PV and SOM nRT Neurons
Our major finding is that PV and SOM cells are embedded in distinct circuits: PV cells are mainly embedded in sensory circuits that involve inputs and outputs from specific thalamic nuclei (mainly VPM), whereas SOM cells are mainly embedded in circuits that involve non-specific thalamocortical relay nuclei (AN, IL, PF thalami) that have broader projections onto many cortical regions, including PFC (Saalmann, 2014). In previous work (Crabtree, 1992), somatosensory and intralaminar thalamic nuclei shared nRT input. Our results suggest that this input is mostly mediated by SOM neurons, because SOM but not PV neurons project onto the intralaminar nuclei in addition to VPL. Validating this hypothesis will require in vivo intracellular or juxtacellular biocytin labeling of SOM cells and a 3D reconstruction of their axonal projections. Although previous studies showed that S1 cortex and VPM thalamus are the main excitatory afferents to nRT (Crabtree, 1992; Lam and Sherman, 2011), our results identify that PV neurons are the cellular substrate in nRT that receive these inputs. Thus, PV nRT cells could be the main recipients of top-down cortical modulation of the thalamus and the main gatekeepers of somatosensory processing. Our finding that specifically manipulating PV cells induces excessive grooming after the tape was removed from the mouse’s whiskers suggests that PV neurons are the main cellular substrates in the nRT involved in whisker-related sensory perception and memory. We propose that SOM nRT neurons are less involved in whisker-sensory related behaviors, supporting a lack of projections onto VPM, which modulates the S1 barrel cortex. This result will motivate future studies on how SOM neurons affect behavior.
The cerebral cortex is thought to be the main excitatory afferent of the nRT (Williamson et al., 1993; Liu and Jones, 1999). Thus, our finding that, at least in the somatosensory nRT, S1 cortex exclusively targets PV and not SOM neurons, whereas subcortical structures preferentially target SOM cells, is novel. Our work suggests that the cortex is not the main modulator of a major subset of nRT neurons, and it urges the need to revise the framework of input analysis in the somatosensory corticothalamo-cortical circuits by including our findings that PV and SOM nRT cells differentially modulate information processing in these circuits.
What are the implications of preferential targeting of SOM nRT cells by limbic subcortical structures?
Although studies have shown that the basal nucleus (BM/BL) and cortical nuclei (Co) of the amygdala project onto the nRT in non-human primates (Zikopoulos and Barbas, 2012), our study is the first to show a projection from the CeA to the nRT in mice. nRT SOM cells receive inputs from CeA and AN that are involved in selective attention (Holland et al., 2000) and emotional-attention interactions (Sun et al., 2015), respectively. Based on these inputs, we speculate that nRT SOM cells are the cellular substrates that impart emotional salience to attention. Furthermore, because SOM cells in the somatosensory nRT mainly receive projections from subcortical structures and target non-specific intralaminar thalamic nuclei that modulate the PFC (Saalmann, 2014), we propose that SOM cells are preferentially involved in the bottom-up limbic modulation of cortical circuits. Altogether, these inputs-outputs position the nRT SOM cells as the cellular targets to probe the limbic nature of nRT-mediated behavior.
What are the implications of preferential targeting of SOM nRT cells by GPe?
Previous animal studies found that projections from the basal ganglia onto the nRT originate in the substantia nigra pars reticulata and GPe (Asanuma, 1989; Cornwall et al., 1990; Gandia et al., 1993; Hazrati and Parent, 1991; Jones, 2007). Our finding that GPe preferentially projects onto SOM cells in nRT suggests that SOM nRT cells could be central to communication between the basal ganglia and the thalamocortical relay nuclei. Thus, the GPe-SOM-TC pathway may affect behavioral switching and reward prediction (Gittis et al., 2014).
Technical Considerations
We studied PV and SOM neurons as they are the most abundantly expressed markers in rodent nRT (Lein et al., 2007). Future studies may include other neuron markers, such as neuropeptide Y (Brill et al., 2007), cholecystokinin (Cox et al., 1997), and vasoactive intestinal peptide (Burgunder et al., 1999).
The structure of the nRT does not support selective viral targeting, so we used multiple approaches to ensure targeting specificity. We showed that 1) in both AAV-eYFP and transynaptic rabies studies, our viral approach sufficiently targeted most cells in the nRT; 2) with large viral volumes, the virus spread to VB in PV-Cre mice but did not affect the results or data interpretation; and 3) the major electrophysiological features in vitro, and the major circuit oscillation and seizure disruption properties in vivo, were similar in transgenic PV-CrexAi32 and virally targeted PV-Cre and PV*ConFoff mice. Thus, our results are not specific to one Cre line and do not result from non-specific targeting of brain regions other than nRT.
nRT in Disease—A tale of two pathways?
Aberrant activity of the nRT affects many neurological and neuropsychiatric disorders (Paz et al., 2010; Slaght et al., 2002; Steriade, 2005; Ahrens et al., 2015; Ferrarelli and Tononi, 2011;Wells et al., 2016). We propose that PV cells generate rhythms that regulate sensory thalamocortical information processing, whereas SOM cells might gate limbic information and create informational salience. Within this framework, disruption of PV and SOM cells could lead to disorders with excessive rhythmogenesis (e.g., seizures) and psychiatric disorders (e.g., attention deficit disorder, schizophrenia), respectively. Our finding that pure, non-overlapping PV+SOM- and SOM+PV- cells co-exist in the human nRT supports these asymmetric roles.
Is There More than One Way to Pay Attention?
We propose that PV and SOM cells in the nRT might be differentially involved in top-down versus bottom-up thalamocortical information processing. Future work will evaluate whether these cell types interact within the nRT to integrate the different information needed for attention, consciousness, and perception. Also, the nRT—with its densely packed and perhaps interconnected PV and SOM cells—could be an ideal target to study the high co-morbidity between neurological and psychiatric disorders.
Finally, our results suggest that PV and SOM cells may mutually inhibit each other, providing another mechanism to tune what information the nRT, and in turn the thalamus, controls (Crick, 1984; Sohal et al., 2000).
Integrative brain functions require the flexible distribution of neuraly encoded information across large-scale brain circuits. Through its cellular subtypes, the nRT could differentially tune incoming information to coordinate brain-wide rhythms.
EXPERIMENTAL PROCEDURES
Animals
We performed all experiments per protocols approved by the Institutional Animal Care and Use Committee at the University of California, San Francisco and Gladstone Institutes. Precautions were taken to minimize stress and the number of animals used in all experiments. Adult (P30-P180) male and female mice were used. Somatostatin (SOM)-Cre mice (SOM-IRES-Cre, IMSR_JAX:013044; mixed C57BL/6;129S4), Parvalbumin (PV)-Cre mice (PV-Cre, IMSR_JAX: 017320; C57BL/6 congenic), Rosa26-tdTomato reporter mice (Ai14, IMSR_JAX:007914; congenic C57BL/6 generously provided by Dr. Ken Nakamura, Gladstone Institutes); Rosa26-ChR2(H134R)-EYFP reporter mice (Ai32, IMSR_JAX:012569; mixed C57BL/6;129S4), C57BL/6J mice (wild-type, IMSR_JAX:000664), and PV-Cre/SOM-Flp mice (PV-p2A-Cre, SOM-IRES-Flp (Fenno et al., 2014) were used.
Surgery
We performed stereotaxic injections of viruses into nRT as described (Paz et al., 2011, 2013). We targeted nRT with stereotaxic coordinates ranging from 1.3–1.6 mm posterior to Bregma and 2.0–2.1 mm lateral to the midline at two different injection depths (2.6 and 3.0 mm) ventral to the cortical surface. To determine the effects of PV or SOM neuron activation on cortical rhythms and behavior, we used PV-Ai32 and SOM-Ai32 mice, as well as PV-Cre, SOM-Cre, and PV-Cre/SOM-Flp mice previously injected with virus encoding ChR2, for simultaneous ECoG and thalamic LFP/MU recording combined with optical stimulation in nRT as described (Paz et al. 2011, Paz et al., 2013).
Immunostaining, Microscopy, and Image Analysis
Immunohistochemistry on mouse brain sections was performed as described (Paz et al., 2010). For human tissue staining, we used control human thalamic tissues (n=3) from two male subjects (55- and 77-years-old) and one female subject (77-years-old) who had no history of brain disorders. All procedures were approved by the Regional and Institutional Committee of Science and Research Ethics of Scientific Council of Health (ETT TUKEB 31443/2011/EKU (518/PI/11)). See Supplemental Experimental Procedures for detailed image acquisition parameters.
Electrophysiological recordings in slices
Acute slice electrophysiology was done as described (Paz et al., 2010, 2011b). For thalamic oscillation recordings, we used a linear multi-electrode array (Neuronexus). Evoked oscillations were elicited by activating PV or SOM neurons of the nRT by delivering 450 nm light (0.8–5 mW, 100 ms pulses) to nRT via a 200μm optical fiber (Thorlabs).
In Vivo Electrophysiology, Seizure Interruption, and Behavior
Electrophysiological recordings in freely-behaving mice were performed as described (Paz et al., 2013). We recorded ECoG and thalamic LFP/MU signals using an RZ5 (TDT). To evoke cortical rhythms, we delivered 8–20 mW of 450 nm light.
We used a low dose of pentylenetetrazol (PTZ, 35–60 mg/kg) injected intraperitoneally to induce seizures in mice. Experimenters visually monitored ECoG and thalamic LFP/MUA signal for spike-and-wave seizures and brief generalized spiking seizure episodes (<10 s). During seizures that were >1 s in length, experimenters triggered optical stimulation (4 s, 450 nm, 25–35 mW).
To assess whisker-related somatosensory behaviors, the same mice were subjected to a modification of the adhesive removal task behavior involving the front paws and whisker pad (Bouet et al., 2009) with and without optical manipulation of nRT.
Statistical Analyses
All numerical values are given as means and error bars are standard error of the mean (SEM) unless stated otherwise. Parametric and non-parametric tests were chosen as appropriate and were reported in figure legends. Data analysis was performed with MATLAB (SCR_001622), Origin 9.0 (Microcal Software, SCR_002815), GraphPad Prism 6 (SCR_002798), R-project, and SigmaPlot (SCR_003210). (*p<0.05, **p<0.01, ***p<0.001).
Detailed experimental procedures and statistical analyses for each experiment can be found in Supplemental Experimental Procedures.
Supplementary Material
HIGHLIGHTS.
nRT PV, but not SOM neurons exhibit intrinsic rhythmogenic properties
nRT PV and SOM neurons segregate into separate thalamocortical circuits
nRT PV and SOM neurons differentially modulate oscillations in somatosensory cortex
nRT PV cells are preferentially engaged in somatosensory behavior and seizures
Acknowledgments
J.T.P. is supported by NIH/NINDS R00NS078118, NIH/NINDS R01NS096369, Gladstone Institutes, Kavli Institute for Fundamental Neuroscience, Michael Prize, DoD EP150038, and NSF # 1608236. A.C.P and F.S.C. are supported by the National Science Foundation Graduate Research Fellowship Awards (NSF #1650113 and #1144247, respectively). S.S.H. is funded by the Achievement Rewards for College Scientists Scholarship. A.C.P, F.S.C., and S.S.H. are supported by NIH T32-GM007449 and the Weill Foundation. S.R.M. is supported by the American Epilepsy Society and the Dravet Syndrome Foundation Postdoctoral Research Fellowship. K.D and L.E.F. are supported by NIMH, NIDA, DARPA, and the Gatsby Foundation. C.D. and L.A. are supported by the National Research Development and Innovation Office (NKFI109754) and the Hungarian Brain Research Program (KTIA_13_NAP-A-I/1). We thank the Department of Pathology, Saint Borbála Hospital, Tatabánya at the Human Brain Research lab, and IEM HAS for providing human brain tissue. We thank John Huguenard and Jordan Sorokin for the custom Matlab software for thalamic oscillation analysis in vitro, and Meredith Calvert of the Gladstone Histology & Light Microscopy Core for help with confocal microscopy and cell counting. Thanks to Gary Howard and Crystal Herron for their insightful feedback on the manuscript.
Footnotes
Author Contributions:
Conceptualization, A.C.P. and J.T.P.; Investigation, A.C.P., S.R.M., B.H., A.U., S.B., L.A., C.D.; Data analysis: A.C.P, S.R.M., B.H., F.S.C., M.W., A.U., J.T.P. Writing – Original Draft, A.C.P., and J.T.P.; Writing – Review and Editing, A.C.P., S.R.M., F.S.C., S.S.H., B.H., L.A. and J.T.P., Funding Acquisition, A.C.P and J.T.P.; Resources, L.E.F. and K.D (provided INTERSCT mice); Supervision: J.T.P.
Publisher's Disclaimer: This is a PDF file of an unedited manuscript that has been accepted for publication. As a service to our customers we are providing this early version of the manuscript. The manuscript will undergo copyediting, typesetting, and review of the resulting proof before it is published in its final citable form. Please note that during the production process errors may be discovered which could affect the content, and all legal disclaimers that apply to the journal pertain.
References
- Ahrens S, Jaramillo S, Yu K, Ghosh S, Hwang GR, Paik R, Lai C, He M, Huang ZJ, Li B. ErbB4 regulation of a thalamic reticular nucleus circuit for sensory selection. Nat Neurosci. 2015;18:104–111. doi: 10.1038/nn.3897. [DOI] [PMC free article] [PubMed] [Google Scholar]
- Asanuma C. Axonal arborizations of a magnocellular basal nucleus input and their relation to the neurons in the thalamic reticular nucleus of rats. Proc Natl Acad Sci U S A. 1989;86:4746–4750. doi: 10.1073/pnas.86.12.4746. [DOI] [PMC free article] [PubMed] [Google Scholar]
- Barthó P, Slézia A, Mátyás F, Faradzs-Zade L, Ulbert I, Harris KD, Acsády L. Ongoing Network State Controls the Length of Sleep Spindles via Inhibitory Activity. Neuron. 2014;82:1367–1379. doi: 10.1016/j.neuron.2014.04.046. [DOI] [PMC free article] [PubMed] [Google Scholar]
- Bazhenov M, Timofeev I, Steriade M, Sejnowski T. Spiking-Bursting Activity in the Thalamic Reticular Nucleus Initiates Sequences of Spindle Oscillations in Thalamic Networks. J Neurophysiol. 2000;84:1076. doi: 10.1152/jn.2000.84.2.1076. [DOI] [PubMed] [Google Scholar]
- Beenhakker MP, Huguenard JR. Neurons that Fire Together Also Conspire Together: Is Normal Sleep Circuitry Hijacked to Generate Epilepsy? Neuron. 2009;62:612–632. doi: 10.1016/j.neuron.2009.05.015. [DOI] [PMC free article] [PubMed] [Google Scholar]
- Bouet V, Boulouard M, Toutain J, Divoux D, Bernaudin M, Schumann-Bard P, Freret T. The adhesive removal test: a sensitive method to assess sensorimotor deficits in mice. Nat Protoc. 2009;4:1560–1564. doi: 10.1038/nprot.2009.125. [DOI] [PubMed] [Google Scholar]
- Brill J, Kwakye G, Huguenard JR. NPY signaling through Y1 receptors modulates thalamic oscillations. NPY COHORTS Hum Dis 8th Int NPY Meet; 2006; 2007. pp. 250–256. [DOI] [PMC free article] [PubMed] [Google Scholar]
- Burgunder JM, Heyberger B, Lauterburg T. Thalamic reticular nucleus parcellation delineated by VIP and TRH gene expression in the rat. J Chem Neuroanat. 1999;17:147–152. doi: 10.1016/s0891-0618(99)00033-2. [DOI] [PubMed] [Google Scholar]
- Calabrò RS, Cacciola A, Bramanti P, Milardi D. Neural correlates of consciousness: what we know and what we have to learn! Neurol. Sci. 2015;36:505–513. doi: 10.1007/s10072-015-2072-x. [DOI] [PubMed] [Google Scholar]
- Contreras D, Curro Dossi R, Steriade M. Bursting and tonic discharges in two classes of reticular thalamic neurons. J Neurophysiol. 1992;68:973. doi: 10.1152/jn.1992.68.3.973. [DOI] [PubMed] [Google Scholar]
- Cornwall J, Cooper J, Phillipson O. Projections to the rostral reticular thalamic nucleus in the rat. Exp Brain Res. 1990;80:157–171. doi: 10.1007/BF00228857. [DOI] [PubMed] [Google Scholar]
- Cox CL, Huguenard JR, Prince DA. Peptidergic Modulation of Intrathalamic Circuit Activity In Vitro: Actions of Cholecystokinin. J Neurosci. 1997;17:70. doi: 10.1523/JNEUROSCI.17-01-00070.1997. [DOI] [PMC free article] [PubMed] [Google Scholar]
- Crabtree JW. The Somatotopic Organization Within the Cat’s Thalamic Reticular Nucleus. Eur J Neurosci. 1992;4:1352–1361. doi: 10.1111/j.1460-9568.1992.tb00160.x. [DOI] [PubMed] [Google Scholar]
- Crick F. Function of the thalamic reticular complex: the searchlight hypothesis. Proc Natl Acad Sci. 1984;81:4586–4590. doi: 10.1073/pnas.81.14.4586. [DOI] [PMC free article] [PubMed] [Google Scholar]
- Csillik B, Mihály A, Krisztin-Péva B, Chadaide Z, Samsam M, Knyihár-Csillik E, Fenyo R. GABAergic parvalbumin-immunoreactive large calyciform presynaptic complexes in the reticular nucleus of the rat thalamus. J Chem Neuroanat. 2005;30:17–26. doi: 10.1016/j.jchemneu.2005.03.010. [DOI] [PubMed] [Google Scholar]
- Dang-Vu TT, McKinney SM, Buxton OM, Solet JM, Ellenbogen JM. Spontaneous brain rhythms predict sleep stability in the face of noise. Curr Biol. 2010;20:R626–R627. doi: 10.1016/j.cub.2010.06.032. [DOI] [PubMed] [Google Scholar]
- Deschenes M, Paradis M, Roy JP, Steriade M. Electrophysiology of neurons of lateral thalamic nuclei in cat: resting properties and burst discharges. J Neurophysiol. 1984;51:1196. doi: 10.1152/jn.1984.51.6.1196. [DOI] [PubMed] [Google Scholar]
- Fenno LE, Mattis J, Ramakrishnan C, Hyun M, Lee SY, He M, Tucciarone J, Selimbeyoglu A, Berndt A, Grosenick L, et al. Targeting cells with single vectors using multiple-feature Boolean logic. Nat Meth. 2014;11:763–772. doi: 10.1038/nmeth.2996. [DOI] [PMC free article] [PubMed] [Google Scholar]
- Ferrarelli F, Tononi G. The Thalamic Reticular Nucleus and Schizophrenia. Schizophr Bull. 2011;37:306–315. doi: 10.1093/schbul/sbq142. [DOI] [PMC free article] [PubMed] [Google Scholar]
- Fleming SM, Ekhator OR, Ghisays V. Assessment of Sensorimotor Function in Mouse Models of Parkinson’s Disease. 2013:e50303. doi: 10.3791/50303. [DOI] [PMC free article] [PubMed] [Google Scholar]
- Gandia J, De las Heras S, Gimenez-Amaya J. Afferent projections to the reticular thalamic nucleus from the globus pallidus and the substantia nigra in the rat. Brain Res Bull. 1993;4:351–358. doi: 10.1016/0361-9230(93)90199-l. [DOI] [PubMed] [Google Scholar]
- Gentet LJ, Ulrich D. Strong, reliable and precise synaptic connections between thalamic relay cells and neurones of the nucleus reticularis in juvenile rats. J Physiol. 2003;546:801–811. doi: 10.1113/jphysiol.2002.032730. [DOI] [PMC free article] [PubMed] [Google Scholar]
- Gittis AH, Berke JD, Bevan MD, Chan CS, Mallet N, Morrow MM, Schmidt R. New Roles for the External Globus Pallidus in Basal Ganglia Circuits and Behavior. J Neurosci. 2014;34:15178. doi: 10.1523/JNEUROSCI.3252-14.2014. [DOI] [PMC free article] [PubMed] [Google Scholar]
- Halassa MM, Acsády L. Thalamic Inhibition: Diverse Sources, Diverse Scales. Trends Neurosci. 2016;39:680–693. doi: 10.1016/j.tins.2016.08.001. [DOI] [PMC free article] [PubMed] [Google Scholar]
- Halassa MM, Siegle JH, Ritt JT, Ting JT, Feng G, Moore CI. Selective optical drive of thalamic reticular nucleus generates thalamic bursts and cortical spindles. Nat Neurosci. 2011;14:1118–1120. doi: 10.1038/nn.2880. [DOI] [PMC free article] [PubMed] [Google Scholar]
- Halassa MM, Chen Z, Wimmer RD, Brunetti PM, Zhao S, Zikopoulos B, Wang F, Brown EN, Wilson MA. State-Dependent Architecture of Thalamic Reticular Subnetworks. Cell. 2014;158:808–821. doi: 10.1016/j.cell.2014.06.025. [DOI] [PMC free article] [PubMed] [Google Scholar]
- Hazrati LN, Parent A. Projection from the external pallidum to the reticular thalamic nucleus in the squirrel monkey. Brain Res. 1991;550:142–146. doi: 10.1016/0006-8993(91)90418-u. [DOI] [PubMed] [Google Scholar]
- Hou G, Smith AG, Zhang ZW. Lack of Intrinsic GABAergic Connections in the Thalamic Reticular Nucleus of the Mouse. J Neurosci. 2016;36:7246. doi: 10.1523/JNEUROSCI.0607-16.2016. [DOI] [PMC free article] [PubMed] [Google Scholar]
- Houser CR, Vaughn JE, Barber RP, Roberts E. GABA neurons are the major cell type of the nucleus reticularis thalami. Brain Res. 1980;200:341–354. doi: 10.1016/0006-8993(80)90925-7. [DOI] [PubMed] [Google Scholar]
- Huntsman MM, Porcello DM, Homanics GE, DeLorey TM, Huguenard JR. Reciprocal Inhibitory Connections and Network Synchrony in the Mammalian Thalamus. Science. 1999;283:541. doi: 10.1126/science.283.5401.541. [DOI] [PubMed] [Google Scholar]
- Jahnsen H, Llinás R. Electrophysiological properties of guinea-pig thalamic neurones: an in vitro study. J Physiol. 1984;349:205–226. doi: 10.1113/jphysiol.1984.sp015153. [DOI] [PMC free article] [PubMed] [Google Scholar]
- Jones EG. The Thalamus 2 Volume Set. Cambridge University Press; 2007. [Google Scholar]
- Jones EG, Hendry SHC. Differential Calcium Binding Protein Immunoreactivity Distinguishes Classes of Relay Neurons in Monkey Thalamic Nuclei. Eur J Neurosci. 1989;1:222–246. doi: 10.1111/j.1460-9568.1989.tb00791.x. [DOI] [PubMed] [Google Scholar]
- Kim D, Jeong H, Lee J, Ghim JW, Her ES, Lee SH, Jung MW. Distinct Roles of Parvalbumin- and Somatostatin-Expressing Interneurons in Working Memory. Neuron. 2016;92:902–915. doi: 10.1016/j.neuron.2016.09.023. [DOI] [PubMed] [Google Scholar]
- Lam YW, Sherman SM. Functional Organization of the Thalamic Input to the Thalamic Reticular Nucleus. J Neurosci. 2011;31:6791. doi: 10.1523/JNEUROSCI.3073-10.2011. [DOI] [PMC free article] [PubMed] [Google Scholar]
- Lee SH, Govindaiah G, Cox CL. Heterogeneity of firing properties among rat thalamic reticular nucleus neurons. J Physiol. 2007;582:195–208. doi: 10.1113/jphysiol.2007.134254. [DOI] [PMC free article] [PubMed] [Google Scholar]
- Lein ES, Hawrylycz MJ, Ao N, Ayres M, Bensinger A, Bernard A, Boe AF, Boguski MS, Brockway KS, Byrnes EJ, et al. Genome-wide atlas of gene expression in the adult mouse brain. Nature. 2007;445:168–176. doi: 10.1038/nature05453. [DOI] [PubMed] [Google Scholar]
- Lewis LD, Voigts J, Flores FJ, Schmitt LI, Wilson MA, Halassa MM, Brown EN. Thalamic reticular nucleus induces fast and local modulation of arousal state. eLife. 2015;4:e08760. doi: 10.7554/eLife.08760. [DOI] [PMC free article] [PubMed] [Google Scholar]
- Liu XB, Jones EG. Predominance of corticothalamic synaptic inputs to thalamic reticular nucleus neurons in the rat. J Comp Neurol. 1999;414:67–79. [PubMed] [Google Scholar]
- Macdonald KD, Fifkova E, Jones MS, Barth DS. Focal Stimulation of the Thalamic Reticular Nucleus Induces Focal Gamma Waves in Cortex. J Neurophysiol. 1998;79:474. doi: 10.1152/jn.1998.79.1.474. [DOI] [PubMed] [Google Scholar]
- Makinson CD, Tanaka BS, Sorokin JM, Wong JC, Christian CA, Goldin AL, Escayg A, Huguenard JR. Regulation of Thalamic and Cortical Network Synchrony by Scn8a. Neuron. 2017;93:1165–1179. e6. doi: 10.1016/j.neuron.2017.01.031. [DOI] [PMC free article] [PubMed] [Google Scholar]
- Malafosee A. Idiopathic Generalized Epilepsies: Clinical, Experimental and Genetic Aspects. Libbey: John & Company, Limited; 1994. Thalamocortical rhythm generation in vitro; p. 129. [Google Scholar]
- Paz JT, Huguenard JR. Microcircuits and their interactions in epilepsy: is the focus out of focus? Nat Neurosci. 2015;18:351–359. doi: 10.1038/nn.3950. [DOI] [PMC free article] [PubMed] [Google Scholar]
- Paz JT, Christian CA, Parada I, Prince DA, Huguenard JR. Focal Cortical Infarcts Alter Intrinsic Excitability and Synaptic Excitation in the Reticular Thalamic Nucleus. J Neurosci. 2010;30:5465. doi: 10.1523/JNEUROSCI.5083-09.2010. [DOI] [PMC free article] [PubMed] [Google Scholar]
- Paz JT, Bryant AS, Peng K, Fenno L, Yizhar O, Frankel WN, Deisseroth K, Huguenard JR. A new mode of corticothalamic transmission revealed in the Gria4(−/−) model of absence epilepsy. Nat Neurosci. 2011b;14:1167–1173. doi: 10.1038/nn.2896. [DOI] [PMC free article] [PubMed] [Google Scholar]
- Paz JT, Davidson T, Freschette E, Delord B, Prada I, Peng K, Deisseroth K, Huguenard JR. Closed-loop optogenetic control of thalamus as a new tool to interrupt seizures after cortical injury. Nat Neurosci. 2013;16:64–70. doi: 10.1038/nn.3269. [DOI] [PMC free article] [PubMed] [Google Scholar]
- Phillips EA, Hasenstaub AR. Asymmetric effects of activating and inactivating cortical interneurons. eLife. 2016;5:e18383. doi: 10.7554/eLife.18383. [DOI] [PMC free article] [PubMed] [Google Scholar]
- Pinault D, Deschênes M. Projection and Innervation Patterns of Individual Thalamic Reticular Axons in the Thalamus of the Adult Rat: A Three-dimensional, Graphic, and Morphometric Analysis. J Comp Neurol. 1998;2:180–203. doi: 10.1002/(sici)1096-9861(19980209)391:2<180::aid-cne3>3.0.co;2-z. [DOI] [PubMed] [Google Scholar]
- Reinhold K, Lien AD, Scanziani M. Distinct recurrent versus afferent dynamics in cortical visual processing. Nat Neurosci. 2015;18:1789–1797. doi: 10.1038/nn.4153. [DOI] [PubMed] [Google Scholar]
- Saalmann YB. Intralaminar and medial thalamic influence on cortical synchrony, information transmission and cognition. Front Syst Neurosci. 2014;8:83. doi: 10.3389/fnsys.2014.00083. [DOI] [PMC free article] [PubMed] [Google Scholar]
- Sherman SM. A wake-up call from the thalamus. Nat Neurosci. 2001a;4:344–346. doi: 10.1038/85973. [DOI] [PubMed] [Google Scholar]
- Sherman SM. Tonic and burst firing: dual modes of thalamocortical relay. Trends Neurosci. 2001b;24:122–126. doi: 10.1016/s0166-2236(00)01714-8. [DOI] [PubMed] [Google Scholar]
- Slaght SJ, Leresche N, Deniau JM, Crunelli V, Charpier S. Activity of Thalamic Reticular Neurons during Spontaneous Genetically Determined Spike and Wave Discharges. J Neurosci. 2002;22:2323. doi: 10.1523/JNEUROSCI.22-06-02323.2002. [DOI] [PMC free article] [PubMed] [Google Scholar]
- Sohal VS, Huntsman MM, Huguenard JR. Reciprocal Inhibitory Connections Regulate the Spatiotemporal Properties of Intrathalamic Oscillations. J Neurosci. 2000;20:1735. doi: 10.1523/JNEUROSCI.20-05-01735.2000. [DOI] [PMC free article] [PubMed] [Google Scholar]
- Sohal VS, Zhang F, Yizhar O, Deisseroth K. Parvalbumin neurons and gamma rhythms enhance cortical circuit performance. Nature. 2009;459:698–702. doi: 10.1038/nature07991. [DOI] [PMC free article] [PubMed] [Google Scholar]
- Steriade M. Sleep, epilepsy and thalamic reticular inhibitory neurons. INMEDTINS Spec Issue Mult Facets GABAergic Synap. 2005;28:317–324. doi: 10.1016/j.tins.2005.03.007. [DOI] [PubMed] [Google Scholar]
- Steriade M, Domich L, Oakson G, Deschenes M. The deafferented reticular thalamic nucleus generates spindle rhythmicity. J Neurophysiol. 1987;57:260. doi: 10.1152/jn.1987.57.1.260. [DOI] [PubMed] [Google Scholar]
- Wall NR, Wickersham IR, Cetin A, De La Parra M, Callaway EM. Monosynaptic circuit tracing in vivo through Cre-dependent targeting and complementation of modified rabies virus. Proc Natl Acad Sci. 2010;107:21848–21853. doi: 10.1073/pnas.1011756107. [DOI] [PMC free article] [PubMed] [Google Scholar]
- Wall NR, De La Parra M, Callaway EM, Kreitzer AC. Differential innervation of direct- and indirect-pathway striatal projection neurons. Neuron. 2013;79:347–360. doi: 10.1016/j.neuron.2013.05.014. [DOI] [PMC free article] [PubMed] [Google Scholar]
- Wells MF, Wimmer RD, Schmitt LI, Feng G, Halassa MM. Thalamic reticular impairment underlies attention deficit in Ptchd1Y/– mice. Nature. 2016;532:58–63. doi: 10.1038/nature17427. [DOI] [PMC free article] [PubMed] [Google Scholar]
- Williamson AM, Ohara PT, Ralston HJ., III Electron microscopic evidence that cortical terminals make direct contact onto cells of the thalamic reticular nucleus in the monkey. Brain Res. 1993;631:175–179. doi: 10.1016/0006-8993(93)91207-9. [DOI] [PubMed] [Google Scholar]
- Wilson NR, Runyan CA, Wang FL, Sur M. Division and subtraction by distinct cortical inhibitory networks in vivo. Nature. 2012;488:343–348. doi: 10.1038/nature11347. [DOI] [PMC free article] [PubMed] [Google Scholar]
- Zhang ZW, Zak JD, Liu H. MeCP2 Is Required for Normal Development of GABAergic Circuits in the Thalamus. J Neurophysiol. 2010;103:2470. doi: 10.1152/jn.00601.2009. [DOI] [PMC free article] [PubMed] [Google Scholar]
- Zikopoulos B, Barbas H. Pathways for Emotions and Attention Converge on the Thalamic Reticular Nucleus in Primates. J Neurosci. 2012;32:5338. doi: 10.1523/JNEUROSCI.4793-11.2012. [DOI] [PMC free article] [PubMed] [Google Scholar]
Associated Data
This section collects any data citations, data availability statements, or supplementary materials included in this article.