

Abstract
Purpose
To investigate the long-term longitudinal profile of retinal ganglion cell (RGC) damage after optic nerve crush with a new technique for in vivo imaging of RGCs.
Methods
A blue-light confocal scanning laser ophthalmoscope (bCSLO; 460 nm excitation, 490 nm detection) was used to image Thy-1 CFP mice aged 6 to 9 months (n = 5) before optic nerve crush, weekly after crush for 3 weeks, and at weeks 10 and 50 after optic nerve crush. A sham procedure was performed in the contralateral eye, and it was imaged as a control. Corresponding retinal areas before and after optic nerve crush were compared, and the fluorescent spots were counted manually. The longitudinal profile of RGC degeneration was modeled and compared with one-phase and two-phase exponential decay equations.
Results
A significant and progressive loss of fluorescent spots was found after optic nerve crush with 18.6% ± 2.3%, 11.3% ± 3.4%, 8.8% ± 5.3%, 4.2% ± 3.1%, and 3.3% ± 2.1% of Thy-1-expressing RGCs remaining at weeks 1, 2, 3, 10, and 50, respectively, after optic nerve crush (P < 0.001; n = 5). There was no change in the fluorescence density in the contralateral control (P = 0.893). Two-phase exponential decay (y = 0.03 + 0.83e−2.78t + 0.14e−0.30t) was a better fit than one-phase exponential decay (y = 0.94e−1.93t + 0.06; P = 0.003) equations, with half-lives of fast phase and slow phase of 1.7 days and 16.3 days, respectively.
Conclusions
The longitudinal profile of RGC degeneration after optic nerve crush is characterized by a two-phase exponential decay model. bCSLO imaging provides an efficient and noninvasive approach to the longitudinal study of progressive RGC damage.
Experimental investigation of progressive retinal ganglion cell (RGC) degeneration has been obfuscated by the lack of a suitable model that can monitor individual RGCs longitudinally and noninvasively. Assessment of RGC integrity has been largely based on a single time point measurement when the animals were killed. Methods based on cell counting may underestimate the degree of neuronal injury, whereas molecular analysis of neuronal proteins or mRNA from tissue extracts fails to provide spatial information on the distribution of the damage. Because of the presence of clear optical media in the eye, in vivo imaging of RGCs represents a unique approach to study RGC degeneration. We have developed a confocal scanning laser ophthalmoscope (blue-light CSLO or bCSLO) to visualize the expression of Thy-1 in RGCs.1 This is achieved through study of a strain of transgenic mice expressing cyan fluorescent protein (CFP) under the control of Thy-1 promoter. Thy-1 is a cell-surface glycoprotein expressed by the projection neurons in many parts of the nervous system.2 In the retina, it is largely expressed in the RGCs.3 It has been shown that assessment of Thy-1 expression provides a useful index of RGC damage.4–7 Monitoring Thy-1 expression in RGCs thereby provides a unique opportunity to study the integrity of RGCs. The purpose of this study was to examine the feasibility of using the technique of bCSLO imaging for serial long-term monitoring of RGCs. Using optic nerve crush injury as a model to induce RGC death, we investigated the longitudinal profile of progressive RGC degeneration in vivo. This information is essential to investigate the mechanisms of RGC degeneration and to study the therapeutic potential of neuroprotective agents.
Materials and Methods
Blue-Light Confocal Scanning Laser Ophthalmoscope Imaging
The methods of bCSLO imaging have been described1 and were modified to visualize cyan fluorescent protein (460 nm excitation, 490 nm detection). During imaging with the bCSLO, the mice were held steady by an assistant. Pupils were dilated with topical mydriatic agents (tropicamide and phenylephrine, 0.5% each) to approximately 2 mm in diameter. Imaging was noninvasive and involved no contact. No anesthesia was required. The scan rate of the modified CSLO is 12 frames per second, with a resolution of 512 × 512 pixels at each frame. Corresponding retinal areas of approximately 2 mm2, in which the cells were in focus before and after optic nerve crush, were compared. Manual counting of the fluorescent spots was performed directly from the bCSLO images enlarged to a final magnification of 1280×.
Experimental Animals
Animals used in this study were treated in accordance with the ARVO Statement for the Use of Animals in Ophthalmic and Vision Research. Transgenic mice in which Thy-1 promoter sequences drive expression of the enhanced cyan fluorescent protein (CFP), designated B6.Cg-TgN (Thy1-CFP) 23Jrs, were generated by Feng et al.8 Breeding pairs of Thy-1 CFP mice were obtained from the Jackson Laboratory (Bar Harbor, ME). The environment was kept at 21°C with a 12-hour light/12-hour dark cycle. All mice were fed ad libitum.
Optic Nerve Crush
The optic nerve was crushed according to the method developed by Li et al.9 with minor modification. Six- to 9-month-old Thy-1 CFP mice were anesthetized by intraperitoneal injection of ketamine and xylazine, as described. Limbal conjunctival peritomy was performed in the temporal region and was gently peeled back to allow access to the posterior region of the globe. The optic nerve was then exposed through a small window made between the surrounding muscle bundles and fatty tissue by gentle blunt dissection. Care was taken not to damage muscles or the blood vessels. At a site approximately 1 mm posterior to the globe, the optic nerve was clamped using a pair of self-closing tweezers (Dumant No. 5; Ted Pella Inc., Redding, CA) for 2 to 3 seconds. After this procedure, antibiotic ointment was applied to the surgical site. In the postoperative period, mice exhibited normal eating and drinking behavior. Sham procedures, exposing the optic nerve without crush, were performed in contralateral eyes, which served as controls.
Fluorescein Angiography
To confirm retinal blood flow was intact after the optic nerve crush, fluorescein angiography imaging was performed. Fluorescein injection was administered intraperitoneally (20 μL of 10% sodium fluorescein). Mice were manually held in front of the bCSLO with the same technique as in RGC imaging. Major retinal vessels and fine detail of the capillary plexus were visualized 5 to 10 seconds after the injection.
Fluorescence Microscopy
Mice were anesthetized with intraperitoneal pentobarbital sodium (100 mg/kg, Nembutal; Abbott Laboratories, North Chicago, IL) and were exsanguinated by perfusion with oxygenated mammalian Ringer solution containing lidocaine hydrochloride (0.1 mg/mL, Xylocaine; Astra USA, Inc., Westborough, MA) and heparin sodium (500 U/mL, Heparin; Elkins-Sinn, Inc., Cherry Hill, NJ). Transcardial perfusion was then continued with fixative (approximately 20 mL of 4.0% paraformaldehyde in 0.1 M phosphate buffer at pH 7.4). Retinas were dissected after the inferior area of the retina was identified by the inferior position of the ophthalmic artery. They were placed in fixative for 3 hours, rinsed in 0.1 M phosphate buffer, and mounted flat on a glass slide. A coverslip was mounted using antifade media (Fluoromount G; Southern Biotechnology, Birmingham, AL). Optic nerve axons and RGCs were imaged at 10× magnification by fluorescence microscopy and photographed using a cooled digital camera (SPOT Digital Camera System; Diagnostic Instruments, Sterling Heights, MI). Areas were identified and circumscribed in which the cells were in focus (typically greater than 40% of the total micrograph area).
Statistical Analysis
Relative densities (percentages) of fluorescent spots in corresponding retinal areas were calculated before and after the optic nerve crush. The Friedman test was used to evaluate the differences of surviving RGCs after the optic nerve crush. The longitudinal profile of RGC degeneration after optic nerve crush was fit with one-phase and two-phase exponential decay models. In the exponential decay model, the rate of RGC degeneration was proportional to the amount left. A two-phase exponential decay model was used to assess whether the rate of RGC degeneration could be the result of the sum of fast and slow exponential decay. One-phase and two-phase models were compared with the extra sum-of-square F test. The F ratio is calculated by comparing the relative difference in the sum-of-square to the relative difference in the degree of freedoms of two nested (related) models. When comparing one-phase exponential decay (the simpler model A) and two-phase exponential decay (the more complicated model B),
| (1) |
where SSA and SSB were the sum-of-squares and DFA and DFB were the degrees of freedom of models A and B, respectively. A P value was then computed based on the F ratio. The hypothesis was to test whether the two-phase exponential decay model is better fit than the one-phase exponential decay model. In all the analyses, P < 0.05 was considered statistically significant.
Results
In Vivo Visualization of Retinal Ganglion Cells and Retinal Vasculature
RGC degeneration was induced by crushing the optic nerve while maintaining retinal microcirculation. Figure 1 demonstrates the retinal montages of bCSLO images of Thy-1 CFP- expressing RGCs and fluorescein angiography in a mouse eye after optic nerve crush. Each of the fluorescent spots represents the remaining Thy-1 CFP-expressing RGCs 50 weeks after optic nerve crush. The retinal vessels and the capillary plexus were visualized in the fluorescein angiography image. There was no area of capillary nonperfusion or vascular leakage indicative of retinal ischemia in any of eyes after optic nerve crush (n = 5). Fluorescent spots observed in the bCSLO images were in correspondence to those in the fluorescence microscopy images obtained from retinal flat mounts.
Figure 1.
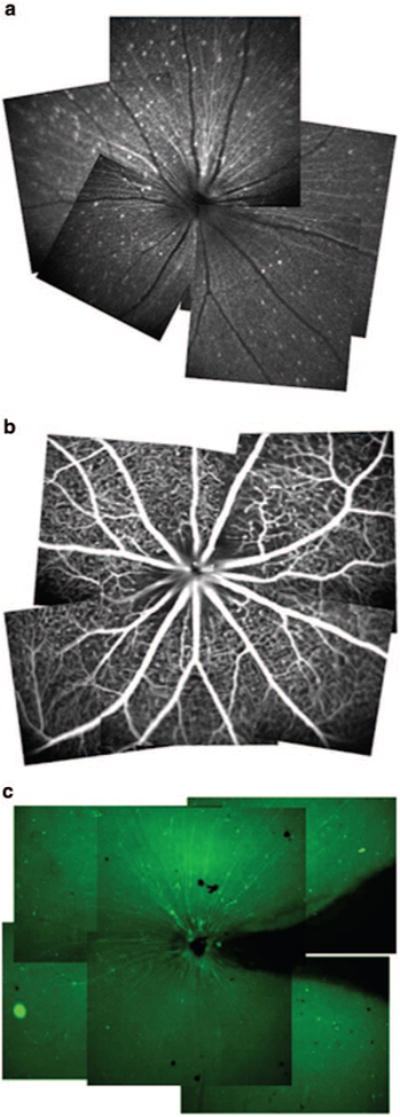
(a) Three retinal montages constructed from multiple in vivo bCSLO and (b) fluorescence angiography and (c) fluorescence microscopy images of retinal flat mount.
Serial Long-Term Monitoring of Retinal Ganglion Cell Degeneration
Progressive decreases in the number of fluorescent spots were evident in the serial bCSLO images after the optic nerve crush (Fig. 2). Distinctive losses of Thy-1 CFP expression in individual RGCs were also evident comparing images obtained at week 10 and year 1 after crush (Figs. 2c, 2d). A few fluorescent spots disappeared at week 2 after crush, but their signals returned at week 10 and week 50 after crush (ovals). The longitudinal profile of RGC damage indicated there was a significant decrease in the number of fluorescent spots at week 1, and the rate reduced gradually thereafter. At weeks 1, 2, 3, 10, and 50 after optic nerve crush, respectively, 18.6% ± 2.3%, 11.3% ± 3.4%, 8.8% ± 5.3%, 4.2% ± 3.1%, and 3.3% ± 2.1% of Thy-1-expressing RGCs remained (P < 0.001; n = 5). A separate analysis comparing remaining Thy-1 CFP- expressing RGCs at 10 and 50 weeks identified a significant loss of RGCs at 50 weeks (P = 0.043; Wilcoxon signed-rank test).
Figure 2.
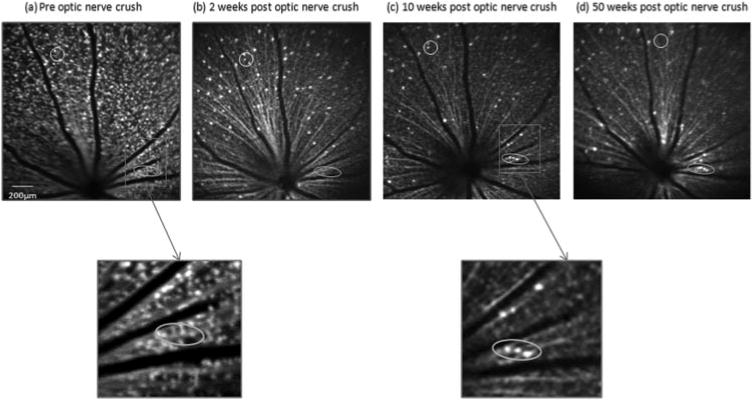
In vivo bCSLO images in the same retinal area of a transgenic Thy-1 CFP mouse before (a) and 2 (b), 10 (c), and 50 (d) weeks after optic nerve crush. Progressive loss of fluorescent spots is illustrated. A cluster of Thy-1 CFP–expressing RGCs (circled) demonstrated progressive loss of Thy-1 CFP after optic nerve crush. A few cells were diminished in fluorescence at week 2 but returned their signals at 10 and 50 weeks after crush (ovals). The reappearance of fluorescence likely signified the return of normal expression of Thy-1 after the stress response.
Modeling the Longitudinal Profile of Retinal Ganglion Cell Degeneration
To characterize the longitudinal profile of RGC degeneration, the relationship between the percentage of remaining cells and the time of measurement was modeled with exponential decay equations (Fig. 3). Fitting the experimental data to a one-phase decay curve y = 0.94e−1.93t + 0.06 (R2 = 0.989, df = 27), the half-life of Thy-1 CFP-expressing RGCs was 2.5 days after optic nerve crush. Comparisons of one-phase versus two-phase decay equations (y = 0.03 + 0.83e−2.78t + 0.14e−0.30t, R2 = 0.993, df = 25) revealed that the latter had the best fit (P = 0.003; extra sum-of-squares F test; Fig. 3). The half-lives of the fast phase and slow phase were 1.7 days and 16.3 days, respectively. No change in fluorescent signal density was found in the contralateral eyes at week 50 in which the sham procedures were performed (P = 0.893; Wilcoxon signed-rank test).
Figure 3.

The longitudinal profile of RGC degeneration after optic nerve crush was fitted with one-phase and two-phase exponential decay models using data obtained from week 0 to week 50. The two-phase exponential decay model had a significantly better fit than the one-phase exponential decay model (P = 0.003). Data are presented as the mean ± SD (error bar). n = 5 mice.
Discussion
These results demonstrate for the first time serial imaging of Thy-1 expression in RGCs. More important, they showed that the technique of bCSLO imaging is useful for long-term monitoring of RGCs. This is an important finding because many neurodegenerative diseases, such as glaucoma, are chronic and progressive and require long-term serial investigation to study progression. Transgenic mice expressing CFP under the control of Thy-1 promoter were studied. The progressive loss of fluorescent spots observed in the bCSLO images after optic nerve crush supports the notion that the fluorescent signals were generated from RGCs. More than 95% of the fluorescent cells have been identified as RGCs using retrograde labeling.1 Because it is a noncontact and noninvasive technique, bCSLO imaging offers a unique approach to image individual RGCs in vivo without the need for intravitreal or retrograde injection of chemical or biological tracers. This is of particular relevance for the long-term study of progressive neurodegenerative diseases such as glaucoma in which repeated injection of tracers is undesirable. It is because repeated intravitreal injection of tracers may increase the risk of compromising the clarity of ocular media whereas retrograde labeling may damage target tissue and thereby disrupt trophic support to the RGCs. Changes in the number of fluorescent spots can be directly compared across different time points because the bCSLO images “functioning” RGCs in which active turnover and transcription of Thy-1 CFP occur. This is in contrast to the in vivo RGC imaging technique with intravitreal injection of Annexin 5 that only labels RGCs expressing a lipid membrane of ongoing apoptosis.10 Thus, at any single time point, only the apoptosing RGCs can be visualized. This makes direct comparison of images at different time points difficult because there is no distinction between degenerated and surviving RGCs in the images. bCSLO imaging is also different from scanning laser ophthalmoscope imaging with retrograde labeling.11 This technique is limited by the fact that microglial cells would also become fluorescent after phagocytosing cell debris of RGCs and thus would confound accurate RGC counting. An image overlay algorithm has been proposed to differentiate RGCs from microglial cells.11 It is evident that single RGC loss can be easily detected with the bCSLO images over 1 year without the need of any image-processing procedures (Fig. 2). bCSLO imaging thereby provides a relatively simple and efficient way to study the longitudinal profile of RGC degeneration.
Optic nerve crush is a well-characterized model to induce RGC loss. In the study by Li et al.,9 less than 10% loss of RGCs was found 1 week after optic nerve crush; maximum loss (57.8%) was detected by 3 weeks. No further loss was detected after 6 weeks. With a scanning laser ophthalmoscope to image retrograded labeled RGCs in vivo, Higashide et al.11 demonstrated approximately 30% and 70% of RGCs were lost at weeks 1 and 4 after optic nerve crush, respectively. Visualizing apoptosing RGCs with intravitreal injection of Annexin 5, Cordeiro et al.10 reported that 40% of RGCs were lost at week 1 and 76% were lost by 12 days after optic nerve transection. In comparison to these studies, we found a higher proportional loss (more than 80% at week 1 after optic nerve crush) of Thy-1-expressing RGCs over time. In fact, our results concur with the finding by Schlamp et al.5 Using the technique of in situ hybridization, they demonstrated that the number of Thy-1– positive cells decreased to approximately 20% of the control fellow eyes, whereas the retrograde-labeled RGCs decreased to approximately 90% at 1 week after optic nerve crush. In other words, loss of Thy-1 expression precedes loss of RGCs. It has been proposed that loss of Thy-1 expression after optic nerve crush is related to a reduction in transcription as a result of shutting down nonessential metabolic function either before or on programmed cell death.5 Assessment of Thy-1 expression could serve as a sensitive indicator of RGC stress. It is not surprising that a small fraction (3.3%) of RGCs survived and expressed Thy-1 CFP 1 year after crush. In fact, long-term survival of RGCs of up to 15.5 months after optic nerve tran-section has been demonstrated.12
The fluorescent spots seen at 3, 10, and 50 weeks probably do not represent CFP phagocytosed by astrocytes, microglia, hematogenous cells, or vascular endothelia. Using a confocal scanning laser ophthalmoscope to image retrograde-labeled RGCs, it has been shown that new fluorescent spots emerge as a result of phagocytosis of RGC debris.11 We did not observe any “newly” emerged fluorescent spots in postcrush retinas that were not found at baseline. As illustrated in Figure 2 (ovals and enlargements), we did occasionally observe fluorescent cells at 10 or 50 weeks after crush that were not present at 2 weeks after crush. However, fluorescent spots at the same positions for each of the emergent spots seen at 10 or 50 weeks were readily identified in the precrush image (Fig. 2a). Hence, these were not newly emerged fluorescent spots but RGCs that stopped expressing CFP after the crush and that later resumed CFP expression.
Several papers indicate it is unlikely that the new spots represented phagocytosed CFP. First, a recent study13 demonstrates that a fusion protein containing CFP linked to the cellular signaling protein Jun is degraded in the lysosomal pathway. This is consistent with the earlier observation that GFP targeted to lysosomes is readily degraded with concomitant loss of fluorescence.14 Hence, it is improbable that any phagocytosed CFP remained at 50 weeks after crush.
Fluorescent spots do not merely represent living RGC soma. Rather, they signify active expression of CFP driven by the Thy-1 promoter in the RGCs. It has been shown in a number of studies that Thy-1 mRNA levels diminished before overt loss of RGCs after optic nerve crush.4,5,15 Thus, instead of representing RGC death, loss of CFP expression in Thy-1 CFP mouse RGCs appears to reflect RGC stress. Similarly, the reappearance of fluorescent spots in the same position observed in the precrush images most likely signified the return of normal expression of CFP in these cells in association with recovery from stress.
Although we do not have direct evidence showing that every RGC in every animal expresses CFP, we have demonstrated that 96% of the RGCs retrogradely labeled by DiI also express CFP.1 The small proportion of DiI-positive RGCs that do not express CFP indicates a small subset of RGCs either not expressing CFP or expressing a very low level of CFP. We believe it is unlikely that the absence of measurement of this small subset of RGCs materially affects the general conclusions regarding the longitudinal measurements of RGC degeneration reported in the present study.
Based on the exponential decay model fitting, it was found that two-phase decay was a better fit than the one-phase decay equation. In other words, the longitudinal profile of RGC degeneration after optic nerve crush is the result of the sum of fast and slow exponential decay. It has been suggested a second phase of RGC death occurs after the primary insult to the optic nerve.16,17 With superior partial transection of the optic nerve, Levkovitch-Verbin et al.17 showed that 55% of RGC bodies were lost in the superior retina whereas 22% were lost in the inferior retina. Further investigation is needed to identify the mechanisms leading to the fast and slow phases of RGC death and the effects of neuroprotection treatment on the exponential decay model.
In summary, serial long-term assessment of RGC Thy-1 expression is possible with bCSLO imaging. The longitudinal profile of RGC damage after optic nerve crush is well modeled by a two-phase exponential decay curve. Monitoring Thy-1 expression of RGCs with bCSLO may provide a novel approach to study the longitudinal profile of RGC degeneration.
Acknowledgments
Supported in part by National Eye Institute Grants EY11008 (JDL) and EY014661 (JDL), and by Heidelberg Engineering, Inc. (RNW).
Footnotes
Disclosure: C.K. Leung, None; J.D. Lindsey, None; J.G. Crowston, None; C. Lijia, None; S. Chiang, None; R.N. Weinreb, Heidelberg Engineering, Inc. (F)
References
- 1.Leung CK, Lindsey JD, Crowston JG, et al. In vivo imaging of murine retinal ganglion cells. J Neurosci Methods. 2008;168:475–478. doi: 10.1016/j.jneumeth.2007.10.018. [DOI] [PubMed] [Google Scholar]
- 2.Morris R. Thy-1 in developing nervous tissue. Dev Neurosci. 1985;7:133–160. doi: 10.1159/000112283. [DOI] [PubMed] [Google Scholar]
- 3.Barnstable CJ, Drager UC. Thy-1 antigen: a ganglion cell specific marker in rodent retina. Neuroscience. 1984;11:847–855. doi: 10.1016/0306-4522(84)90195-7. [DOI] [PubMed] [Google Scholar]
- 4.Huang W, Fileta J, Guo Y, et al. Downregulation of Thy1 in retinal ganglion cells in experimental glaucoma. Curr Eye Res. 2006;31:265–271. doi: 10.1080/02713680500545671. [DOI] [PubMed] [Google Scholar]
- 5.Schlamp CL, Johnson EC, Li Y, et al. Changes in Thy1 gene expression associated with damaged retinal ganglion cells. Mol Vis. 2001;7:192–201. [PubMed] [Google Scholar]
- 6.Chidlow G, Casson R, Sobrado-Calvo P, et al. Measurement of retinal injury in the rat after optic nerve transection: an RT-PCR study. Mol Vis. 2005;11:387–396. [PubMed] [Google Scholar]
- 7.Nash MS, Osborne NN. Assessment of Thy-1 mRNA levels as an index of retinal ganglion cell damage. Invest Ophthalmol Vis Sci. 1999;40:1293–1298. [PubMed] [Google Scholar]
- 8.Feng G, Mellor RH, Bernstein M, et al. Imaging neuronal subsets in transgenic mice expressing multiple spectral variants of GFP. Neuron. 2000;28:41–51. doi: 10.1016/s0896-6273(00)00084-2. [DOI] [PubMed] [Google Scholar]
- 9.Li Y, Schlamp CL, Nickells RW. Experimental induction of retinal ganglion cell death in adult mice. Invest Ophthalmol Vis Sci. 1999;40:1004–1008. [PubMed] [Google Scholar]
- 10.Cordeiro MF, Guo L, Luong V, et al. Real-time imaging of single nerve cell apoptosis in retinal neurodegeneration. Proc Natl Acad Sci U S A. 2004;101:13352–13356. doi: 10.1073/pnas.0405479101. [DOI] [PMC free article] [PubMed] [Google Scholar]
- 11.Higashide T, Kawaguchi I, Ohkubo S, et al. In vivo imaging and counting of rat retinal ganglion cells using a scanning laser ophthalmoscope. Invest Ophthalmol Vis Sci. 2006;47:2943–2950. doi: 10.1167/iovs.05-0708. [DOI] [PubMed] [Google Scholar]
- 12.Hollander H, Bisti S, Maffei L. Long term survival of cat retinal ganglion cells after intracranial optic nerve transection. Exp Brain Res. 1985;59:633–635. doi: 10.1007/BF00261356. [DOI] [PubMed] [Google Scholar]
- 13.Fang D, Kerppola TK. Ubiquitin-mediated fluorescence complementation reveals that Jun ubiquitinated by Itch/AIP4 is localized to lysosomes. Proc Natl Acad Sci U S A. 2004;101:14782–14787. doi: 10.1073/pnas.0404445101. [DOI] [PMC free article] [PubMed] [Google Scholar]
- 14.Belkhiri A, Lytvyn V, Guilbault C, et al. A noninvasive cell-based assay for monitoring proteolytic activity within a specific subcel-lular compartment. Anal Biochem. 2002;306:237–246. doi: 10.1006/abio.2002.5706. [DOI] [PubMed] [Google Scholar]
- 15.Ahmed F, Brown KM, Stephan DA, Morrison JC, Johnson EC, Tomarev SI. Microarray analysis of changes in mRNA levels in the rat retina after experimental elevation of intraocular pressure. Invest Ophthalmol Vis Sci. 2004;45:1247–1258. doi: 10.1167/iovs.03-1123. [DOI] [PubMed] [Google Scholar]
- 16.Yoles E, Schwartz M. Degeneration of spared axons following partial white matter lesion: implications for optic nerve neuropathies. Exp Neurol. 1998;153:1–7. doi: 10.1006/exnr.1998.6811. [DOI] [PubMed] [Google Scholar]
- 17.Levkovitch-Verbin H, Quigley HA, Kerrigan-Baumrind LA, et al. Optic nerve transection in monkeys may result in secondary degeneration of retinal ganglion cells. Invest Ophthalmol Vis Sci. 2001;42:975–982. [PubMed] [Google Scholar]