

Abstract
Lipidomics, the comprehensive measurement of lipid species in a biological system, has promising potential in biomarker discovery and disease etiology elucidation. Advances in chromatographic separation, mass spectrometric techniques, and novel substrate applications continue to expand the number of lipid species observed. The total number and type of lipid species detected in a given sample are generally indicative of the sample matrix examined (e.g. serum, plasma, cells, bacteria, tissue, etc.). Current exact mass lipid libraries are static and represent the most commonly analyzed matrices. It is common practice for users to manually curate their own lists of lipid species and adduct masses; however, this process is time-consuming. LipidPioneer, an interactive template, can be used to generate exact masses and molecular formulas of lipid species that may be encountered in the mass spectrometric analysis of lipid profiles. Over 60 lipid classes are present in the LipidPioneer template, and include several unique lipid species, such as ether-linked lipids and lipid oxidation products. In the template, users can add any fatty acyl constituents without limitation in the number of carbons or degrees of unsaturation. LipidPioneer accepts naming using the lipid class level (sum composition) and the LIPID MAPS notation for fatty acyl structure level. In addition to lipid identification, user generated lipid m/z values can be used to develop inclusion lists for targeted fragmentation experiments. Resulting lipid names and m/z values can be imported into software such as MZmine or Compound Discoverer to automate exact mass searching and isotopic pattern matching across experimental data.
Introduction
Measuring shifts in lipid profiles has promising potential in biomarker discovery and elucidation of disease etiology [1]. This is due to the diverse biological roles of lipids, which include membrane fluidity and heterogeneity [2], signaling of cellular events [3], energy storage, and as precursors to inflammation and hormone pathways [4]. The diversity in the biological functions of lipids within the lipidome is in part a result of the inherent diversity in chemical structure. Numerous backbone, head group and fatty acyl constituents allow for a variety of structural combinations. With 40 noted fatty acyl chains, over 180,000 theoretical lipid structures can be determined [5], while the major searchable database for lipids, LIPID MAPS [6], contains approximately 40,000 unique lipid species. In addition, if vinyl and ether-linked lipids, lipid methylation, and lipid oxidation products are accounted for, this list becomes orders of magnitude larger.
Therefore, static libraries are limited in their capacity to provide the variety of important lipid species which are detected in various sample matrices by mass spectrometric approaches. In targeted mass spectrometric approaches, the ability to quickly simulate the m/z of rare lipid ions, internal standards, and lipid ions specific to unique matrices is limited. Currently, users can manually search for exact mass matches, formulas, and develop target lists for lipid ion fragmentation using online databases such as LIPID MAPS. Alternatively, users can manually compile customized mass lists into libraries using tools such as Lipid Mass Spectrum Analysis (LIMSA) which is an Excel add-on [7]. However, this becomes a tedious task for identifying the molecular formulas and adduct masses for multiple lipid species within various lipid classes. As previously mentioned, these online databases are not as comprehensive as they are often tailored for a specific biological sample matrix. LIPID MAPS, for example, allows users to calculate the exact mass for the mammalian lipidome [6]. However, the possible fatty acid tail combinations are limited in the number of unsaturations and the total number of carbons. One of the most flexible tools to simulate lipid exact mass and adduct m/z values is Lipid-Pro [8]. Notably, Lipid-pro allows in-silico prediction of fragmentation as well. Lipid-Pro includes an interface to manually insert a formula for head groups, fatty acid chains, backbone constituents, and adducts to automatically generate combinations of all these constituents as output lists containing exact mass calculations. While flexible, Lipid-pro requires a large investment of time to determine all the molecular formulas of each building block for lipids of interest. In all instances, for LIPID MAPS, LIMSA, and Lipid-Pro, there is no capability to automate or quickly determine the exact mass for the sum composition of a lipid species as the tail information is required.
Therefore, an interactive template was developed to generate an unlimited exact mass database containing formulas, neutral masses, and adduct m/z values for user inputted lipid species. LipidPioneer is an excel template implemented using Visual Basic for Applications (VBA) scripting in Microsoft Excel 2010 and later platforms (MSXL). The template covers over 60 lipid types, which encompasses more lipid types than some of the most extensive in-silico lipid libraries such as LipidBlast [9]. In addition, this template allows for long-chained oxidized lipid species (ketone, hydroxy, hydroperoxy, and epoxy containing species), short-chained species (ending in carboxylic acid and aldehyde), and plasmenly and plasmanyl species. Users can add any fatty acyl constituents without limits in the number of carbons or degrees of unsaturation.
To highlight the usefulness of LipidPioneer in a lipidomics workflow, the software was used to generate an exact mass database for Jurkat T lymphocyte cells which are commercially available mammalian CD4+ T cells used to characterize T cell receptor signaling pathways. Human CD4+ T cells have a broad, diverse range of lipids present in the cellular membrane that correlate with their function [10]. While the lipidome of CD4+ T cells in multiple sclerosis has been characterized using high-resolution mass spectrometry (HRMS), this study provided a fairly limited profile of the lipid content [11]. This work incorporates LipidPioneer to build an exact mass database that covers a more comprehensive lipidome of CD4+ T cells. The Jurkat T-lymphocyte lipid database contains 12 lipid classes and over 200 lipid species, including some ether-linked and oxidized lipid species. This exact mass database was then used to generate a targeted MS/MS list for UHPLC-HRMS top10 data-dependent lipidomics approaches.
Experimental
Chemicals and Reagents
Roswell Park Memorial Institute (RPMI) 1640 medium (10-043-CV) and fetal bovine serum (FBS) were purchased from Corning, Inc. (Corning, NY). Sodium pyruvate (100 mM) and 4-(2-hydroxyethyl)-1-piperazineethanesulfonic acid (HEPES, 1M) were purchased from Sigma-Aldrich (St. Louis, MO). Ammonium acetate and all analytical grade solvents (formic acid, chloroform, methyl-tert butyl ether, and methanol) were purchased from Fisher-Scientific (Waltham, MA). All mobile phase solvents were Fisher Optima LC/MS grade (acetonitrile, isopropanol, and water).
Sample Preparation
Jurkat cells (Clone E6-1) were purchased as a frozen cell culture from ATCC (Manassas, VA) and grown to the manufacturer’s recommendations. Lipids were extracted from the cells using the original Folch procedure [12] allowing for a chloroform:methanol:water ratio of 8:4:3 (v/v). Details outlining this procedure [13] can be found in the supplemental information.
Data Acquisition
An ultra-high performance liquid chromatography (UHPLC) system (Thermo Dionex UltiMate 3000 RS) coupled to a high-resolution Q Exactive Orbitrap (Thermo Scientific, San Jose, CA) was employed. A Supelco Analytical Titan C18 column (2.1 × 50 mm, 1.9 μm particle size) maintained at 30°C was used. Full-scan mode data were collected in profile mode from m/z 100–1500 corresponding to the mass range of most expected cellular lipids. Tandem MS (data-dependent top 10, ddMS2 and all ion fragmentation, AIF) analyses were incorporated in positive and negative ion mode for the identification of endogenous lipid species. The parameters for the full scan and tandem MS acquisitions can be found in supplemental information (experimental section and Table S1).
Data Processing
All UHPLC-HRMS data were collected and initially processed by the Thermo Xcalibur Workstation software (version 2.2.44). Lipid fragments were searched against the Thermo Scientific LipidSearch software and our in-house LipidMatch fragmentation libraries. LipidSearch software was used for top10-ddMS2 files and LipidMatch was used for AIF and top10-ddMS2 files.
Discussion
LipidPioneer templates for exact mass calculation
LipidPioneer was designed as a Microsoft Excel workbook containing embedded Visual Basic for Applications (VBA) macros (Redmond, WA). A navigation page and limited interactive interface are provided which allow users to select lipid class(es) of interest from a list of over 60 possibilities. Each class-specific worksheet builds exact mass values by parsing user-provided lipid names to return the lipid species formula, neutral mass, and m/z values for nine common adducts ([M+H]+, [M+H-H2O]+, [M+NH4]+, [M+Na]+, [M+K]+, [M+Li]+, [M-H]−, [M+HCO2]−, [M+CH3CO2]−). Supported lipid classes and modifications therein, their abbreviations, common names, and examples of input notation are listed in the supplemental information (Table S2). LipidPioneer templates, unlike those currently available, allow for inputs containing fatty acyl information such as PC (16:0_18:4), fatty acyl position information such as PC(16:0/18:4), or class level information, such as 34:4 PC. Names containing any fatty acyl information for a lipid species are automatically converted to sum composition to provide a quick way to consolidate tail information.
Long-chain and short-chain oxidation products are also supported (Table S2). A screen shot of this capability in LipidPioneer, containing an example of PC inputs, is shown in Figure 1. The possibilities for long-chain oxidation products include ketone, epoxy, hydroxy, and hydroperoxy derivatives, while short-chain oxidation products include carboxylic acid and aldehyde derivatives [14]. Oxidation products are separated by two underscores.
Figure 1.
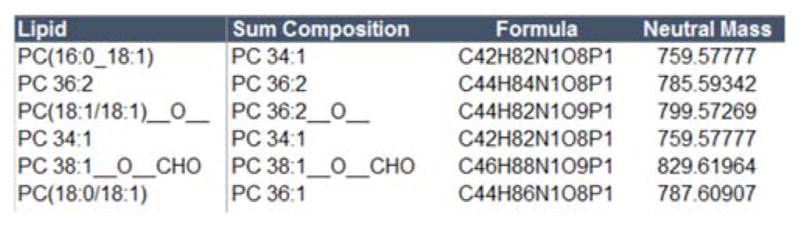
Example exact mass library for phosphatidylcholine (PC) lipid species for the following input possibilities: [1] fatty acyl information, PC(16:0_18:1), [2] fatty acyl position information, PC(18:0/18:1), [3] sum composition, PC 36:2, and [3] oxidation products, PC(18:1/18:1)__O__.
For example, exact masses are calculated for the following oxidation product combinations of lipid species containing class level or tail information: PC(16:0/18:3)__O__ [ketone or epoxy], 34:4 PC__O__ [ketone or epoxy], 34:2 PC__O__OOH__ [ketone/epoxy and hydroperoxy], and PC(16:0/9:0)__CHO__ [aldehyde]. LipidPioneer can also be applied for the plasmanyl and plasmenyl forms of lipid species. The available lipid classes containing ether-linkages are denoted in Table S2. In this case, PC(O-16:0/18:4) or PC O-34:4 would refer to the plasmanyl form, and PC(P-16:0/18:4) or PC P-34:4 would refer to the plasmenyl form. It is important to note that the ether-linked fatty acyl constituent should be the first fatty acyl constituent written and that multiple ether-linked constituents for a single species are not supported within this template. For example, DG(16:0/O-16:0) or DG(O-16:0/O-16:0) is not an accepted annotation in this version. A screen shot of the ether-linked corollaries (including oxidized products) is shown in Figure S1.
Exact mass database generation from summary table
Once the user has provided names for all lipids of interest into the class-specific worksheets, exact masses are calculated automatically. Populated lists containing lipid name, formula, and adduct m/z values can be easily compiled into a summary list, which can then be used as a library in exact mass search algorithms such as those employed by MZmine [15] to automatically add tentative annotations to features (Figure S2). This function can be used to create inclusion lists for targeted or data-dependent approaches in order to obtain fragmentation data for all expected lipids followed by further confirmation using software that identify features based on MS/MS information, such as MS-DIAL [16] or GREAZY [17]. For certain lipid types, LipidPioneer contains static libraries. These include free cholesterol, sphingoid bases, bile acids and eicosanoids. Once the database is built for a specific sample matrix, the user can easily search for an exact mass using the find feature in Microsoft Excel.
Application of LipidPioneer to Jurkat CD4+ T cells for exact mass database generation
Over 200 lipid species from 12 lipid classes were identified in the Jurkat cells (Table S3) using LipidSearch and LipidMatch. Each of the lipid classes were imported into LipidPioneer to build the exact mass library. A summary table was generated for all lipid species. LipidPioneer allows the user to filter the summary table based on the class or the adduct of choice, allowing for a quick way of generating an adduct and lipid-class specific inclusion list for targeted studies involving specific sample matrices. The Jukat T cell lipidome database can be found in the supporting information (LipidPioneer v0.9_Jurkatdatabase.xlsm). The resulting exact mass summary table was converted into a Thermo-specific targeted MS/MS inclusion list for future studies.
Conclusion
The public beta version of LipidPioneer allows users to directly access the lipid class of interest from the landing page. LipidPioneer covers over 60 total lipid classes including oxidized and ether-linked lipid species. Unlike static libraries, these excel templates can be applied to any sample matrix (from mammalian systems to bacteria) as the computer-generated exact mass libraries generated are user-defined. LipidPioneer is the only template or software which can directly parse lipid names to determine formulas and adduct m/z values. Currently, LipidPioneer is envisioned to be used in both discovery work, determining potential lipid candidates from exact m/z, and to complement tandem MS libraries as the summary page generates exact mass lists which can be imported into vendor-specific mass spectrometer inclusion lists.
Every attempt has been made to create easily understood instructions, with supplemental information provided to help guide users. Some features include a navigation page linking to each worksheet associated with a lipid class (along with definitions for those classes), persistent quick linking back to the navigation and instruction pages, and the ability from the instruction page to quickly generate (or regenerate if underlying data have changed) a summary list. An example of the correct naming convention for each class is also provided as the first entry in each sheet to assist users with data input. Planned features for future versions include: exact mass searching capabilities for user generated libraries; example libraries for matrices such as human plasma and liver; and automated calculation for any user-defined adduct, using annotation such as MGDG(16:0e/18:2) [NH4-CO]+.
Supplementary Material
Acknowledgments
This research was done in collaboration between Core 1 and Core 3 of the Southeast Center for Metabolomics (SECIM) <http://secim.ufl.edu/> (NIH Grant #U24 DK097209).
Footnotes
Disclaimer Certain commercial equipment, instruments, or materials are identified in this paper to specify adequately the experimental procedure. Such identification does not imply recommendation or endorsement by the National Institute of Standards and Technology; nor does it imply that the materials or equipment identified are necessarily the best for the purpose. Because the LipidPioneer templates are fluid and user-modifiable, it is possible to create lipids that are not biologically possible. Therefore, a detailed review of the biology is critical to ensure that the lipid identified is possible. The most common mammalian lipid fatty acyl chains contain 0–6 degrees of unsaturation and 12–22 carbons [18]. The mechanisms of formation for lipid oxidation and the most common oxidized lipid species are available in literature.[19–22]
Supporting Information Available LipidPioneer Microsoft Excel templates for over 60 lipid classes shown in Table S2 (LipidPioneer v0.9.xlsm) are freely available for download at http://secim.ufl.edu/secim-tools/.
References
- 1.Hu C, van der Heijden R, Wang M, van der Greef J, Hankemeier T, Xu G. Analytical strategies in lipidomics and applications in disease biomarker discovery. J Chromatogr B. 2009;877:2836–2846. doi: 10.1016/j.jchromb.2009.01.038. [DOI] [PubMed] [Google Scholar]
- 2.Brown DA, London E. Structure and function of sphingolipid- and cholesterol-rich membrane rafts. J Biol Chem. 2000;275:17221–17224. doi: 10.1074/jbc.R000005200. [DOI] [PubMed] [Google Scholar]
- 3.Fernandis AZ, Wenk MR. Membrane lipids as signaling molecules. Curr Opin Lipidol. 2007;18:121–128. doi: 10.1097/MOL.0b013e328082e4d5. [DOI] [PubMed] [Google Scholar]
- 4.Isakson PC, Raz A, Needleman P. Selective incorporation of 14C-arachidonic acid into the phospholipids of intact tissues and subsequent metabolism to 14C-prostaglandins. Prostaglandins. 1976;12:739–748. doi: 10.1016/0090-6980(76)90049-6. [DOI] [PubMed] [Google Scholar]
- 5.Yetukuri L, Ekroos K, Vidal-Puig A, Oresic M. Informatics and computational strategies for the study of lipids. Mol BioSyst. 2008;4:121–127. doi: 10.1039/b715468b. [DOI] [PubMed] [Google Scholar]
- 6.Sud M, Fahy E, Cotter D, Brown A, Dennis EA, Glass CK, Merrill AH, Murphy RC, Raetz CRH, Russell DW, Subramaniam S. LMSD: LIPID MAPS structure database. Nucleic Acids Research. 2007;35:D527–532. doi: 10.1093/nar/gkl838. [DOI] [PMC free article] [PubMed] [Google Scholar]
- 7.Haimi P, Chaithanya K, Kainu V, Hermansson M, Somerharju P. Instrument-independent software tools for the analysis of MS-MS and LC-MS lipidomics data. Methods Mol Biol. 2009;580:285–294. doi: 10.1007/978-1-60761-325-1_16. [DOI] [PubMed] [Google Scholar]
- 8.Ahmed Z, Mayr M, Zeeshan S, Dandekar T, Mueller MJ, Fekete A. Lipid-Pro: a computational lipid identification solution for untargeted lipidomics on data-independent acquisition tandem mass spectrometry platforms. Bioinformatics (Oxford, England) 2015;31:1150–1153. doi: 10.1093/bioinformatics/btu796. [DOI] [PubMed] [Google Scholar]
- 9.Kind T, Okazaki Y, Saito K, Fiehn O. LipidBlast templates as flexible tools for creating new in-silico tandem mass spectral libraries. Anal Chem. 2014;86:11024–11027. doi: 10.1021/ac502511a. [DOI] [PMC free article] [PubMed] [Google Scholar]
- 10.Miguel L, Owen DM, Lim C, Liebig C, Evans J, Magee AI, Jury EC. Primary human CD4+ T cells have diverse levels of membrane lipid order that correlate with their function. Journal of immunology (Baltimore, Md: 1950) 2011;186:3505–3516. doi: 10.4049/jimmunol.1002980. [DOI] [PubMed] [Google Scholar]
- 11.Vergara D, D’Alessandro M, Rizzello A, De Riccardis L, Lunetti P, Del Boccio P, De Robertis F, Trianni G, Maffia M, Giudetti AM. A lipidomic approach to the study of human CD4+ T lymphocytes in multiple sclerosis. BMC Neuroscience. 2015;16:1–10. doi: 10.1186/s12868-015-0183-1. [DOI] [PMC free article] [PubMed] [Google Scholar]
- 12.Folch J, Lees M, Stanley GHS. A simple method for the isolation and purification of total lipides from animal tissues. J Biol Chem. 1957;226:497–509. [PubMed] [Google Scholar]
- 13.Ulmer CZ, Yost RA, Chen J, Mathews CE, Garrett TJ. Liquid chromatography-mass spectrometry metabolic and lipidomic sample preparation workflow for suspension-cultured mammalian cells using Jurkat T lymphocyte cells. J Proteomics Bioinform. 2015;8:126–132. doi: 10.4172/jpb.1000360. [DOI] [PMC free article] [PubMed] [Google Scholar]
- 14.Shahidi F, Zhong Y. Lipid oxidation and improving the oxidative stability. Chem Soc Rev. 2010;39:4067–4079. doi: 10.1039/b922183m. [DOI] [PubMed] [Google Scholar]
- 15.Pluskal T, Castillo S, Villar-Briones A, Orešič M. MZmine 2: modular framework for processing, visualizing, and analyzing mass spectrometry-based molecular profile data. BMC Bioinformatics. 2010;11:395. doi: 10.1186/1471-2105-11-395. [DOI] [PMC free article] [PubMed] [Google Scholar]
- 16.Tsugawa H, Cajka T, Kind T, Ma Y, Higgins B, Ikeda K, Kanazawa M, VanderGheynst J, Fiehn O, Arita M. MS-DIAL: data-independent MS/MS deconvolution for comprehensive metabolome analysis. Nature Methods. 2015;12:523–526. doi: 10.1038/nmeth.3393. [DOI] [PMC free article] [PubMed] [Google Scholar]
- 17.Kochen MA, Chambers MC, Holman JD, Nesvizhskii AI, Weintraub ST, Belisle JT, Islam MN, Griss J, Tabb DL. Greazy: Open-Source Software for Automated Phospholipid Tandem Mass Spectrometry Identification. Analytical Chemistry. 2016;88:5733–5741. doi: 10.1021/acs.analchem.6b00021. [DOI] [PMC free article] [PubMed] [Google Scholar]
- 18.Shevchenko A, Simons K. Lipidomics: coming to grips with lipid diversity. Nat Rev Mol Cell Biol. 2010;11:593–598. doi: 10.1038/nrm2934. [DOI] [PubMed] [Google Scholar]
- 19.Domingues MRM, Reis A, Domingues P. Mass spectrometry analysis of oxidized phospholipids. Chem Phys Lipids. 2008;156:1–12. doi: 10.1016/j.chemphyslip.2008.07.003. [DOI] [PubMed] [Google Scholar]
- 20.Sparvero LJ, Amoscato AA, Kochanek PM, Pitt BR, Kagan VE, Bayır H. Mass-spectrometry based oxidative lipidomics and lipid imaging: applications in traumatic brain injury. J Neurochem. 2010;115:1322–1336. doi: 10.1111/j.1471-4159.2010.07055.x. [DOI] [PMC free article] [PubMed] [Google Scholar]
- 21.Spickett CM, Pitt AR. Oxidative lipidomics coming of age: advances in analysis of oxidized phospholipids in physiology and pathology. Antioxid Redox Signal. 2015;22:1646–1666. doi: 10.1089/ars.2014.6098. [DOI] [PMC free article] [PubMed] [Google Scholar]
- 22.Stutts WL, Menger RF, Kiss A, Heeren RMA, Yost RA. Characterization of phosphatidylcholine oxidation products by MALDI MSn. Anal Chem. 2013;85:11410–11419. doi: 10.1021/ac402400f. [DOI] [PubMed] [Google Scholar]
Associated Data
This section collects any data citations, data availability statements, or supplementary materials included in this article.