

Abstract
In vitro models for screening new cancer chemotherapeutics often rely on two-dimensional cultures to predict therapeutic potential. Unfortunately, the predictive power of these models is limited, as they fail to recapitulate the complex three-dimensional environments in tumors that promote the development of a chemoresistant phenotype. In this study, we describe the preparation and characterization of paper-based cultures (PBC) engineered to assess chemotherapeutic effectiveness in three dimensional, diffusion-limited environments. Similar environments are found within poorly vascularized tumors. These cultures, which are assembled by stacking together cell-laden paper scaffolds to yield thick tissue-like structures, generate monotonic gradients vertically through the culture and provide distinct chemical environments for each scaffold. After prolonged incubation, the scaffolds can simply be peeled apart and analyzed to relate cellular responses to the chemical environment experienced at that scaffold. Through fluorescence imaging, viable and proliferative cell populations were mapped within a stacked culture and found to be most abundant in scaffolds close to the nutrient-rich medium. By adjusting the cell density, we modulated the spatiotemporal evolution of oxygen gradients across the cultures and correlated these environmental changes with cellular sensitivity to SN-38 exposure. From these results, we showed that differences in the oxygen gradients produced cellular populations with significantly different chemosensitivities. Through this work, we highlight PBCs ability to serve as an analytical model capable of determining chemotherapeutic effectiveness under a range of chemical environments.
Keywords: 3D culture, drug screening, tumor model, hypoxia, oxygen mapping
Graphical Abstract
A paper-based culture designed to measure differences in chemotherapeutic responsiveness between cell populations experiencing different chemical environments.
Introduction
Cell-based screens used to identify potential chemotherapeutics rely heavily on two-dimensional (2D) assays in which cells are cultured as monolayers. These assays are easily assembled and amenable to screening libraries of potential therapeutics in a high-throughput and parallel manner. Despite their utility, monolayer cultures fail to replicate the complex chemical and physiological conditions that promote in vivo drug-resistance.1–4 This disparity between 2D cultures and in vivo conditions is, in part, attributed to why a majority of therapeutic candidates fail in pre-clinical trials.2 To better identify potential therapeutic candidates during the drug discovery phase, more predictive in vitro assays are needed.
A growing body of research suggests that three-dimensional (3D) cultures can be used to bridge the biological gap between monolayer cultures and animal models.2,4–6 Cells cultured in 3D environments as aggregates (i.e., spheroids) or in hydrogel scaffolds develop distinct morphologies,5 behaviors,6 and chemosensitivities4 that are more representative of cells found in vivo. Spheroids have been widely used to assess therapeutic efficacy and toxicity,2,7–11 as mass-transport limitations within spheroids produce chemical gradients similar to those within poorly vascularized tumor tissue.12,13 These chemical gradients lead to the formation of stratified zones of cells: proliferating cells along the exterior of the spheroid, quiescent cells in the spheroid's interior, and necrotic cells at the spheroid's core.12–16 Each of these zones exhibit varying degrees of sensitivity to therapeutic dosing, and yield physiochemical conditions that allow spheroids to better predict in vivo responses.2,4,17–19 Despite their benefits, spheroids face a number of limitations: i) only a small subset of cell lines are capable of forming aggregates;7 ii) deriving spatial information requires laborious histological sectioning; and iii) spheroids offer limited experimental control over the chemical gradients which form across the culture.
Paper-based cultures (PBCs) are an emerging 3D culture platform that overcomes many of the limitations associated with spheroids. PBCs are compatible with a wide range of cell types, because they are prepared by suspending cells in a hydrogel, which is then infused into sheets of wax-patterned filter paper. The paper fibers provide structural integrity to the hydrogel slabs, allowing the individual sheets to be stacked together in a modular fashion. Wax patterns on the paper act as hydrophobic barriers and provide discrete zones for seeding cells. By introducing impermeable barriers, diffusional exchange is limited to one side of the stacked culture, resulting in the formation of monotonic gradients similar to the chemical gradients found in poorly vascularized tumors.20 The modularity of the PBCs also provide control over the chemical environment formed in the stacked cultures, as cell density, thickness, and orientation can be changed to suit experimental needs.
The ability to separate the stacks into individual layers after an experiment provides spatially resolved datasets relating cellular responses to the chemical environment experienced during incubation. Cell-containing sheets have been analyzed with a number of different readouts, including: quantitative polymerase chain reaction (qPCR), fluorescence microscopy, immunohistochemistry (IHC), enzyme-linked immunosorbent assay (ELISA), and mass spectrometry.21–24 Due to the similarities between chemical environments in PBCs and avascular tissue, this platform has been used to investigate the invasion of breast and lung carcinomas,21,23,25,26 cardiac ischemia,27 and cancer metabolism.24,28,29
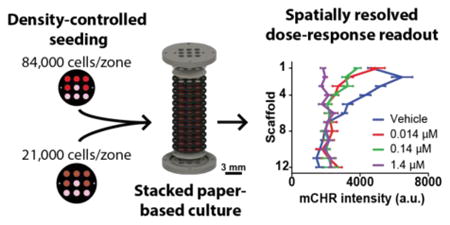
In this study, we used PBCs to relate differences in the chemoresistance of a colorectal carcinoma cell line to the oxygen environment experienced by those cells. The PBCs are described in Figure 1, and were used to impose monotonic gradients of nutrients and wastes vertically along the stacked cultures. By adjusting the cell density of these cultures, we showed that we could manipulate the profile of the chemical gradients that form and tune the chemical environment. We confirmed our ability to modulate these gradients by quantifying oxygen profiles in cultures seeded at a high and low density: 84,000 cells/zone and 21,000 cells/zone, respectively. As expected, cultures seeded at lower densities experienced shallower oxygen gradients. By dosing these cultures with a chemotherapeutic agent, SN-38, we compared cellular viability between each scaffold. This information allowed us to relate spatial differences in relative chemoresistance to the layer's local oxygen environment. Our findings show that high-density cultures experiencing chronic hypoxia exhibit increased sensitivity to therapeutic dosing, while low density cultures have increased resistance. Through this work, we expand on the application of PBCs by demonstrating the ability of this platform to assess chemotherapeutic efficacy in a colon tumor model with varying chemical environments.
Figure 1.
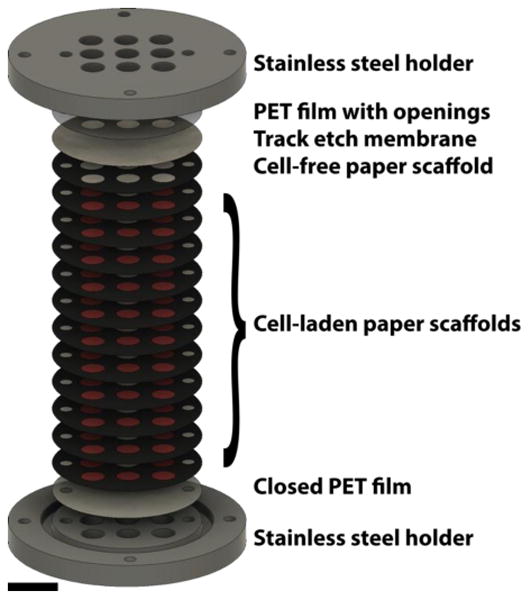
Schematic of the 12-scaffold PBC. The experimental setups used in this study consisted of 12 paper scaffolds, a track etch membrane, and two PET films sandwiched between two stainless steel metal holders. The paper-scaffolds were used to form the cultures by stacking together 11 cell-containing scaffolds with a cell-free scaffold at the top. The track etch membrane confined the HCT116 cells in the paper scaffolds. The two PET films limited the diffusional exchange with the surrounding medium to the top of the stack. The stainless steel holders compressed the entire culture together, and ensured the scaffolds were in conformal contact throughout the experiment. (scale bar = 9 mm)
Experimental
Cell culture
HCT116 colorectal carcinoma cell lines were obtained from the American Type Culture Collection (ATCC), and validated by Short Tandem Repeating (STR) sequencing in 2016. The cells were maintained as adherent cultures at 5 % CO2 and 37 °C in McCoy's 5A medium with L-glutamine, supplemented with fetal bovine serum (10%, v/v) and penicillin-streptomycin (1%, v/v). Medium was exchanged approximately every 48 h, and cells were passaged at 70-80% confluency. Cells were passaged by detachment with trypsin-EDTA (5 min, 37 °C). Cells were washed with serum-containing medium, pelleted, resuspended, and cultured in a fresh flask at a 1/10 dilution. All cell culture reagents, unless otherwise stated, were acquired from Gibco by Life Technologies.
Lines of HCT116 cells constitutively expressing mCherry fluorescent protein (HCT116 mCHR) were generated via transfection with a 3:1 ratio (g/L) of mCherry2-C1 plasmid to EndoFectin™ Max (GeneCopoeia). The mCherry2-C1 plasmid was a gift from Michael Davidson (Addgene, plasmid # 54563). The transfection was performed according to the manufacturer's suggested protocol. Stable lines were maintained with 500 μg/mL of Geneticin® (ThermoFisher) until a single clone was selected.
Paper scaffold and PET film preparation
Paper-based scaffolds were prepared as detailed previously.21,30 Sheets of Whatman 105 lens paper were wax-patterned with a ColorQube 8570 printer (Xerox) and sterilized with ultra-violet (UV) light overnight prior to usage. Two paper designs were used in this study: i) a “9-zone scaffold,” which contained nine circular zones (2.5 μm diameter) for seeding with cell-free or cell-laden Matrigel, and ii) a “single-zone scaffold”, which contained one circular zone (2.5 mm diameter) for seeding. Schematics of the 9-zone scaffolds can be found in the Electronic Supplementary Information (ESI) of reference #21. Schematics of the single-zone scaffolds are provided in ESI, Fig. S1.
Polyethylene terephthalate (PET) films (overhead transparency, Staples®) were prepared as detailed previously.21,30 Two PET designs were used for this study: i) an “open” design, which contained nine openings matching the locations of the zones in the 9-zone scaffold; and ii) a “closed” design, which prevented the exchange with medium by containing no openings.30
Assembling PBCs
Prior to seeding the 9-zone scaffold with HCT116 mCHR cells, the cells were suspended in Matrigel (Corning) at a density of either 168,000 cells/μL or 42,000 cells/μL. Once prepared, the Matrigel suspensions were stored on ice to prevent gelation. In the cell-containing paper scaffolds, five zones were seeded with 0.5 μL of the cell-laden Matrigel. The remaining four zones were filled with 0.5 μL of cell-free Matrigel and served as background controls for image analysis. In the cell-free scaffolds, all nine zones were filled with 0.5 μL of cell-free Matrigel. After seeding, the scaffolds were incubated in medium for 4 h before assembling the stack culture.
The stacked PBCs used in this study are detailed in Figure 1. Each stack consisted of: i) an open PET film (top), ii) a 13-mm diameter, 0.4 μm pore size track-etched membrane (Whatman), iii) a cell-free paper scaffold, iv) 11 cell-laden paper scaffolds, and v) a closed PET film (bottom). The entire stack was placed between stainless steel holders, which ensured the individual scaffolds were in conformal contact throughout the experiment. Stacked cultures used for oxygen measurements contained either 1, 4, 8, or 12 paper scaffolds. In assemblies with 4, 8, and 12 scaffolds, the first scaffold was cell-fee with the remaining scaffolds containing either 84,000 cells/zone or 21,000 cells/zone.
Assembled cultures were placed in 6-well plates containing McCoy's 5A medium and incubated on an orbital shaker set to 300 rpm. Medium in each well was exchanged every three days. Prior to fluorescence imaging or staining, the stacks were disassembled and each scaffold washed twice with phosphate buffer saline (PBS).
Immunocytochemistry
Within 15 min of disassembling a PBC, the individual scaffolds were fixed in PBS with 4% (v/v) paraformaldehyde for 15 min. Scaffolds were then blocked and permeabilized for 1 h in PBS containing 5% normal goat serum (Cell Signaling Technologies) and 0.3% Triton™ X-100 (Sigma-Aldrich) prior to immunostaining. Scaffolds were incubated in the primary antibody solution overnight at 4 °C, and then incubated in the secondary antibody solution for 4 h at room temperature. Antibodies were diluted with PBS containing 1% (w/v) bovine serum albumin (Cell Signaling Technologies) and 0.3% Triton™ X-100: rabbit anit-Ki-67 (primary antibody, H-300, Santa Cruz, 1:100 dilution) and goat anti-rabbit IgG-CFL488 (secondary antibody, sc-516248, Santa Cruz, 1:500 dilution).
Oxygen sensor integration and interrogation
The oxygen sensors consisted of a palladium tetrakis (pentafluorophenyl) porphyrin (PdTFPP)-containing polystyrene thin film coated onto a PET sheet. The fabrication and characterization of these sensors are detailed in previous work.20 Briefly, a 1 mM solution of PdTFPP in 18.75% (w/w) polystyrene-toluene was spin-coated onto a 13-mm circular PET sheet. Prior to incorporation into PBCs, the sensors were sterilized with UV light for 1 h.
The oxygen sensors were placed at the bottom of stacks containing 1-, 4-, 8-, or 12-scaffolds in lieu of the closed PET films, and the cultures were maintained at normal cell culture conditions in 6-well plates. Oxygen measurements were collected at 24, 72, 96, 120, and 168 h after initial assembly. Medium was exchanged every three days.
SN-38 dosage and fluorescein penetration assay
To evaluate the response of HCT116 cells to SN-38, 12-scaffold cultures were exposed to increasing concentrations of SN-38 (0.014, 0.14, and 1.4 μM in McCoy's medium) for 48 h. Stacks were incubated for 24 h prior to exposure to SN-38. Detailed protocols of fluorescein penetration through 12-stacked cultures and dose-response assays of HCT116 mCHR cells in monolayer and single-zone scaffolds are provided in the ESI.
Image acquisition and analysis
Fluorescence images of the individual scaffolds were acquired with a Typhoon 9400 scanner (GE Life Sciences) at a resolution of 200 μm. HCT116 mCHR cells were imaged using a 532 nm laser and 610±30 nm emission filter. The Ki-67 stained cells were imaged using a 488 nm laser and 526 nm short pass emission filter.
Viability measurements were performed by measuring the average mCHR fluorescence value of each zone using ImageJ software.31 Reported fluorescence values for a single scaffold were obtained by subtracting the average fluorescence intensity of the four cell-free zones from the average fluorescence intensity of the five cell-containing zones. Relative proliferation was determined by dividing Ki-67 images by their corresponding mCHR image. Reported values are a ratio of Ki-67 intensity to mCHR intensity.
Fluorescence images of the of the oxygen sensors and fluorescein penetration studies were taken using an Axiovert 40 CFL (Zeiss) inverted microscope equipped with a LED light source (wLS-LG-MB, QImaging) and monochrome 12-bit camera (QIC-F-12-C, QImaging). The oxygen sensors were imaged with a 546±12 nm excitation filter and 590 nm long pass filter. Fluorescein was imaged using a 470±20 nm excitation filter and 540±40 nm emission filter.
Statistical analysis
Unless otherwise stated, all reported values are the average and standard error of the mean (SEM). Datasets were analyzed with GraphPad Prism® v.7.01: a two-way ANOVA with Tukey's multiple comparison post-test was used to compare different data sets. A p value of < 0.05 was considered significant.
Results and discussion
Constructing a paper-based colon tumor model
In poorly vascularized tumor tissue, mass transport limitations of nutrients and waste products lead to the development of stratified cell populations.32 Cells closest to the vasculature receive the supply of nutrients needed for proliferation, while cells further from the vasculature receive limited nutrients due to consumption outpacing diffusional delivery. Within these regions of depleted nutrients, cells adopt a quiescent phenotype or become necrotic. Chemotherapeutics that target proliferative cells by interfering with some aspect of the cell-cycle yield varying cellular responses in the stratified populations of a tumor.33 There is a need for an in vitro culture model that recapitulates the cellular heterogeneity found in tumors, but is as easily setup and analyzed as monolayer cultures. To mimic the diffusion-limited environment that gives way to population stratification in poorly vascularized tumors, we constructed PBCs of HCT116 mCHR cells suspended in Matrigel (Fig. 1).
We chose HCT116 cells because their response to various chemotherapeutics, including SN-38 used in this study, has been well characterized in both monolayer and spheroid cultures.9,11,19,34 Engineering the HCT116 cells to constitutively express mCherry allowed us to relate fluorescence intensity to viability, as mCherry fluorescence intensity and cell number are linearly related for HCT116 mCHR cells imaged on a Typhoon scanner (Fig. S2). We chose Whatman 105 filter paper to fabricate the paper scaffolds because it has a large void volume (∼80%) and low fiber density, allowing the scaffolds to readily retain the cell-laden Matrigel while still maintaining compatibility with fluorescence imaging.
The culture system used in this work is summarized in Figure 1. Of the 12 paper scaffolds, 11 were seeded with cells to ensure hypoxia was reached in the stack.35 The cell-free scaffold at the top of the stack provided a layer in which cells could expand into during incubation. A polycarbonate track etch membrane was placed at the top of the paper stack to retain cells in the paper scaffolds, ensuring that each culture was 360 μm thick. The PET films placed at the top and bottom of the culture allowed us to control diffusion of fresh medium into the culture and resulted in the formation of gradients along the stack. Stainless steel holders enclosed the entire culture and held the scaffolds together in conformal contact.
Proximity to a nutrient source affects spatiotemporal distribution of cells
Before evaluating drug resistance in the stacked cultures, we investigated the spatiotemporal evolution of viable HCT116 cells for culture periods of up to one week. Despite the linear trend between fluorescence intensity and number of mCHR-expressing cells under normoxic conditions (Fig. S2), we report viability in terms of mCHR fluorescence because environmental oxygen tensions can potentially attenuate mCherry expression. Specifically, hypoxic conditions have been shown to elicit a global down-regulation of protein synthesis.36 Change in protein expression can make direct comparisons to calibration curves relating cell number and mCherry fluorescence prepared under normoxic conditions difficult for cell populations experiencing different oxygen tensions. The collected images allowed us to make relative comparisons of spatial and temporal changes in viable cell populations for cultures incubated at 24-, 72-, 120-, and 168-h intervals (Fig. 2a).
Figure 2.
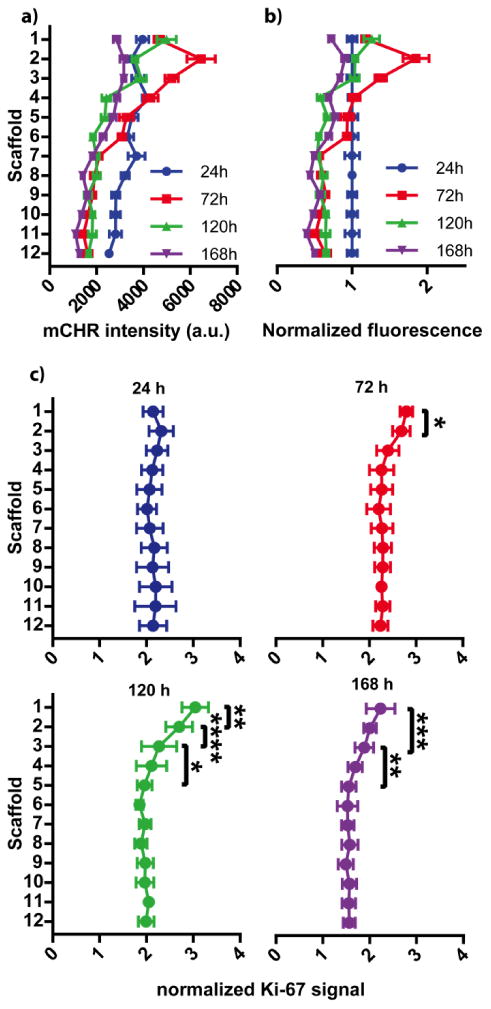
Stratification of viable and proliferative HCT116 cell populations after 24h, 72h, 120h, and 168h of incubation. In each graph, scaffold 1 is at the top of the stack and closest to the source of fresh medium. (a) mCHR fluorescence intensity was used to assess cellular viability in each scaffold of the stack, increased fluorescence correlates with increased viability. n = 14-29 replicate measurements, across multiple setups and cell passage numbers. (b) mCHR fluorescence intensities were normalized to the 24 h values to help visualize relative changes per scaffold over time. (c) Immunocytochemistry (Ki-67) was used to identify proliferative populations along the cultures. Fluorescence intensity of secondary labeled anti-Ki-67 antibodies were normalized to mCHR fluorescence intensity. Cells in the top 3 scaffolds exhibit increased Ki-67 expression after 24 h, indicating the presence of proliferative populations. n = 10-15 replicate measurements, across multiple setups and cell passage numbers. (* = p < 0.05, ** = p < 0.01, *** = p < 0.001, **** = p < 0.0001)
Increased periods of incubation resulted in notable changes in the distribution of viable cells (Fig. 2a). To help visualize relative changes in cell distributions across the multiple incubation intervals, we normalized the average fluorescence intensity of each incubation interval to the respective intensity at 24 h (Fig. 2b). From these data, three trends appear: i) cells in the first three scaffolds increase in number in the first 72 h, but experience a decrease in viability during the remainder of the incubation; ii) cells in scaffolds 4-6 remain static for the first 72 h, then decrease in viability; and iii) cells in scaffolds 7-12 decline in viability during the first 72 h, and remain static for the remainder of the incubation.
The rapid cellular growth followed by a decline in viability in the first three scaffolds is likely due to temporal imbalances between nutrient supply and cellular consumption. In the first 72 h, this region's close proximity to the nutrient-rich medium allows cells to rapidly proliferate. After 72 h, we speculate that the rate of consumption outpaces diffusional delivery of nutrients, and that the observed decrease in viability is due to this nutrient shortage.
The temporal changes in viable cell populations within scaffolds 4-6 further support our hypothesis above. Within the first 72 h of the incubation, cell populations in scaffolds 4-6 had stable fluorescence intensities, suggesting that adequate nutrients were reaching this region. After 72 h, scaffolds 4-6 had a decrease in fluorescence intensity, reaching values similar to those measured in scaffolds 7-12. The similarity in fluorescence intensities suggests these regions are experiencing similar levels of nutrient restriction. Experiments mapping glucose concentrations throughout spheroids showed minimal glucose penetration into a spheroid after 120 μm.37 This distance corresponds to scaffold 4 in the stacked culture, and further supports that nutrient consumption within scaffolds 1-3 is limiting nutrient supply to lower layers.
Proliferative populations occur within 90 μm of the nutrient source
To confirm the presence of proliferative subpopulations in the stacked culture, we stained individual scaffolds for Ki-67 after 24, 72, 120, and 168 h of incubation (Fig. 2c). We chose Ki-67 as it is a nuclear protein expressed during all stages of the cell cycle.38 Proliferative cell populations were identified within the first three scaffolds after 72, 120, and 168 h of incubation. This region matches the increased number of viable cells in the first 72 h. Despite the decrease in the number of viable cells between scaffolds 1-3 after 72 h of incubation, proliferation markers in this region persisted for up to 168 h. It is possible that cells in these layers continue to proliferate but at a rate that is slower than the rate of cellular death, explaining why total viability declines over time.
Cell populations in layers 4-12 of the stacked cultures have limited Ki-67 staining. This data, in combination with the mCHR fluorescence intensities, indicate that cells in these regions were viable but not proliferative. The combination of these observations suggests that these cells are likely in a quiescent state to accommodate the limited supply of nutrients within this region. We expect these cells to exhibit an increased resistance to therapeutic dosing which accompanies with the development of a quiescent phenotype.39
Oxygen gradients can be modulated with cell density
To better understand the environmental conditions within our PBCs, we incorporated oxygen sensors into the stacked cultures and quantified extracellular oxygen tensions in different regions. We chose to quantify oxygen as it directly regulates hypoxia-inducible transcription factors (HIFs), which promote cellular survival in nutrient deficient conditions,40 and the development of a chemoresistant phenotype.41,42 These transcription factors are constitutively expressed by cells but degraded under normal oxygen tensions (i.e., normoxia). Under low oxygen tensions (i.e., hypoxia, < 5 mmHg O2)—conditions commonly found in poorly vascularized tumor tissue—these factors are stabilized and affect transcription.41 By quantifying oxygen tensions across our cultures, we can spatially relate cellular responses to the oxygen environment experienced by those cells.
The oxygen sensors used in this study were easily integrated into PBCs by simply placing them at the bottom of the PBC in lieu of the closed PET film in Figure 1. These sensors were previously used to map the formation of oxygen gradients in PBCs with channel-type cultures.43 These sensors are selective to molecular oxygen and highly sensitive at low oxygen tensions, with a resolution of 0.5 mmHg O2 for measurements below 10 mmHg O2.20 In the stacked PBCs oxygen gradients run normal to the sensor, limiting our measurements to a single point along the gradient. This limitation was overcome by preparing a number of stacked cultures with either 1, 4, 8, or 12 scaffolds, and using each of the readings to estimate the gradient formed across an entire culture with 12 scaffolds. In our setup, the luminescence intensity of the sensors was recorded with an inverted microscope and converted to oxygen tension using a Stern-Volmer relationship.
We measured the spatiotemporal evolution of oxygen gradients in 12-scaffold cultures seeded at two cell densities: 84,000 cells/zone, and 21,000 cells/zone. The oxygen measurements of the culture with 84,000 cells/zone confirm the presence of a steep oxygen gradient, with widespread hypoxia across all scaffolds and time points (Fig. 3). Figure S3 provides a graphical summary of the average oxygen tension and standard deviation values for each culture. Previous studies measuring oxygen gradients in tumor xenografts found that oxygen penetrates ∼50 μm into tissue before reaching hypoxia,44 so it was unexpected that these cultures would reach hypoxia in less than 30 μm from the oxygen source. We note that the track etch membranes placed at the top of cultures can act as a mass transport barrier and attenuate oxygen flux into the PBCs, resulting in steeper oxygen gradients than expected.
Figure 3.
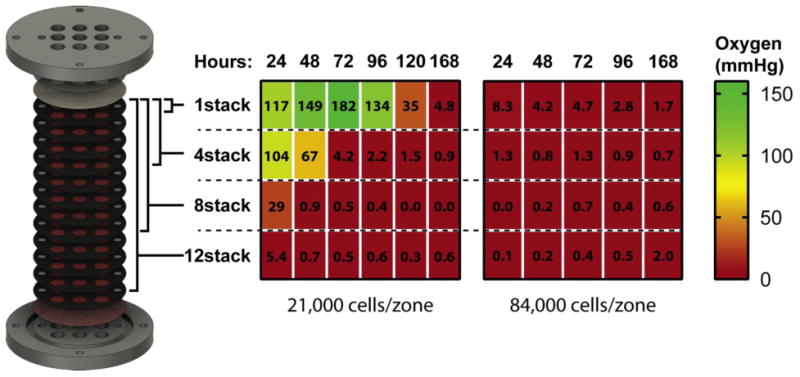
Mapping oxygen tension along stacked cultures containing different cell densities: 21,000 cells/zone (left) and 84,000 cells/zone (right). Oxygen sensors were placed at the bottom of cultures composed of 1-, 4-, 8-, and 12-stacked scaffolds. The corresponding heat maps and values represent the average oxygen tension at the bottom of these cultures, with green representing atmospheric oxygen tensions (160 mmHg) and red representing hypoxia (< 5 mmHg). n=5 replicate measurements, obtained from a single setup.
Despite the cultures experiencing similar oxygen tensions across all scaffolds, we still observed spatial differences in proliferative cell populations. These differences indicate that nutrients other than oxygen were also affecting cellular stratification. Glucose gradients could explain the spatial differences in proliferation we observed, as this molecule has been shown to penetrate further into avascular tumorous tissue than oxygen.45 Additionally, HCT116 cells under hypoxic conditions have increased glycolytic activity via HIF-1α expression, allowing them to continue to proliferate despite a limited supply of oxygen.46
An advantage of the PBCs over spheroids is the ability to modulate the density of cells in each scaffold. Seeding PBCs at 21,000 cells/zone lowered overall cellular consumption and permitted oxygen to penetrate ∼240 μm (Fig. 3). At this density, a 1-scaffold culture took 120 h to reach hypoxia, while a 4-scaffold culture took 72 h. By further modulating the cell density, we would expect oxygen penetration to change accordingly, allowing us to readily control the steepness and duration of these gradients. Additional chemical sensors capable of measuring nutrient, pH, and waste products are needed to corroborate the evolution of these gradients.
Different chemical conditions yield different chemoresistances
The ability to manipulate local chemical gradients in the stacked cultures allowed us to investigate how the chemical environment contributes to regional differences in phenotype and chemoresistance. To measure the drug sensitivity of HCT116 cells in 12-scaffold cultures, we exposed cultures seeded with two different cell densities (84,000 or 21,000 cells/zone) to varying concentrations of SN-38. SN-38 is a topoisomerase I inhibitor and the active metabolite of irinotecan, which is commonly used in combination therapies for colorectal cancer.47 In these experiments, cultures were incubated for 24 h before being exposed to SN-38. After 48 h of dosing, the cultures were disassembled and mCHR fluorescence intensities were measured. Relative chemoresistance in each scaffold was determined by comparing the fluorescence intensity of SN-38 dosed scaffolds to the fluorescence intensity of scaffolds exposed to the vehicle.
Prior to performing the chemoresistance assays, we characterized: i) penetration of fluorescein, an SN-38 substitute, into the stacked cultures, and ii) the response of HCT116 mCHR cells to increasing doses of SN-38 in 3D and monolayer cultures. Small-molecule penetration into the stacked cultures was assessed to ensure that differences in relative chemoresistance can be attributed to drug interactions rather than inaccessibility to SN-38. To estimate the penetration of SN-38 throughout the stacked culture, we substituted sodium fluorescein for SN-38. We chose fluorescein because it can be easily measured using fluorescence microscopy and possesses a diffusion coefficient similar to an SN-38 analogue.48,49 For this assay, a 0.5 mg/mL solution of fluorescein was added to the top of a 12-scaffold PBC seeded at a density of 84,000 cells/zone. We recorded the fluorescence intensity at the bottom of a culture over a period of 11 hours (Figure S4). A detailed experimental protocol for these penetration studies is provided in the ESI. After ∼350 minutes the fluorescein signal became static, indicating that equilibrium had been reached throughout the culture. These data suggest that the top of the culture will see increased concentrations of SN-38 relative to the bottom scaffolds for the first 350 minutes of dosing, ∼13% of the total incubation time. Additionally, HCT116 cells suspended in a 3D matrix have doubling times of approximately 74 hours, which means that cells will likely experience the full SN-38 concentration before completing a division.50
We determined the potency (half maximal inhibitory concentration, IC50) of SN-38 for well-oxygenated HCT116 mCHR cells cultured in single-zone paper scaffolds and monolayers. While previous studies have already characterized the IC50 of SN-38 for HCT116 cells in 2D cultures, these values range three orders of magnitude (50 - 0.5 nM) making comparisons with literature values difficult.34,51 The IC50 value for the HCT116 cells in the paper scaffolds (0.014 ± 0.006 μM) was much higher than for monolayer cultures (0.005 ± 0.001 μM). These data are summarized in Figure S5. These results support previous findings that 2D cultures often overestimate the potency and efficacy of chemotherapeutics relative to 3D cultures and by extension, in vivo tumors.4
To assess regional chemoresistance in stacked PBCs, 12-scaffold cultures were dosed with increasing concentrations of SN-38: 0.014 μM, 0.14 μM, or 1.4 μM, representing 1×, 10×, or 100× of the 3D IC50 value. A vehicle control of 0.1% (v/v) DMSO in medium was also included in this assay. Fluorescence measurements from the chemoresistance assay show distinct differences in regional responses between scaffolds at different SN-38 dosages (Figure 4). A table outlining statistical comparisons between dosages is provided in the ESI (Table S1).
Figure 4.
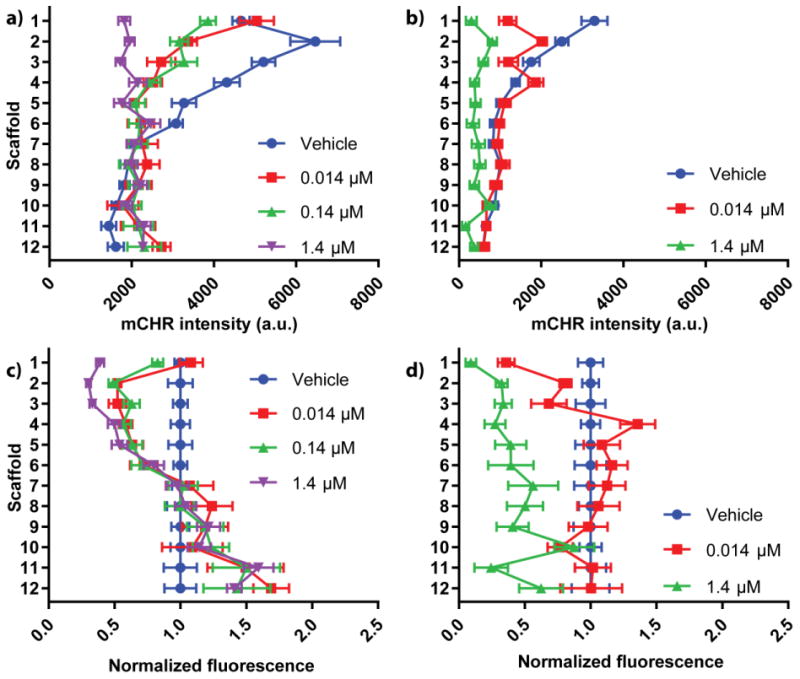
Density-dependent responses to SN-38 dosing. Stacked PBCs were seeded with either (a) 84,000 cells/zone or (b) 21,000 cells/zone and dosed with increasing concentrations of SN-38. The viability at each zone was measured using fluorescence imaging and compared to vehicle controls. mCHR fluorescence intensities were normalized to the 24 h values of the (c) 84,000 cells/zone and (d) 21,000 cells/zone cultures to help visualize relative changes for each dosage. n = 15 replicate measurements, across multiple setups and cell passage numbers.
Cultures seeded with 84,000 cells/zone and dosed with 0.014 μM or 0.14 μM SN-38 had a significant decrease in viable cells between scaffolds 2-5. The decrease in viability was expected for scaffold 2 based on the Ki-67 staining; however, SN-38's effectiveness was less predictable for scaffolds 3-5 due to the limited proliferation measured within this region. This sensitivity to SN-38 in the non-proliferative region can be explained by SN-38's ability to inhibit HIF-1α expression.52 While the mechanism is not well understood, increasing concentrations of SN-38 decrease levels of HIF-1α in the colorectal carcinoma cell lines HT29 and SW480. A similar dose-response relationship could be happening in our cultures. The attenuation of HIF-1α accumulation via SN-38 should decrease the induction of antiapoptotic pathways in the HCT116 mCHR cells between scaffolds 3-5, decreasing their overall chemoresistance.
Chemoresistance assays for 0.014 μM and 1.4 μM SN-38 were also performed on stacked cultures containing 21,000 cells/zone. From these data, there is a clear trend between the 0.014 μM SN-38 and the vehicle data, as scaffolds 2-12 were statistically similar. A table outlining statistical comparisons between all dosages is provided in the ESI (Table S2). The only significant difference between the vehicle and 0.014 μM SN-38 data sets was the first scaffold, in which 0.014 μM SN-38 had significantly fewer viable cells. The similarity in viable cells between scaffolds 2-12 suggests that cells further from the medium source exhibit increased chemoresistance.
Dosing the cultures seeded with different cell densities showed distinctly different trends: cells in the first scaffold were responsive to SN-38 at low-densities but not at high-densities. Additionally, cells deeper in the high-density culture were responsive to SN-38 dosing while cells in the low-density cultures were not. The disparity in these results highlight the shifting relationship between cancer chemoresistance and local chemical environment, and show the need for a model capable of accounting for environmental components when assessing chemotherapeutic effectiveness.
Conclusion
This work utilized stacked PBCs to relate chemoresistance of colorectal carcinoma cells to their local chemical environment. In these assemblies, monotonic gradients of nutrients and waste are formed across the stacked culture, providing a range of chemical environments that vary for each scaffold. By modulating the cell density of these PBCs, we can experimentally manipulate the spatiotemporal evolution of these gradients to suit experimental needs. We incorporated oxygen sensors into the cultures seeded with different cells densities to demonstrate this control, and found shallower oxygen gradients in cultures with lower cell densities. Cultures seeded at different cell densities were also dosed with SN-38. Interestingly, we found a significantly higher response to SN-38 dosing in high-density cultures experiencing hypoxia. The difference in response between these densities demonstrate the modularity of PBCs and their ability to easily assess spatial relationships between chemical environments and chemoresistance.
While there are a number of 3D culture platforms to assess chemotherapeutic effectiveness in vitro, the ability to i) manipulate the chemical environment in situ, and ii) easily section cultures into discrete layers, makes PBCs a promising analytical tool for screening therapeutics. The cultures described in this work used one cell line and one chemotherapeutic agent; however, the modularity of this platform allows cell lines and therapeutics to easily be interchanged or combined into a single assay. Additional biomarkers other than Ki-67 can also be investigated to relate specific phenotypic changes in the presence and absence of therapeutics. This work will serve as the first in a series of studies that focus on developing PBCs as a platform for screening therapeutics.
Supplementary Material
Acknowledgments
MRL and MWB were supported by the University of North Carolina and Eli Lilly and Company. MWB was also supported by Eastman Chemical Company. GJL and ABH were supported by the National Institutes of Health (R01GM110406). ABH was also supported by National Science Foundation (CAREER Award, CHE-1351595). We would like to thank the Chapel Hill Analytical and Nanofabrication Laboratory for access to their clean room facility and spin-coating equipment, and Zhi-Wei Lin for preparing all the paper scaffolds used for this study.
References
- 1.Breslin S, O'Driscoll L. Drug Discov Today. 2013;18:240–249. doi: 10.1016/j.drudis.2012.10.003. [DOI] [PubMed] [Google Scholar]
- 2.Edmondson R, Broglie JJ, Adcock AF, Yang L. Assay Drug Dev Technol. 2014;12:207–18. doi: 10.1089/adt.2014.573. [DOI] [PMC free article] [PubMed] [Google Scholar]
- 3.Imamura Y, Mukohara T, Shimono Y, Funakoshi Y, Chayahara N, Toyoda M, Kiyota N, Takao S, Kono S, Nakatsura T, Minami H. Oncol Rep. 2015;33:1837–1843. doi: 10.3892/or.2015.3767. [DOI] [PubMed] [Google Scholar]
- 4.Karlsson H, Fryknäs M, Larsson R, Nygren P. Exp Cell Res. 2012;318:1577–1585. doi: 10.1016/j.yexcr.2012.03.026. [DOI] [PubMed] [Google Scholar]
- 5.Hakkinen KM, Harunaga JS, Doyle AD, Yamada KM. Tissue Eng Part A. 2011;17:713–24. doi: 10.1089/ten.tea.2010.0273. [DOI] [PMC free article] [PubMed] [Google Scholar]
- 6.Luca AC, Mersch S, Deenen R, Schmidt S, Messner I, Schäfer KL, Baldus SE, Huckenbeck W, Piekorz RP, Knoefel WT, Krieg A, Stoecklein NH. PLoS One. 2013;8 doi: 10.1371/journal.pone.0059689. [DOI] [PMC free article] [PubMed] [Google Scholar]
- 7.Friedrich J, Seidel C, Ebner R, Kunz-Schughart LA. Nat Protoc. 2009;4:309–324. doi: 10.1038/nprot.2008.226. [DOI] [PubMed] [Google Scholar]
- 8.Katt ME, Placone AL, Wong AD, Xu ZS, Searson PC. Front Bioeng Biotechnol. 2016;4:12. doi: 10.3389/fbioe.2016.00012. [DOI] [PMC free article] [PubMed] [Google Scholar]
- 9.Liu X, Weaver EM, Hummon Amanda B. Anal Chem. 2013;85:6295–6302. doi: 10.1021/ac400519c. [DOI] [PMC free article] [PubMed] [Google Scholar]
- 10.Liu X, Hummon AB. Sci Rep. 2016;6:38507. doi: 10.1038/srep38507. [DOI] [PMC free article] [PubMed] [Google Scholar]
- 11.LaBonia GJ, Lockwood SY, Heller AA, Spence DM, Hummon AB. Proteomics. 2016;16:1814–1821. doi: 10.1002/pmic.201500524. [DOI] [PMC free article] [PubMed] [Google Scholar]
- 12.Grimes DR, Kelly C, Bloch K, Partridge M. J R Soc Interface. 2014;11:20131124. doi: 10.1098/rsif.2013.1124. [DOI] [PMC free article] [PubMed] [Google Scholar]
- 13.Hirschhaeuser F, Menne H, Dittfeld C, West J, Mueller-Klieser W, Kunz-Schughart LA. J Biotechnol. 2010;148:3–15. doi: 10.1016/j.jbiotec.2010.01.012. [DOI] [PubMed] [Google Scholar]
- 14.Lin RZ, Chang HY. Biotechnol J. 2008;3:1172–1184. doi: 10.1002/biot.200700228. [DOI] [PubMed] [Google Scholar]
- 15.Sutherland RM, Sordat B, Bamat J, Gabbert H, Bourrat B, Mueller-Klieser w. Cancer Res. 1986;46:5320–5329. [PubMed] [Google Scholar]
- 16.Schroll MM, Liu X, Herzog SK, Skube SB, Hummon AB. Nutr Res. 2016;36:1068–1080. doi: 10.1016/j.nutres.2016.08.002. [DOI] [PMC free article] [PubMed] [Google Scholar]
- 17.Kunz-Schughart L, Freyer J, Hofstaedter F, Ebner R. J Biomol Screen. 2004;9:273–285. doi: 10.1177/1087057104265040. [DOI] [PubMed] [Google Scholar]
- 18.Pampaloni F, Reynaud EG, Stelzer EHK. Nat Rev Mol Cell Biol. 2007;8:839–845. doi: 10.1038/nrm2236. [DOI] [PubMed] [Google Scholar]
- 19.Liu X, Hummon AB. J Am Soc Mass Spectrom. 2015;26:577–586. doi: 10.1007/s13361-014-1071-0. [DOI] [PMC free article] [PubMed] [Google Scholar]
- 20.Boyce MW, Kenney RM, Truong AS, Lockett MR. Anal Bioanal Chem. 2016;408:2985–2992. doi: 10.1007/s00216-015-9189-x. [DOI] [PubMed] [Google Scholar]
- 21.Truong AS, Lochbaum CA, Boyce MW, Lockett MR. Anal Chem. 2015;87:11263–11270. doi: 10.1021/acs.analchem.5b02362. [DOI] [PubMed] [Google Scholar]
- 22.Truong AS, Lockett MR. Analyst. 2016:3874–3882. doi: 10.1039/c6an00630b. [DOI] [PubMed] [Google Scholar]
- 23.Kenney RM, Boyce MW, Truong AS, Bagnell CR, Lockett MR. Analyst. 2015;141:661–668. doi: 10.1039/c5an01787d. [DOI] [PubMed] [Google Scholar]
- 24.Rodenhizer D, Gaude E, Cojocari D, Mahadevan R, Frezza C, Wouters BG, McGuigan AP. Nat Mater. 2016;15:227–34. doi: 10.1038/nmat4482. [DOI] [PMC free article] [PubMed] [Google Scholar]
- 25.Mosadegh B, Lockett MR, Minn KT, Simon KA, Gilbert K, Hillier S, Newsome D, Li H, Hall AB, Boucher DM, Eustace BK, Whitesides GM. Biomaterials. 2015;52:262–271. doi: 10.1016/j.biomaterials.2015.02.012. [DOI] [PubMed] [Google Scholar]
- 26.Camci-Unal G, Newsome D, Eustace BK, Whitesides GM. Adv Healthc Mater. 2016;5:641–647. doi: 10.1002/adhm.201500709. [DOI] [PubMed] [Google Scholar]
- 27.Mosadegh B, Dabiri BE, Lockett MR, Derda R, Campbell P, Parker KK, Whitesides GM. Adv Heal Mater. 2014;3:1036–1043. doi: 10.1002/adhm.201300575. [DOI] [PMC free article] [PubMed] [Google Scholar]
- 28.Derda R, Laromaine A, Mammoto A, Tang SKY, Mammoto T, Ingber DE, Whitesides GM. Proc Natl Acad Sci U S A. 2009;106:18457–18462. doi: 10.1073/pnas.0910666106. [DOI] [PMC free article] [PubMed] [Google Scholar]
- 29.Deiss F, Mazzeo A, Hong E, Ingber DE, Derda R, Whitesides GM. Anal Chem. 2013;85:8085–8094. doi: 10.1021/ac400161j. [DOI] [PMC free article] [PubMed] [Google Scholar]
- 30.Lloyd CC, Boyce MW, Lockett MR. Curr Protoc Chem Biol. 2017;9:1–20. doi: 10.1002/cpch.22. [DOI] [PubMed] [Google Scholar]
- 31.Schneider Ca, Rasband WS, Eliceiri KW. Nat Methods. 2012;9:671–675. doi: 10.1038/nmeth.2089. [DOI] [PMC free article] [PubMed] [Google Scholar]
- 32.Minchinton AI, Tannock IF. Nat Rev Cancer. 2006;6:583–592. doi: 10.1038/nrc1893. [DOI] [PubMed] [Google Scholar]
- 33.Mitchison TJ. Mol Biol Cell. 2012;23:1–6. doi: 10.1091/mbc.E10-04-0335. [DOI] [PMC free article] [PubMed] [Google Scholar]
- 34.Jensen NF, Agama K, Roy A, Smith DH, Pfister TD, Romer MU, Zhang HL, Doroshow JH, Knudsen BR, Stenvang J, Brunner N, Pommier Y. J Exp Clin Cancer Res. 2016;35:56. doi: 10.1186/s13046-016-0335-x. [DOI] [PMC free article] [PubMed] [Google Scholar]
- 35.Colom A, Galgoczy R, Almendros I, Xaubet A, Farré R, Alcaraz J. J Biomed Mater Res - Part A. 2014;102:2776–2784. doi: 10.1002/jbm.a.34946. [DOI] [PubMed] [Google Scholar]
- 36.Koumenis C, Naczki C, Koritzinsky M, Rastani S, Diehl A, Sonenberg N, Koromilas A, Wouters BG. Mol Cell Biol. 2002;22:7405–16. doi: 10.1128/MCB.22.21.7405-7416.2002. [DOI] [PMC free article] [PubMed] [Google Scholar]
- 37.Milotti E, Chignola R. PLoS One. 2010;5 doi: 10.1371/journal.pone.0013942. [DOI] [PMC free article] [PubMed] [Google Scholar]
- 38.Scholzen T, Gerdes J. J Cell Physiol. 2000;182:311–322. doi: 10.1002/(SICI)1097-4652(200003)182:3<311::AID-JCP1>3.0.CO;2-9. [DOI] [PubMed] [Google Scholar]
- 39.Gordon RR, Nelson PS. Drug Resist Updat. 2012;15:123–131. doi: 10.1016/j.drup.2012.01.002. [DOI] [PMC free article] [PubMed] [Google Scholar]
- 40.Sullivan R, Graham CH. Cancer Metastasis Rev. 2007;26:319–331. doi: 10.1007/s10555-007-9062-2. [DOI] [PubMed] [Google Scholar]
- 41.Sullivan R, Paré GC, Frederiksen LJ, Semenza GL, Graham CH. Mol Cancer Ther. 2008;7:1961–1973. doi: 10.1158/1535-7163.MCT-08-0198. [DOI] [PubMed] [Google Scholar]
- 42.Semenza GL. Trends Pharmacol Sci. 2013;33:207–214. doi: 10.1016/j.tips.2012.01.005. [DOI] [PMC free article] [PubMed] [Google Scholar]
- 43.Boyce MW, Kenney RM, Truong AS, Lockett MR. Anal Bioanal Chem. 2015:1–8. doi: 10.1007/s00216-015-9189-x. [DOI] [PubMed] [Google Scholar]
- 44.Helmlinger G, Yuan F, Dellian M, Jain RK. Nat Med. 1997;3:177–82. doi: 10.1038/nm0297-177. [DOI] [PubMed] [Google Scholar]
- 45.Gatenby RA, Gillies RJ. Nat Rev Cancer. 2004;4:891–899. doi: 10.1038/nrc1478. [DOI] [PubMed] [Google Scholar]
- 46.Dang DT, Chen F, Gardner LB, Cummins JM, Rago C, Bunz F, Kantsevoy SV, Dang LH. Cancer Res. 2006;66:1684–1693. doi: 10.1158/0008-5472.CAN-05-2887. [DOI] [PubMed] [Google Scholar]
- 47.Wallin A, Svanvik J, Holmulund B, Ferreud L, Sun XF. Oncol Rep. 2008;19:1493–8. [PubMed] [Google Scholar]
- 48.Kunadharaju S, Savva M. J Chem Eng Data. 2010;55:103–112. [Google Scholar]
- 49.Culbertson CT, Jacobson SC, Michael Ramsey J. Talanta. 2002;56:365–373. doi: 10.1016/s0039-9140(01)00602-6. [DOI] [PubMed] [Google Scholar]
- 50.Fang JY, Tan SJ, Wu YC, Yang Z, Hoang BX, Han B. J Transl Med. 2016;14:38. doi: 10.1186/s12967-016-0798-8. [DOI] [PMC free article] [PubMed] [Google Scholar]
- 51.Niizuma S, Tsukazaki M, Suda H, Murata T, Ohwada J, Ozawa S, Fukuda H, Murasaki C, Kohchi M, Morikami K, Yoshinari K, Endo M, Ura M, Tanimura H, Miyazaki Y, Takasuka T, Kawashima A, Nanba E, Nakano K, Ogawa K, Kobayashi K, Okabe H, Umeda I, Shimma N. Bioorganic Med Chem Lett. 2009;19:2018–2021. doi: 10.1016/j.bmcl.2009.02.031. [DOI] [PubMed] [Google Scholar]
- 52.Murono K, Tsuno NH, Kawai K, Sasaki K, Hongo K, Kaneko M, Hiyoshi M, Tada N, Nirei T, Sunami E, Takahashi K, Kitayama J. Anticancer Res. 2012;32:865–872. [PubMed] [Google Scholar]
Associated Data
This section collects any data citations, data availability statements, or supplementary materials included in this article.