

Abstract
Glycine (Gly) is implicated in several neurological disorders, including malignant brain tumors. Precise measurement of Gly is challenging largely due to the spectral overlap with myo-inositol (mI). We report a new triple-refocusing sequence for reliable co-detection of Gly and mI at 3T and evaluation of Gly in healthy and tumorous brain. The sequence parameters were optimized with density-matrix simulations and phantom validation. With a total TE of 134 ms, the sequence gave complete suppression of mI signal between 3.5 and 3.6 ppm and consequently well-defined Gly (3.55 ppm) and mI (3.64 ppm) peaks. In-vivo 1H MRS data were acquired from the gray-matter (GM) dominant medial-occipital and white-matter (WM) dominant left-parietal regions in six healthy subjects and analyzed with LCModel using in-house calculated basis spectra. Tissue segmentation was performed to obtain the GM and WM contents within the MRS voxels. Metabolites were quantified with reference to GM-rich medial occipital total creatine at 8 mM. The Gly and mI concentrations were estimated to be 0.63±0.05 and 8.6±0.6 mM for medial occipital and 0.34±0.05 and 5.3±0.8 mM for left parietal, respectively. From linear regression of the metabolite estimates versus fractional GM content, the concentration ratio between pure GM and pure WM was estimated as 2.6 and 2.1 for Gly and mI, respectively. Clinical application of the optimized sequence was performed in four subjects with brain tumor. The Gly levels in tumors were higher compared to healthy brain. Gly elevation was more extensive in a post-contrast enhancing region than in a non-enhancing region. Data indicated that the optimized triple-refocusing sequence may provide reliable co-detection of Gly and mI and alterations of Gly in brain tumors can be precisely evaluated.
Keywords: Glycine (Gly), 1H MRS, 3T, Triple refocusing, Human brain, Gray matter, White matter, Glioma
Graphical abstract
We report evaluation of concentration difference of glycine (Gly) between gray and white matter in healthy brain and elevation of Gly in brain tumors, using a new triple-refocusing sequence that enables reliable co-detection of Gly and myo-inositol at 3T. Gly was estimated to be 2.5-fold higher in pure gray matter than in white matter. Gly elevation was extensive in aggressive tumors. Detection of marked elevation of Gly in a brainstem lesion helped make a radiographical decision on tumor aggressiveness.
INTRODUCTION
Glycine (Gly), a non-essential amino acid, exerts inhibitory action via chloride-permeable ion channels (1) and also functions as a co-agonist at the excitatory N-methyl-D-aspartate (NMDA) receptors in the central nervous system (2). Abnormal levels of Gly are implicated in neuropsychiatric disorders (2,3). Elevated levels of glycine have been reported in central neurocytomas and glycine encephalopathy (4,5). Also, Gly is elevated in malignant brain tumors and thus may be a biomarker of aggressiveness (6–11). Recent metabolic profiling studies have reported that Gly consumption and synthesis are correlated with rapid cancer cell proliferation, suggesting the role of Gly in tumor cell metabolic reprogramming (12,13). The capability to analyze human brain Gly noninvasively in vivo is therefore of high clinical significance.
The Gly singlet from two uncoupled protons resonating at 3.55 ppm is obscured by the four J-coupled resonances of myo-inositol (mI) at 3.61 and 3.52 ppm (14). For short-TE MRS at 3T, the Gly signal appears on top of the largest peak of mI for linewidth larger than 3 Hz, and thus separation between Gly and mI is often elusive when mI is present at much higher concentrations than the Gly level in vivo. Many prior studies exploited the J coupling difference between Gly and mI for detection of Gly. In measurements of Gly by PRESS (point-resolved spectroscopy) TE-averaging at 4T (15) and long-TE (160 ms) PRESS at 3T (9), the Gly signal was detected as a shoulder signal on the larger mI multiplet in healthy brain. Improved suppression of mI signal in the proximity of the Gly resonance was achieved at 3T by means of triple refocusing (16), but use of a very long TE (~200 ms) resulted in large T2 signal loss and measurement of mI was hampered due to extensive suppression of all mI resonances.
The resonances of mI that interfere with Gly detection are strongly coupled and thus the coherences evolve with time in complex manners. This suggests that the mI spin coherence evolution can be effectively manipulated by changing radio-frequency (RF) pulses as well as the inter-RF pulse time delays, as shown in a prior study for other strongly-coupled spin systems (17). Gly in the human brain may be notably different between gray matter (GM) and white matter (WM), as shown in prior MRS studies (11,18). Tumors do not contain GM or WM tissue type. This complicates evaluation of Gly abnormality in tumors in that the measurement may need to be compared with that from a normal-appearing contralateral region and/or from a region in healthy subjects whose location is similar to the tumor location.
In this study, we demonstrate high-fidelity glycine detection in healthy brain and tumors using a new Gly-optimized triple-refocusing scheme at 3T. The duration of a non-slice selective 180° pulse and the three subecho times of the triple refocusing sequence were optimized, with numerical simulation and phantom validation, for co-detection of Gly and mI in the human brain. The method was used to evaluate regional variation of Gly in the posterior brain of healthy volunteers. In addition, Gly measurements from four patients with brain tumor using the optimized sequence are presented.
METHODS
Density-matrix simulations were performed to find the triple-refocusing sequence parameters for co-detection of Gly and mI. The sequence had three 180° RF pulses following a 90° excitation RF pulse (Figure 1A). The 90° pulse and the first and third 180° pulses were slice selective while the second 180° was non-slice selective (NS180). Volume localization RF pulses included a 9.8 ms long 90° pulse with bandwidth (at half amplitude) of 4.2 kHz and two 13.2 ms long 180° pulses with bandwidth of 1.3 kHz, at an RF field strength (B1) of 13.5 µT. The simulation was performed for 17 durations of NS180, which ranged from 14 ms to 30 ms with 1 ms increments (bandwidth 1160 to 540 Hz). For the mI spin system with 6 coupled protons, a transformation matrix (size 22×6×22×6) was created for each of the slice-selective and non-slice selective RF pulses and used for calculating the density-operator evolution during the triple refocusing sequence, similarly as described in a prior study (17,19,20). The slice selection was simulated with 200 isochromats, each size being 1% with respect to the slice thickness (i.e., 0.01 = sample length / number of isochromats / slice thickness). The carrier frequency was set to 2.8 ppm for all RF pulses. The spectrum of mI was numerically calculated for various NS180 durations and various subecho time sets (TE1, TE2, TE3), whose total echo time ranged from minimum possible value to 150 ms. Here the minimum subecho times were TE1 = 26 ms, TE2 = NS180 duration, and TE3 = 20 ms for given spoiling gradients. Each of the subecho times was incremented by 1 ms in the spectral simulation. An NS180 duration and subecho time set that gives minimum absolute value of phase-corrected mI signal between 3.5 and 3.6 ppm was searched for using mI spectra broadened to a singlet FWHM of 5 Hz. Published chemical shift and J coupling constants were used for the simulations (14). The computer simulation was in-house programmed with Matlab (The MathWorks, Inc., Natick, MA).
Figure 1.

(a) Schematic diagram of the Gly-optimized triple-refocusing sequence. The 90° pulse (9.8 ms; BW = 4.2 kHz) and the first and third 180° pulses (13.2 ms; BW = 1.3 kHz) were slice selective while the second 180° was non-slice selective (NS180; 23 ms long). The three subecho time set used for Gly detection was (TE1, TE2, TE3) = (36, 28, 70) ms, the total TE being 134 ms. Slice selective gradients are shown in brown and spoiling gradients in green (strength 32 mT/m, duration 2 ms, total slope duration 0.8 ms) (b) The refocusing profile of the 23 ms long NS180 pulse (BW = 722 Hz). The NS180 (and all localizing pulses) was tuned to 2.8 ppm, as indicated by a vertical line.
1H MR experiments were carried out on a whole-body 3T scanner (Philips Medical Systems, Best, The Netherlands), equipped with a whole-body coil for RF transmission and a 32-channel phased-array head coil for reception. In-vitro tests of the Gly-optimized triple-refocusing sequence were conducted on two aqueous solutions (pH = 7.2); one with mI (53 mM) and Cr (5 mM) and the other with mI (53 mM), Cr (5 mM) and Gly (5 mM). Data were acquired, with TR = 9 s and TE = 134 ms, from a 20×20×20 mm3 voxel at the center of the phantom sphere (6 cm diameter).
In-vivo scans were carried out in 6 healthy subjects (3 female and 3 male, mean age 28±2 years) using the optimized triple-refocusing sequence. The protocol was approved by the Institutional Review Board of the University of Texas Southwestern Medical Center. Written informed consent was obtained from patients prior to the scans. MR spectra were obtained from the medial occipital GM dominant and left parietal WM dominant regions (voxel size of 23×23×23 mm3 (= 12.2 mL) and 35×23×15 mm3 (= 12.1 mL), respectively). MRS acquisition parameters included TR = 2 s, sweep width = 2.5 kHz, number of sampling points = 2048, and number of signal averages (NSA) = 128. Water suppression was obtained with a vendor-supplied four-pulse variable-flip-angle scheme. First and second order shimming was carried out, using the fast automatic shimming technique by mapping along projections (FASTMAP) (21). A 128-step RF phase cycling scheme, which had 4 orthogonal phases of the RF pulses. Triple-refocused unsuppressed water was acquired from the voxel for eddy current compensation and multi-channel combination. In addition, unsuppressed water was obtained with short-TE (14 ms) STEAM and TR = 2 s. The carrier frequencies of the RF pulses were all set at 2.8 ppm. 3D sagittal T1-weighted imaging was acquired with 1×1×1 mm3 resolution.
The data from the 32 channels were combined off-line, using an in-house Matlab script which was developed according to a published algorithm (22). The combined data were then filtered with a 1-Hz exponential function prior to subsequent analysis, similarly as in prior studies (9,16). Spectral fitting was performed with LCModel software (Ver 6.2F) (23), using numerically-calculated basis spectra of 19 metabolites, which included Gly, mI, Glu (glutamate), Gln (glutamine), GABA (γ-aminobutyric acid), NAA (N-acetylaspartate), NAAG (N-acetylaspartylglutamate), tCr (creatine + Phosphocreatine), Lac (lactate), Thr (threonine), GSH (glutathione), Ala (alanine), Asp (aspartate), Eth (ethanolamine), PE (phosphoethanolamine), sI (scyllo-inositol), Tau (taurine), Glc (glucose), tCho (glycerophosphocholine + phosphocholine). The basis spectra were calculated using the actual RF and gradient pulse waveforms of the triple-refocusing sequence. The spectral fitting was performed between 0.5 and 4.1 ppm. Cramer-Rao lower bound (CRLB) was returned as a percentage standard deviation (SD) by LCModel (24). The contents of GM, WM and cerebrospinal fluids (CSF) within the MRS voxels were obtained from segmentation of the T1-weighted images using Statistical Parametric Mapping software (SPM5) (25). The metabolite signal estimates from LCModel were normalized to the STEAM short-TE water from brain tissue (excluding the CSF water), and subsequently the metabolite concentrations were calculated by setting the mean tCr estimate of the medial occipital brain at 8 mM (26,27), assuming identical T2 between metabolites, similarly as in prior studies (9,18). To obtain the metabolite concentrations in pure GM and WM, the metabolite estimates from the voxels were fitted with a linear function of fractional GM content, fGM = GM/(GM+WM). Paired t-test was performed for comparison of metabolite estimates between groups. Data are presented in mean ± standard deviation.
Clinical application of the Gly-optimized triple-refocusing was performed in four subjects with brain tumors. Of the four patients, two had biopsy-proven medio-parietal oligoastrocytoma (grade III) and left-anterior glioblastoma (grade IV), and other two patients had radiographically-suggested malignant medio-parietal and brainstem gliomas. T2-weighted fluid-attenuated inversion recovery (T2-FLAIR) images were acquired to identify the tumor mass. MRS scans were carried out similarly as in healthy brain scans. The LCModel estimates of the metabolite signals were normalized to short-TE STEAM water and subsequently the metabolite concentrations were calculated using a multiplication factor, which was obtained from the medial-occipital data of the healthy brain.
RESULTS
Based on simulation results, a triple-refocusing scheme for Gly detection was finalized as NS180 duration of 23 ms and (TE1, TE2, TE3) = (36, 28, 70) ms. The 23 ms NS180 pulse had a bandwidth of 722 Hz at half amplitude, giving 99% refocusing of resonances between 0 and 5.3 ppm with a carrier frequency of 2.8 ppm (Figure 1B). The computer simulation indicated that, for the seventeen NS180 durations (14 – 30 ms), the mI signal between 3.5 and 3.6 ppm can be substantially suppressed with TE1 = 34 – 44 ms, TE2 = 28 – 32 ms, and TE3 = 66 – 71 ms (Supplementary Figure 1), for which the total TE is 132 – 143 ms. In addition, the NS180 duration itself had noticeable effects on the mI signal between 3.5 and 3.6 ppm, as expected (Supplementary Figure 2).
The Gly-optimized TE 143 ms triple refocusing scheme was validated in aqueous solutions. For a phantom with mI (53 mM) and Cr (5 mM), the mI multiplets were predominant in a short-TE STEAM spectrum (Figure 2A), as predicted by calculation. The largest peak of mI appeared at ~3.55 ppm, with amplitude greater by 6.3 fold than the Cr 3.03 ppm signal amplitude when the spectrum was broadened to Cr singlet FWHM at 5 Hz. Using the optimized triple refocusing, the large signal of mI was suppressed to essentially null and the spectral region between 3.5 – 3.6 ppm was nearly flat in both experiment and calculation (Figure 2B). The mI peak at 3.64 ppm was quite preserved. It is noteworthy that the width of this mI peak was about the same as a singlet linewidth (e.g., 6 vs. 5 Hz) and the up-field side of the signal was relatively steep, which may be favorable for Gly detection. We further tested the triple refocusing in a phantom with mI (53 mM), Cr (5 mM) and Gly (5 mM). In a short TE STEAM acquisition, the presence of a small Gly 3.55 ppm singlet on top of the large mI peak was not distinguishable (Figure 2C), the spectrum being apparently similar to the short-TE data from the mI+Cr phantom. With the complete suppression of the mI 3.55 ppm multiplet, the small Gly peak was readily discernible in the triple-refocused data (Figure 2D).
Figure 2.

In-vitro triple-refocused spectra from phantoms with mI and Cr and with mI, Cr and Gly, obtained with short-TE STEAM (TE = 14 ms and TM = 19 ms) and the Gly-optimized long-TE triple refocusing (TE = 134 ms), are shown together with calculated spectra. Note that the STEAM and triple-refocused spectra were each normalized to the Cr 3.03 ppm signal for direct comparison between triple refocusing and fully-refocused short-TE MRS. The spectra were broadened to an in-vivo linewidth at 3T (singlet FWHM = 5 Hz). For each spectrum a dashed horizontal line indicates the zero level.
An in-vivo spectra from the medial occipital (MO) and left parietal (LP) brain of a healthy volunteer are shown in Figure 3, together with spectral analysis results. The fractional GM content was 0.73 and 0.10 for the MO and LP voxels, respectively. With the substantial attenuation of macromolecule signals at TE = 134 ms, the spectra had fairly flat baselines and were well reproduced by the fit between 0.5 and 4.1 ppm. In each of the spectra, a signal was clearly discernible at 3.55 ppm and the spectral pattern between 3.5 – 3.7 ppm was quite similar to that in Figure 2D, suggesting that mI and Gly are largely responsible for the signals in the frequency range in vivo. The Gly signal was clearly discernible in the spectrum from the MO voxel (GM rich), whilst the spectrum from the WM-rich, LP region showed a relatively small signal at 3.55 ppm. The Gly concentration estimate was higher by approximately 2 fold in GM-than in WM-dominant regions. The Gly CRLB was 4% and 7% for the GM- and WM-dominant regions, respectively. The mI signal at 3.64 ppm was 1.3 fold greater in GM- than in WM-dominant region. The mI CRLB was 2 – 3% in both spectra. For validation purpose, LCModel fitting was undertaken with and without Gly in the basis set. In the fitting with Gly, the in vivo spectrum was well reproduced by the fit, leading to noise-level residuals at the Gly resonance (Residuals-1). When Gly was excluded from the fitting, residuals were clearly discernible at ~3.55 ppm (Residuals-2), indicating that the signal at 3.55 ppm in the in-vivo spectrum was primarily attributed to Gly.
Figure 3.

Spectral analyses of a pair of in-vivo triple refocused spectra from a healthy subject are presented together with voxel positioning in T1-weighted images (voxel size 23×23×23 and 35×23×15 mm3 for medial occipital and left parietal brain respectively; NSA = 128 and TR = 2 s for both regions). Spectra, normalized to GM+WM water, are shown with LCModel fits, residuals and baseline between 1.4 and 4.1 ppm. Residuals-1 and -2 were obtained from spectral fittings using basis sets with and without Gly, respectively. Dotted lines are drawn at the Gly resonance (3.55 ppm). The FWHM of the tCr 3.03 ppm peak, returned by LCModel, was 6.1 and 5.8 Hz for medial occipital and left parietal, respectively.
For each of MO and LP regions, the overall spectral pattern was similar between the six healthy subjects, indicating high reproducibility of the triple-refocusing MRS between subjects. The SNR and linewidth were similar between the regions. For spectra from the MO and LP voxels, the mean SNR of tNAA (~2 ppm) was 272±25 and 269±28, and the mean linewidth of tCr (3.03 ppm) was 6.1±0.2 and 5.8±0.2 Hz, respectively. Here, the SNR was the ratio of the tNAA singlet amplitude with respect to the SD of the with-Gly-fitting residuals between 3.3 and 3.8 ppm. A signal was clearly discernible at 3.55 ppm in all spectra, whose peak amplitude was overall larger in MO data than in LP data. The LCModel-returned Gly signal was larger in MO data than in LP data. The mean Gly SNR was 10.4±1.3 and 6.5±1.0 for MO and LP respectively, as calculated from LCModel-returned Gly peak amplitude and the residuals between 3.3 – 3.8 ppm. The residuals from without-Gly fitting were overall larger in spectra from MO than in the spectra from LP.
For the six healthy subjects of the present study, the mean contents of GM, WM, and CSF were estimated to be 0.60±0.04, 0.22±0.04, and 0.18±0.03 for MO, and 0.11±0.03, 0.88±0.03, and 0.01±0.01 for LP, respectively. The fractional GM content was then calculated as 0.73±0.05 and 0.11±0.03 for the MO and LP voxels, respectively. Gly was measurable with CRLB ≤ 8% in all 12 data sets. As shown in Table 1, the concentration of Gly was estimated to be 0.63±0.05 and 0.34±0.05 mM, with CRLB of 3–5% and 6–8%, for MO and LP, respectively. The estimates were significantly different (p < 5×10⁻⁶). From linear regression of the Gly estimates with respect to fGM, the Gly levels in pure GM and pure WM (i.e., Y-axis intercepts at fGM = 1 and 0) were estimated 0.76 and 0.29 mM, respectively. For mI, although the 3.55 ppm signal, which is the largest at short TE, was extensively suppressed, mI was well measurable from the 3.64 ppm signal in all data, with high precision (CRLB = 2 – 4%). The mI estimate was also significantly larger in MO than in LP (8.6±0.6 vs. 5.3±0.8 mM, p < 5×10⁻⁴) (Table 1), resulting in the pure-GM and pure-WM concentrations at 10.1 and 4.7 mM respectively (Figure 4). Also, the Glu estimate was significantly higher in MO than in LP (p < 6×10⁻⁵). Linear regression showed that the Glu level may be higher by more than 2 fold in pure GM than in pure WM. In contrast, NAAG showed negative correlation with fGM. The mean concentration of NAAG in the LP voxels was ~3 times higher than that in the MO voxels (2.9 vs. 1.1 mM). Linear regression gave the pure-WM to pure-GM concentration ratio as approximately 7. The NAA concentration was estimated to be significantly higher in MO than in LP (p < 2×10⁻³), giving a pure-GM to pure-WM concentration ratio as 1.4. The coefficient of determination (R2) was 0.79, the smallest among the cases in Figure 4. The tCr estimate in MO was significantly larger than that of LP (p < 2×10⁻⁴). The tCr levels in pure GM and pure WM was estimated as 9.1 and 4.8 mM, respectively.
Table 1.
The concentration estimates (mM) and CRLBs (%) of six metabolites are tabulated for the medial occipital (MO) and left parietal (LP) brain in six healthy subjects. The mean fractional GM content, GM/(GM+WM), was 0.73±0.05 and 0.11±0.03 for MO and LP, respectively.
| Gly | mI | Glu | NAAG | NAA | tCr | ||
|---|---|---|---|---|---|---|---|
| Concentration (mM) | MO | 0.63±0.05 | 8.6±0.6 | 10.0±0.7 | 1.1±0.2 | 11.0±0.4 | 8* (±0.7) |
| LP | 0.34±0.05 | 5.3±0.8 | 5.9±0.6 | 2.9±0.1 | 8.7±0.7 | 5.3±0.3 | |
| p < 5×10⁻⁶ | p < 5×10⁻⁴ | p < 6×10⁻⁵ | p < 2×10⁻⁵ | p < 2×10⁻³ | p < 2×10⁻⁴ | ||
| CRLB (%) | MO | 4.2±0.7 | 2.2±0.4 | 2.7±0.5 | 5.2±1.1 | 1.0±0.0 | 0.8±0.4 |
| LP | 7.2±0.7 | 3.0±0.0 | 3.2±0.4 | 4.0±0.0 | 1.3±0.5 | 1.0±0.0 | |
Metabolite concentrations were calculated with reference to the mean tCr of the MO region at 8 mM (indicated by an asterisk), following the normalization of LCModel estimates to the GM+WM water signal. Data are mean ± SD (n = 6).
Figure 4.

Linear regression of the concentration estimates with respect to fractional GM contents (fGM) is shown for six metabolites. For each metabolite, the Y-axis intercepts at fGM = 0 and 1 are shown in a bracket, below the coefficient of determination (R2). Dashed lines indicate 95% confidence intervals of the linear fits.
Data from the four tumor patients showed elevated Gly. In a grade-III oligoastrocytoma patient, Gly was estimated to be 0.75 mM, with CRLB of 7% (Figure 5A). This estimate was similar to or slightly higher than the normal level in GM-dominant regions (0.63 mM), but it was substantially higher than the normal level in WM-dominant regions (0.34 mM). When the tumor voxel was reproduced in the T1-weighted images from the 6 healthy subjects, segmentation resulted in fGM of 0.06±0.01. From this fGM value and the Gly regression in Figure 4, the normal Gly level at the tumor MRS voxel location was estimated as 0.3 mM, suggesting Gly elevation by 2.5 fold (= 0.75/0.3). For a subject with biopsy-proven glioblastoma (grade IV) that showed enhancement in post-gadolinium T1-weighted imaging of a clinical MRI scan, Gly was measured to be 1.3 mM (Figure 5B), higher than in the grade-III glioma. To evaluate the Gly abnormality, we performed tissue segmentation for the tumor voxel using the images from healthy subjects, similarly as in the grade-III oligoastrocytoma tumor. The tumor MRS voxel corresponded to an fGM of 0.31 and a normal Gly level of 0.4 mM, implying 3.3 fold elevation of Gly in this very malignant glioma. Figure 6 shows spectra from a glioma patient who had a clinical MRI scan two days before being enrolled in the present study. The lesion was radiographically diagnosed as a glioblastoma largely based on enhancement in post-contrast MRI. We obtained data from two locations within the tumor mass; one from the enhancing region and the other from non-enhancing region. The Gly level was estimated to be ~4 fold higher in the enhancing region than in the non-enhancing region (2.3 mM vs. 0.55 mM). The voxels in the enhancing and non-enhancing regions corresponded to fGM of 0.54 and 0.17 in the brain of healthy volunteers, respectively. From these fGM values and the Gly data fit in Figure 4, the normal Gly levels for the tumor MRS voxels were estimated as 0.54 and 0.37 mM, suggesting Gly elevation by 4.1 and 1.5 fold in the enhancing and non-enhancing regions, respectively.
Figure 5.

In-vivo triple-refocused spectra from (A) a grade-III oligoastrocytoma patient and (B) a grade-IV glioblastoma patients are shown together with voxel positioning in T2-FLAIR images, post-gadolinium T1-weighted images, and spectral analysis results. Dashed horizontal lines (black) indicate the zero levels in the fits. The spectra were normalized to TE 13 ms STEAM water. The data were acquired from (A) a 23×16×14 mm3 voxel (5.2 mL), with TR = 2 s and NSA = 256, and (B) a 25×15×15 mm3 (5.6 mL), with TR = 2 s and NSA = 128. A vertical dotted line is drawn at 3.55 ppm.
Figure 6.

Two in-vivo triple-refocused spectra from a radiographically-suggested glioma patient are shown together with T2-FLAIR and post-gadolinium T1-weighted images. (A) Post-contrast enhancing region (indicated by an arrow in red). Voxel size = 13×25×15 mm3 voxel (4.8 mL), NSA = 192, and TR = 2 s. (B) Post-contrast non-enhancing region. Voxel size = 23×15×20 mm3 voxel (6.9 mL), NSA = 128, and TR = 2 s. For each voxel, the spectrum was normalized to the TE 13 ms STEAM water signal. A vertical dotted line is drawn at 3.55 ppm.
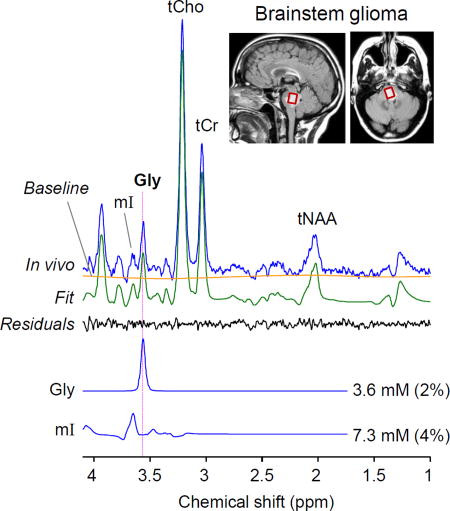
In addition, we tested the Gly-optimized triple refocusing in a subject with a brainstem tumor. A large signal was readily discernible at 3.55 ppm. The Gly level was estimated as 3.6 mM with CRLB 2% (Figure 7A), approximately 10 fold higher compared to the normal Gly level in healthy brainstem (0.37 mM, Figure 7B), suggesting that the lesion was a very aggressive tumor. Segmentation of the reproduced tumor voxel in the images from healthy subjects resulted in fGM of 0.23. This fGM corresponded to a Gly level of 0.4 mM, similar to the actual measurement in Figure 7B. Prior to being enrolled in this study, the patient had four clinical MRI scans for four months, which included T2-FLAIR, post-contrast and perfusion MRI. The tumor did not present post-contrast enhancement at any of the time points, but progressed significantly and showed increased perfusion over the period (data not shown). Given the extensive elevation of Gly, the relentless progression even after use of steroids in a short period of time, and the surgical challenges in the brainstem tumor, the radiological interpretation was made as a grade III or IV glioma and a decision was made to treat the patient with chemo-radiation without biopsy.
Figure 7.

In-vivo triple-refocused spectra from brainstem regions in (A) a radiographically-suggested glioma patient and (B) a healthy volunteer. The scan parameters were identical between the scans (Voxel size = 14×12×14 mm3, NSA = 512, and TR = 2 s). For each voxel, the spectrum was normalized to the TE 13 ms STEAM water signal. A vertical dotted line is drawn at 3.55 ppm.
DISCUSSION and CONCLUSION
The present study reports a new triple-refocusing approach for Gly detection at 3T. Taking advantage of the high variability of strongly-coupled spin signals with changes in the non-selective 180° RF pulse and the three subecho times, the signal of mI was effectively manipulated to improve the detectability of Gly and mI in vivo. Complete suppression of the mI signal between 3.5 and 3.6 ppm was achieved, permitting precise detection of the Gly 3.55 ppm signal without considerable overlaps with neighboring resonances. The present study examined the mI signal dependence on all possible subecho sets up to TE of 150 ms and moreover on the duration of the non-selective 180° RF pulse, which was not investigated in a prior triple-refocusing Gly study (16). The optimized triple-refocusing provided improved detection of both Gly and mI in the human brain compared to previously-reported Gly MRS studies at 3T (9,16). The TE was shorter than those of the prior studies, benefiting from reduced T2 signal loss. Using this new Gly method, we evaluated regional variation of Gly in healthy human brain and Gly abnormality in brain tumors.
Many prior Gly MRS studies utilized long TE and quantified the concentration with reference to tCr in the GM-dominant regions at 8 mM, similarly as in the present study. Although direct comparison of Gly estimate between the present study and prior studies may not be feasible due to differences in data acquisition and analysis, the Gly concentration from this study appears to be in agreement with the prior reports. The Gly concentrations in the medial occipital cortex in healthy adults are approximately 0.5 – 1 mM in several prior studies (9,11,16,18,28) and the present study. For WM-dominant regions, our Gly estimate of ~0.4 mM from the left parietal brain agrees well with a long-TE MRS study at 7T (18) and a recent Gly MRS imaging study at 3T (11). However, our Gly estimate of 0.63 mM from the medial occipital brain appears to be smaller compared to a short-TE (30 ms) MRS study at 7T (29), which reported a Gly-to-tCr concentration ratio of 0.14 for a similar brain region (i.e., [Gly] = 1.1 mM).
Our data indicate the presence of regional variation of Gly in the healthy brain. The Gly concentration was estimated to be higher by ~2.5 fold in pure GM than in pure WM, in agreement with prior reports (11,18). The mean Gly CRLB was smaller in GM-dominant voxels than in WM-dominant voxels (4.2% vs. 7.2%), which may be largely due to the Gly concentration difference between the regions. As Gly is known as co-agonist at NMDA receptors which mediate excitatory glutamatergic neurotransmission, presence of high Gly in GM may be related to the high level of Glu in GM which was observed in the present as well as prior studies (30–32).
The triple-refocused mI signal at 3.64 ppm has a similar width to that of the Gly singlet, as shown in Figure 2. Thus the Gly and mI signals, which are 0.09 ppm apart from each other, are clearly separable for singlet FWHMs less than 7 Hz, which was the case of the present study. The spectral resolution between Gly and mI will become lower with increasing linewidth. For the mI-to-Gly concentration ratio in the medial occipital regions in the present study, which was approximately 14 (≅ 8.6/0.63), the Gly peak may be distinguishable from the mI signal up to singlet FWHM of 8 Hz and may not be clearly discernible on the shoulder of the mI signal when singlet FWHM is larger than 10 Hz, as indicated by computer simulation (Supplementary Figure 3). However, when the Gly-to-mI signal ratio is increased (e.g., malignant brain tumors), Gly may be detectable with the large linewidths.
In addition to mI, which is a major obstacle in Gly measurement in healthy brain, there are several other metabolites that have resonances in the proximity of the Gly resonance and could interfere with Gly measurement. These include Thr (3.58 ppm), fCho (3.50 ppm), and Glc (3.52 ppm; α anomer). These resonances are all J coupled to other resonances, giving rise to multiplets near 3.55 ppm. Computer simulations indicate that the signals of the metabolites all have negative polarity between 3.5 and 3.6 ppm and their amplitudes are 27%, 15% and 3% with respect to Gly for equal concentrations. The model spectra of these potential interferences were included in the basis set of the present study. The fCho estimate was relatively low (< 0.3 mM), in which the signal strength is small compared to the Gly singlet. Thr and Glc were estimated to be null in all data sets. This result may be due to the relatively low concentrations of fCho (14) and Thr (33,34) in the healthy brain and due to the reduced signal intensity at the long TE of the triple refocusing.
A major pitfall of the present study is estimation of Gly assuming identical T2 between Gly and tCr. Signal reduction during the relatively long TE (134 ms) may be substantial, and thus accurate evaluation of Gly requires Gly T2 values in healthy brain and tumors, which have not been reported to date. Metabolite T2 values may not be very different between healthy brain and tumors, as opposed to water T2 (35,36). Metabolite estimation with reference to tCr at 8 mM in healthy brain was chosen based on published measurements of tCr (26,27). Another weakness is that, as a result of optimization solely for Gly detection, the triple refocusing sequence did not confer well-defined signals of Glu and Gln between 2.3 and 2.5 ppm (as seen in Figure 3), which may be important for neuro-psychiatry and neuro-oncology research. With the benefits from suppressed macromolecule background signals at the long TE, the mean CRLBs of Glu and Gln in healthy subjects were 2.6±0.5% and 4.8±0.7% for medial occipital, and 3.2±0.4% and 10.3±3.7% for left parietal, respectively. The Gln estimate ranged from 1 to 3 mM. For the 4 patients with tumors, Glu and Gln were measured to be 2.6 – 4.6 mM and 3.1 – 6.8 mM with CRLBs of 6 – 13% and 4 – 13%, respectively. In addition, the triple refocusing with TE=134 ms resulted in an inverted Lac signal at 1.31 ppm, giving clear contrast with respect to the lipid ~1.3 ppm signal with positive polarity, as seen in our tumor data. The Lac concentration was estimated as 3 – 6.5 mM, with CRLB of 4 – 11%, in the tumors. The mI signal of the triple refocusing was relatively small, but mI was measurable without contamination from Gly.
Presence of regional variation of Gly in the human brain suggests that, when a Gly measurement from a brain tumor is simply compared to published Gly concentrations (0.5 – 1 mM) which were mostly obtained from GM-dominant regions, the interpretation could be misleading. An extra measurement from the contralateral region can be used for evaluation of Gly abnormality in a tumor, but this is possible only when the contralateral region remains truly normal. Gliomas are often very diffuse and as a result, part of the contralateral region shows T2-FLAIR hyper-intensity, as in the three tumors of the present study (Figures 5 and 6). For a brainstem tumor (Figure 7), the contralateral approach is not applicable. In these situations Gly abnormality can be assessed with respect to the normal level in a similar brain region of healthy subjects. Since the tissue composition dependence of the Gly level is equally present throughout the brain (11,18), incorporation of GM and WM contents from healthy-subject image analysis may provide an alternative tool for evaluating the Gly abnormality in tumors, as illustrated in this study. Since tumors are very different than healthy brain and do not contain GM and WM tissue types, the biological interpretation of the Gly concentration difference between tumors and healthy (or normal-appearing) brain may not be straightforward. A primary glioma is believed to arise from remodeling of the local glial cells and thus the tumor characteristics may depend on the local tissue properties of the given brain location (37,38). The glial population is much lower (~10 fold) in GM than in WM regions in healthy brain (39,40). Taken together, the ratio of Gly elevation in a glioma with respect to the normal level at that brain location may reflect the measure of aggressiveness of the tumor. For a tumor that showed local enhancement within the mass, Gly elevation from the normal level was much more extensive in the enhancing region than in non-enhancing region within the tumor (Figure 6A). Given that an enhancing tumor is considered to be highly proliferative and depicts malignant nature of tumor cells (41,42), Gly may provide an imaging biomarker for assessing the tumor malignancy.
Brainstem tumors are in general considered risky for biopsy or surgical intervention and thus difficult to manage (43). In a brainstem tumor of the present study (Figure 7), the Gly level was extensively higher (~10 fold) than the normal level in brainstem. Considering the prior reports suggesting the implication of Gly in malignancy and high grade of tumors (10–12), our observation of high Gly (Figure 7A) is in synchrony with the radiographic interpretation of a malignant glioma. Prior imaging and anatomical studies reported that a brainstem is mainly composed of dense fibers and thus WM dominant (44,45). Our segmentation of a healthy brainstem resulted in a fractional WM content of 0.77. The normal Gly level in a brainstem was relatively low (0.37 mM), similar to the Gly levels in the WM-rich cerebral cortical region. Given the relatively-low normal level of Gly in a healthy brainstem and the clinical complexity of brainstem tumors, the capability to measure Gly in a brainstem tumor precisely may provide an important supplemental tool for radiographic diagnosis and prognosis. Moreover, Preul et al. presented a 1H MRS pattern-recognition analysis for various tumor types and grades using the signals of tCho, tCr, tNAA, Lac and lipids (46). A similar analysis including Gly and mI could provide an improved metabolic profiling for noninvasive diagnosis of tumor types and grades.
In conclusion, we have designed a Gly-optimized triple-refocusing method at 3T and used it for evaluating regional variation of Gly in healthy brain and Gly abnormality in brain tumors. Optimized subecho times and duration of the non-selective 180° RF pulse conferred nearly null background between 3.5 – 3.6 ppm and a well-defined mI signal at 3.64 ppm, enabling reliable detection of Gly 3.55 ppm resonance. Linear regression of Gly estimates with respect to fractional GM content showed approximately 2.5 fold higher concentration of Gly in GM than in WM. Our data from brain tumor patients showed agreement with prior studies that indicated Gly as a biomarker of tumor aggressiveness. We demonstrated that altered levels of Gly in brain tumors can be effectively evaluated incorporating the GM and WM contents from the corresponding location in the brain of healthy subjects. The proposed MRS method may provide a tool for precise measurement of potential small changes of Gly levels in disease at 3T, a field strength that is widely accessible to researchers and clinicians.
Supplementary Material
Supplementary Figure 1. Triple-refocused spectra of mI (red) and Gly (blue), calculated for the subecho time set that gives the smallest mI signal between 3.5 and 3.6 ppm for each of seventeen NS180 durations. The mI-to-Gly concentration was 10.
Supplementary Figure 2. Triple-refocused spectra of mI (red) and Gly (blue) at (TE1, TE2, TE3) = (36, 28, 70) ms, calculated with four NS180 durations (13, 18, 23, and 28 ms). The mI-to-Gly concentration ratio was 10.
Supplementary Figure 3. Calculated spectra of mI (red), Gly (blue) and sum (black), for glycine FWHM of 3 – 11 Hz. The mI-to-Gly concentration was 10. The zero level of the signal is indicated by a horizontal dotted line in each spectrum.
Acknowledgments
This work was supported by the National Cancer Institute of the National Institutes of Health under Award Number R01CA184584 and by a Cancer Prevention Research Institute of Texas grant RP130427. We thank Ms. Kelley Derner, Lucy Christie and Janet Jerrow for subject recruitment and Dr. Ivan Dimitrov for technical assistance.
Abbreviations
- Ala
alanine
- Asp
aspartate
- CRLB
Cramer-Rao lower bound
- Cr
creatine
- CSF
cerebrospinal fluids
- Eth
ethanolamine
- FASTMAP
fast automatic shimming technique by mapping along projections
- fCho
free choline
- fGM
fractional gray matter content
- FWHM
Full width at half maximum
- GABA
γ-aminobutyric acid
- Glc
glucose
- Glu
glutamate
- Gln
glutamine
- GSH
glutathione
- Gly
glycine
- GM
gray matter
- Lac
lactate
- LP
left parietal
- MO
medial occipital
- mI
myo-inositol
- NAA
N-acetylaspartate
- NAAG
N-acetylaspartylglutamate
- NMDA
N-methyl-D-aspartate
- NS180
non-slice selective 180° RF pulse
- PCh
phosphocholine
- PCr
phosphocreatine
- PE
phosphoethanolamine
- PRESS
point-resolved spectroscopy
- RF
radio-frequency
- SD
standard deviation
- sI
scyllo-inositol
- STEAM
stimulated echo acquisition mode
- SPM5
statistical parametric mapping software
- SNR
signal-to-noise ratio
- T2-FLAIR
T2-weighted fluid-attenuated inversion recovery
- Tau
taurine
- tCr
total creatine
- tNAA
NAA+NAAG
- Thr
threonine
- WM
white matter
References
- 1.Legendre P. The glycinergic inhibitory synapse. Cell Mol Life Sci. 2001;58:760–793. doi: 10.1007/PL00000899. [DOI] [PMC free article] [PubMed] [Google Scholar]
- 2.Eulenburg V, Armsen W, Betz H, Gomeza J. Glycine transporters: essential regulators of neurotransmission. Trends Biochem Sci. 2005;30:325–333. doi: 10.1016/j.tibs.2005.04.004. [DOI] [PubMed] [Google Scholar]
- 3.Javitt DC. Glutamate and Schizophrenia: Phencyclidine, N-Methyl-d-Aspartate Receptors, and Dopamine-Glutamate Interactions. Int Rev Neurobiol. 2007;78:69–108. doi: 10.1016/S0074-7742(06)78003-5. [DOI] [PubMed] [Google Scholar]
- 4.Bobek-Billewicz B, Hebda A, Stasik-Pres G, Majchrzak K, Zmuda E, Trojanowska A. Measurement of glycine in a brain and brain tumors by means of 1H MRS. Folia Neuropathol. 2010;48:190–199. [PubMed] [Google Scholar]
- 5.Perry TL, Urquhart N, Hansen S. Studies of the glycine cleavage enzyme system in brain from infants with glycine encephalopathy. Pediatr Res. 1977;11:1192–1197. doi: 10.1203/00006450-197712000-00005. [DOI] [PubMed] [Google Scholar]
- 6.Lehnhardt FG, Bock C, Rohn G, Ernestus RI, Hoehn M. Metabolic differences between primary and recurrent human brain tumors: a 1H NMR spectroscopic investigation. NMR Biomed. 2005;18:371–382. doi: 10.1002/nbm.968. [DOI] [PubMed] [Google Scholar]
- 7.Hattingen E, Lanfermann H, Quick J, Franz K, Zanella FE, Pilatus U. 1H MR spectroscopic imaging with short and long echo time to discriminate glycine in glial tumours. MAGMA. 2009;22:33–41. doi: 10.1007/s10334-008-0145-z. [DOI] [PubMed] [Google Scholar]
- 8.Wright AJ, Fellows GA, Griffiths JR, Wilson M, Bell BA, Howe FA. Ex-vivo HRMAS of adult brain tumours: metabolite quantification and assignment of tumour biomarkers. Mol Cancer. 2010;9:66. doi: 10.1186/1476-4598-9-66. [DOI] [PMC free article] [PubMed] [Google Scholar]
- 9.Choi C, Ganji SK, DeBerardinis RD, Dimitrov IE, Pascual JM, Bachoo R, Mickey BE, Malloy CR, Maher EA. Measurement of glycine in the human brain in vivo by 1H-MRS at 3 T: Application in brain tumors. Magn Reson Med. 2011;66:609–618. doi: 10.1002/mrm.22857. [DOI] [PMC free article] [PubMed] [Google Scholar]
- 10.Maudsley AA, Gupta RK, Stoyanova R, Parra NA, Roy B, Sheriff S, Hussain N, Behari S. Mapping of glycine distributions in gliomas. AJNR Am J Neuroradiol. 2014;35:S31–36. doi: 10.3174/ajnr.A3845. [DOI] [PMC free article] [PubMed] [Google Scholar]
- 11.Ganji SK, Maher EA, Choi C. In vivo 1H MRSI of glycine in brain tumors at 3T. Magn Reson Med. 2016;75:52–62. doi: 10.1002/mrm.25588. [DOI] [PMC free article] [PubMed] [Google Scholar]
- 12.Jain M, Nilsson R, Sharma S, Madhusudhan N, Kitami T, Souza AL, Kafri R, Kirschner MW, Clish CB, Mootha VK. Metabolite profiling identifies a key role for glycine in rapid cancer cell proliferation. Science. 2012;336:1040–1044. doi: 10.1126/science.1218595. [DOI] [PMC free article] [PubMed] [Google Scholar]
- 13.Tomita M, Kami K. Cancer. Systems biology, metabolomics, and cancer metabolism. Science. 2012;336:990–991. doi: 10.1126/science.1223066. [DOI] [PubMed] [Google Scholar]
- 14.Govindaraju V, Young K, Maudsley AA. Proton NMR chemical shifts and coupling constants for brain metabolites. NMR Biomed. 2000;13:129–153. doi: 10.1002/1099-1492(200005)13:3<129::aid-nbm619>3.0.co;2-v. [DOI] [PubMed] [Google Scholar]
- 15.Prescot AP, de BFB, Wang L, Brown J, Jensen JE, Kaufman MJ, Renshaw PF. In vivo detection of brain glycine with echo-time-averaged (1)H magnetic resonance spectroscopy at 4.0 T. Magn Reson Med. 2006;55:681–686. doi: 10.1002/mrm.20807. [DOI] [PubMed] [Google Scholar]
- 16.Choi C, Bhardwaj PP, Seres P, Kalra S, Tibbo PG, Coupland NJ. Measurement of glycine in human brain by triple refocusing 1H-MRS in vivo at 3.0T. Magn Reson Med. 2008;59:59–64. doi: 10.1002/mrm.21450. [DOI] [PubMed] [Google Scholar]
- 17.An Z, Ganji SK, Tiwari V, Pinho MC, Patel T, Barnett S, Pan E, Mickey BE, Maher EA, Choi C. Detection of 2-hydroxyglutarate in brain tumors by triple-refocusing MR spectroscopy at 3T in vivo. Magn Reson Med. 2016 doi: 10.1002/mrm.26347. [DOI] [PMC free article] [PubMed] [Google Scholar]
- 18.Banerjee A, Ganji S, Hulsey K, Dimitrov I, Maher E, Ghose S, Tamminga C, Choi C. Measurement of glycine in gray and white matter in the human brain in vivo by 1H MRS at 7.0 T. Magn Reson Med. 2012;68:325–331. doi: 10.1002/mrm.24368. [DOI] [PMC free article] [PubMed] [Google Scholar]
- 19.Thompson RB, Allen PS. Sources of variability in the response of coupled spins to the PRESS sequence and their potential impact on metabolite quantification. Magn Reson Med. 1999;41:1162–1169. doi: 10.1002/(sici)1522-2594(199906)41:6<1162::aid-mrm12>3.0.co;2-n. [DOI] [PubMed] [Google Scholar]
- 20.Choi C, Ganji SK, Deberardinis RJ, Hatanpaa KJ, Rakheja D, Kovacs Z, Yang XL, Mashimo T, Raisanen JM, Marin-Valencia I, Pascual JM, Madden CJ, Mickey BE, Malloy CR, Bachoo RM, Maher EA. 2-hydroxyglutarate detection by magnetic resonance spectroscopy in IDH-mutated patients with gliomas. Nat Med. 2012;18:624–629. doi: 10.1038/nm.2682. [DOI] [PMC free article] [PubMed] [Google Scholar]
- 21.Gruetter R. Automatic, localized in vivo adjustment of all first- and second-order shim coils. Magn Reson Med. 1993;29:804–811. doi: 10.1002/mrm.1910290613. [DOI] [PubMed] [Google Scholar]
- 22.Hall EL, Stephenson MC, Price D, Morris PG. Methodology for improved detection of low concentration metabolites in MRS: optimised combination of signals from multi-element coil arrays. Neuroimage. 2014;86:35–42. doi: 10.1016/j.neuroimage.2013.04.077. [DOI] [PubMed] [Google Scholar]
- 23.Provencher SW. Estimation of metabolite concentrations from localized in vivo proton NMR spectra. Magn Reson Med. 1993;30:672–679. doi: 10.1002/mrm.1910300604. [DOI] [PubMed] [Google Scholar]
- 24.Cavassila S, Deval S, Huegen D, van Ormondt D, Graveron-Demilly D. Cramer-Rao boubds: an evaluation tool for quantitation. NMR Biomed. 2001;11:278–283. doi: 10.1002/nbm.701. [DOI] [PubMed] [Google Scholar]
- 25.Friston KJ, Ashburner JT, Kiebel SJ, Nichols TE, Penny WD. Statistical Parametric Mapping: The Analysis of Functional Brain Images. London: Academic Press; 2006. [Google Scholar]
- 26.Brooks JC, Roberts N, Kemp GJ, Gosney MA, Lye M, Whitehouse GH. A proton magnetic resonance spectroscopy study of age-related changes in frontal lobe metabolite concentrations. Cereb Cortex. 2001;11:598–605. doi: 10.1093/cercor/11.7.598. [DOI] [PubMed] [Google Scholar]
- 27.Tkac I, Oz G, Adriany G, Ugurbil K, Gruetter R. In vivo 1H NMR spectroscopy of the human brain at high magnetic fields: metabolite quantification at 4T vs. 7T. Magn Reson Med. 2009;62:868–879. doi: 10.1002/mrm.22086. [DOI] [PMC free article] [PubMed] [Google Scholar]
- 28.Choi C, Douglas D, Hawesa H, Jindal A, Storey C, Dimitrov I. Measurement of glycine in human prefrontal brain by point-resolved spectroscopy at 7.0 tesla in vivo. Magn Reson Med. 2009;62:1305–1310. doi: 10.1002/mrm.22125. [DOI] [PubMed] [Google Scholar]
- 29.Gambarota G, Mekle R, Xin L, Hergt M, van der Zwaag W, Krueger G, Gruetter R. In vivo measurement of glycine with short echo-time 1H MRS in human brain at 7 T. MAGMA. 2009;22:1–4. doi: 10.1007/s10334-008-0152-0. [DOI] [PubMed] [Google Scholar]
- 30.Posse S, Otazo R, Caprihan A, Bustillo J, Chen H, Henry PG, Marjanska M, Gasparovic C, Zuo C, Magnotta V, Mueller B, Mullins P, Renshaw P, Ugurbil K, Lim KO, Alger JR. Proton echo-planar spectroscopic imaging of J-coupled resonances in human brain at 3 and 4 Tesla. Magn Reson Med. 2007;58:236–244. doi: 10.1002/mrm.21287. [DOI] [PubMed] [Google Scholar]
- 31.Pan JW, Avdievich N, Hetherington HP. J-refocused coherence transfer spectroscopic imaging at 7 T in human brain. Magn Reson Med. 2010;64:1237–1246. doi: 10.1002/mrm.22534. [DOI] [PMC free article] [PubMed] [Google Scholar]
- 32.Ganji SK, An Z, Banerjee A, Madan A, Hulsey KM, Choi C. Measurement of regional variation of GABA in the human brain by optimized point-resolved spectroscopy at 7 T in vivo. NMR Biomed. 2014;27:1167–1175. doi: 10.1002/nbm.3170. [DOI] [PMC free article] [PubMed] [Google Scholar]
- 33.Choi C, Coupland NJ, Kalra S, Bhardwaj PP, Malykhin N, Allen PS. Proton spectral editing for discrimination of lactate and threonine 1.31 ppm resonances in human brain in vivo. Magn Reson Med. 2006;56:660–665. doi: 10.1002/mrm.20988. [DOI] [PubMed] [Google Scholar]
- 34.Marjanska M, Henry PG, Ugurbil K, Gruetter R. Editing through multiple bonds: threonine detection. Magn Reson Med. 2008;59:245–251. doi: 10.1002/mrm.21492. [DOI] [PubMed] [Google Scholar]
- 35.Li Y, Srinivasan R, Ratiney H, Lu Y, Chang SM, Nelson SJ. Comparison of T1 and T2 metabolite relaxation times in glioma and normal brain at 3T. J Magn Reson Imaging. 2008;28:342–350. doi: 10.1002/jmri.21453. [DOI] [PMC free article] [PubMed] [Google Scholar]
- 36.Madan A, Ganji SK, An Z, Choe KS, Pinho MC, Bachoo RM, Maher EM, Choi C. Proton T2 measurement and quantification of lactate in brain tumors by MRS at 3 Tesla in vivo. Magn Reson Med. 2015;73:2094–2099. doi: 10.1002/mrm.25352. [DOI] [PMC free article] [PubMed] [Google Scholar]
- 37.Westphal M, Lamszus K. The neurobiology of gliomas: from cell biology to the development of therapeutic approaches. Nat Rev Neurosci. 2011;12:495–508. doi: 10.1038/nrn3060. [DOI] [PubMed] [Google Scholar]
- 38.Chen Y, Wang Z, Dai X, Fei X, Shen Y, Zhang M, Wang A, Li X, Wang Z, Huang Q, Dong J. Glioma initiating cells contribute to malignant transformation of host glial cells during tumor tissue remodeling via PDGF signaling. Cancer Lett. 2015;365:174–181. doi: 10.1016/j.canlet.2015.05.026. [DOI] [PubMed] [Google Scholar]
- 39.Pelvig DP, Pakkenberg H, Stark AK, Pakkenberg B. Neocortical glial cell numbers in human brains. Neurobiol Aging. 2008;29:1754–1762. doi: 10.1016/j.neurobiolaging.2007.04.013. [DOI] [PubMed] [Google Scholar]
- 40.Sherwood CC, Stimpson CD, Raghanti MA, Wildman DE, Uddin M, Grossman LI, Goodman M, Redmond JC, Bonar CJ, Erwin JM, Hof PR. Evolution of increased glia-neuron ratios in the human frontal cortex. Proc Natl Acad Sci U S A. 2006;103:13606–13611. doi: 10.1073/pnas.0605843103. [DOI] [PMC free article] [PubMed] [Google Scholar]
- 41.White ML, Zhang Y, Kirby P, Ryken TC. Can tumor contrast enhancement be used as a criterion for differentiating tumor grades of oligodendrogliomas? AJNR Am J Neuroradiol. 2005;26:784–790. [PMC free article] [PubMed] [Google Scholar]
- 42.Mabray MC, Barajas RF, Jr, Cha S. Modern brain tumor imaging. Brain Tumor Res Treat. 2015;3:8–23. doi: 10.14791/btrt.2015.3.1.8. [DOI] [PMC free article] [PubMed] [Google Scholar]
- 43.Hu J, Western S, Kesari S. Brainstem Glioma in Adults. Front Oncol. 2016;6:180. doi: 10.3389/fonc.2016.00180. [DOI] [PMC free article] [PubMed] [Google Scholar]
- 44.Ford AA, Colon-Perez L, Triplett WT, Gullett JM, Mareci TH, Fitzgerald DB. Imaging white matter in human brainstem. Front Hum Neurosci. 2013;7:400. doi: 10.3389/fnhum.2013.00400. [DOI] [PMC free article] [PubMed] [Google Scholar]
- 45.Kamali A, Kramer LA, Frye RE, Butler IJ, Hasan KM. Diffusion tensor tractography of the human brain cortico-ponto-cerebellar pathways: a quantitative preliminary study. J Magn Reson Imaging. 2010;32:809–817. doi: 10.1002/jmri.22330. [DOI] [PMC free article] [PubMed] [Google Scholar]
- 46.Preul MC, Caramanos Z, Collins DL, Villemure JG, Leblanc R, Olivier A, Pokrupa R, Arnold DL. Accurate, noninvasive diagnosis of human brain tumors by using proton magnetic resonance spectroscopy. Nat Med. 1996;2:323–325. doi: 10.1038/nm0396-323. [DOI] [PubMed] [Google Scholar]
Associated Data
This section collects any data citations, data availability statements, or supplementary materials included in this article.
Supplementary Materials
Supplementary Figure 1. Triple-refocused spectra of mI (red) and Gly (blue), calculated for the subecho time set that gives the smallest mI signal between 3.5 and 3.6 ppm for each of seventeen NS180 durations. The mI-to-Gly concentration was 10.
Supplementary Figure 2. Triple-refocused spectra of mI (red) and Gly (blue) at (TE1, TE2, TE3) = (36, 28, 70) ms, calculated with four NS180 durations (13, 18, 23, and 28 ms). The mI-to-Gly concentration ratio was 10.
Supplementary Figure 3. Calculated spectra of mI (red), Gly (blue) and sum (black), for glycine FWHM of 3 – 11 Hz. The mI-to-Gly concentration was 10. The zero level of the signal is indicated by a horizontal dotted line in each spectrum.