Abstract
Rationale and Objectives
This study aimed to determine whether mammographic features assessed by radiologists and using computer algorithms are prognostic of occult invasive disease for patients showing ductal carcinoma in situ (DCIS) only in core biopsy.
Materials and Methods
In this retrospective study, we analyzed data from 99 subjects with DCIS (74 pure DCIS; 25 DCIS with occult invasion). We developed a computer-vision algorithm capable of extracting 113 features from magnification views in mammograms and combining these features to predict whether a DCIS case will be upstaged to invasive cancer at the time of definitive surgery. In comparison, we also built predictive models based on physician-interpreted features, which included histologic features extracted from biopsy reports and Breast Imaging Reporting and Data Systems (BI-RADS) related mammographic features assessed by two radiologists. The generalization performance was assessed using leave one out cross validation with the receiver operating characteristic (ROC) curve analysis.
Results
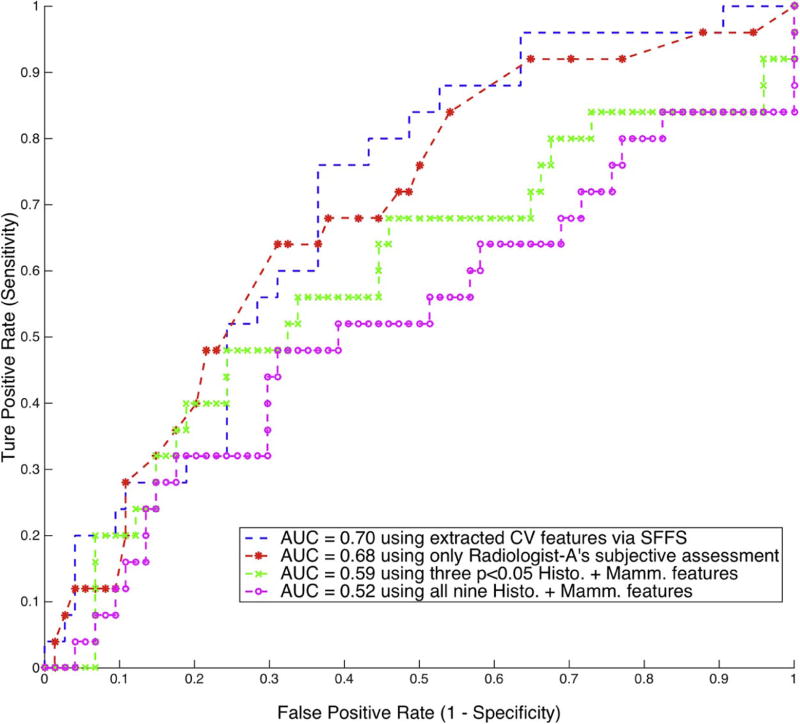
Using the computer-extracted mammographic features, the multivariate classifier was able to distinguish DCIS with occult invasion from pure DCIS, with an area under the curve for ROC (AUC-ROC) equal to 0.70 (95% CI: 0.59–0.81). The physician-interpreted features including histologic features and BI-RADS related mammographic features assessed by two radiologists showed mixed results, and only one radiologist’s subjective assessment was predictive, with AUC-ROC equal to 0.68 (95% CI: 0.57–0.81).
Conclusion
Predicting upstaging for DCIS based upon mammograms is challenging, and there exists significant inter-observer variability among radiologists. However, the proposed computer-extracted mammographic features are promising for the prediction of occult invasion in DCIS.
Keywords: Breast cancer, Ductal carcinoma in situ, Digital mammogram, Microcalcification, CAD
Introduction
Ductal carcinoma in situ (DCIS) is a preinvasive tumor confined within the ducts of the mammary glands [1], and it lies along the breast cancer continuum between atypical ductal hyperplasia and invasive ductal carcinoma. The incidence of DCIS has increased substantially since the introduction of mammographic screening with over 60,000 women in the United States diagnosed with DCIS every year, representing approximately 20% of all new breast neoplasm diagnoses [2]. However, despite the increased incidence of DCIS there has not been a concomitant decrease in invasive breast cancer [3]. Since the risk of progression from DCIS to invasive cancer is unclear, with estimates ranging from 14% to 53% [4], there is a growing debate about overdiagnosis and consequent overtreatment of DCIS. Furthermore, among DCIS-only cases diagnosed at core biopsy, approximately 26% will be shown to contain invasive ductal carcinoma at surgical excision [5]. This upstaging, specifically from DCIS diagnosed at core biopsy to invasive ductal carcinoma at excision, has important consequences for patient management.
Many studies have sought to predict the occult invasion in DCIS. Different factors or markers, including immunohistochemical biomarkers, histological features, and mammographic or sonographic findings, have been described and associated with outcomes in DCIS [5–11]. However, none of these factors have been accepted as a definitive predictor of this upstaging or is sufficiently reliable for clinical use. Overall, it still remains a difficult task and unmet need to accurately predict occult invasive disease in DCIS.
Breast microcalcifications (MCs) appear in 30–50% of mammographically detected cancers [12], and over 90% of women with DCIS have suspicious MCs on mammography [13]. There has been much work using computer-aided detection (CAD) and diagnosis (CADx) for mammography including microcalcification clusters [14–20]. Other CAD/CADx studies have focused on DCIS [21–24], but those studies have not utilized the diagnostic magnification views routinely available during the workup of suspicious calcifications, which offer additional details not appreciable on routine full-field screening mammographic views. In this work, we hypothesize that computer vision techniques as well as various mammographic features developed for screening detection or diagnosis can be used to help predict the presence of occult invasive disease associated with DCIS. We have, therefore, developed a computer-vision algorithm based approach to extract mammographic features for patients with DCIS, and built a classification model relying on these features to distinguish between pure DCIS and DCIS with occult invasive disease.
Materials and Methods
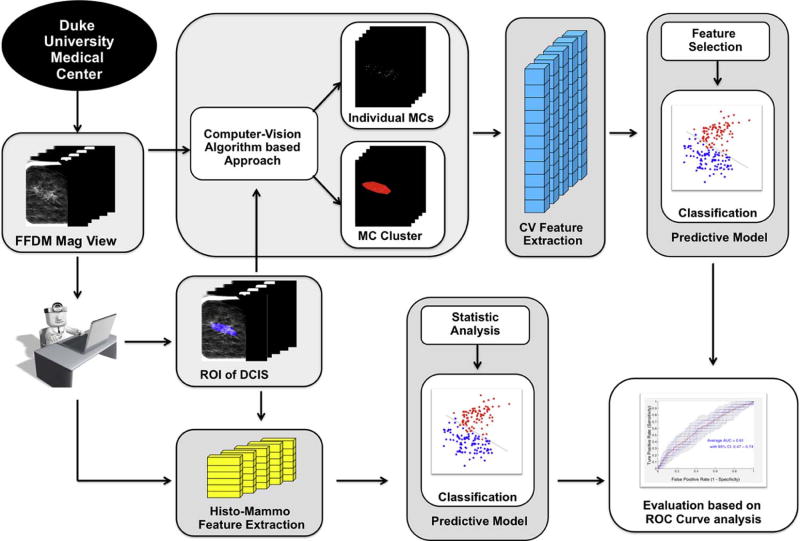
The processing pipeline to analyze the digital mammography magnification views is shown in Fig. 1. A core component of our prediction model is a computer-vision algorithm based approach to extract mammographic features (denoted as computer vision features in the remaining sections). In addition, we also extracted and evaluated some histologic features and BI-RADS (Breast Imaging Reporting and Data Systems) related mammographic features that have been used in the literature [1, 5, 6, 25–29](denoted as physician-interpreted features in the remaining sections), and compared their predictive power for occult invasive disease in DCIS with the computer vision features.
Figure 1.
Flowchart of the proposed methodology.
Subject selection
This study was approved by the institutional review board of XXX. All procedures were compliant with the Health Insurance Portability and Accountability Act. Our subjects included women age 40 and older who underwent stereotactic core needle biopsy and were diagnosed with pure DCIS that presented as calcifications only, and for whom at least one digital magnification view was available. Exclusion criteria included the presence of any masses, asymmetries, or architectural distortion on a mammogram; history of breast cancer or prior surgery; and presence of microinvasion at the time of initial biopsy. The excluded subjects were deemed to be already at high risk for invasion and therefore not appropriate for this study. Overall, 99 subjects from our institution with biopsy-proven DCIS only were retrieved from 2009–2014. Of those, 25 were upstaged to invasive cancer at the time of definitive surgery. All magnification views were produced by GE Senographe Essential systems, with either 1.5X or 1.8X magnification.
Detection of individual microcalcifications and clusters
A computer-vision algorithm based approach was used to segment individual MCs and clusters within the DCIS lesion followed by extraction of mammographic features from the segmented areas to predict the upstaging of DCIS. To accomplish this, calcification regions of interest (ROIs) were first identified by an expert radiologist. Following this manual step, we applied an automatic algorithm described below:
-
Mammogram enhancement:
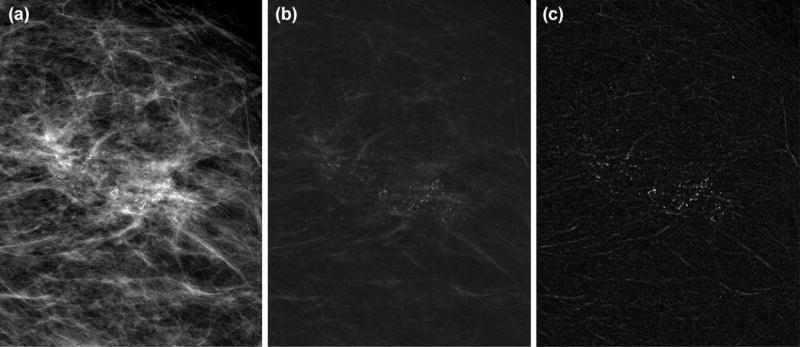
We first enhanced the detectability of MCs through contrast-limited adaptive histogram equalization with a 1mm by 1mm local tile size. Then, a dual-structural element based morphological operator followed by a top-hat transform [20] was applied to further suppress non-relevant background noise. Fig. 2 shows the process of this enhancement procedure.
-
Coarse detection of microcalcifications:
Calcifications occur as bright points in a complex background with heterogeneous intensity and texture. Thus, we proposed a locally adaptive, triple-thresholding technique to detect the potential microcalcification candidates. Considering the size of MCs, we defined a 1mm by 1mm local window. Then, a local intensity mean image Flocal -mean and a local intensity standard deviation image Flocal-STD were constructed from the previously enhanced image F by assigning each pixel with the average intensity value and intensity standard deviation computed within the local window. Next, we conducted histogram thresholding independently on these three images F, Flocal -mean, Flocal-STD, with top 1%, 2% and 2% pixels kept respectively. All three thresholdings were applied within the DCIS ROI area pre-delineated by an expert breast radiologist. In the end, the overlaps of the resulted three thresholded areas were both globally and locally bright small spots, which were regarded as detected MC candidates.
-
False positive reduction:
We further eliminated the false positives from the MC candidates based on their morphologic characteristics. Candidates were removed if they were smaller than 0.1 mm2 or larger than 4 mm2; had circularity within the range 0.9 – 1.1 and area larger than 1mm2, (large, obviously benign calcifications); or had axis ratio larger than 5 (rod-like shapes). By removing those false positives, we obtained the final refined segmentation for individual MCs.
-
Detection of cluster boundary:
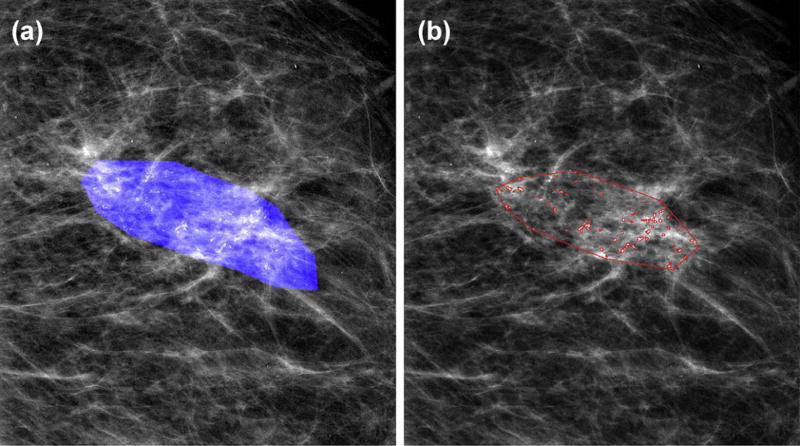
Starting from the center of each detected MCs, a weighted graph was built by connecting all the pairs of MCs that are less than 10 mm from each other and removing the isolated ones. The boundary of the cluster was generated using the convex hull algorithm. Fig. 3 shows the final segmentation results for the same example as in Fig. 2.
Figure 2.
Result of mammogram enhancement: (a) the original digital magnification view; (b) enhanced image by contrast-limited adaptive histogram equalization and dual-structural element based morphology approach; (c) final enhanced image after applying top-hat transform.
Figure 3.
Example result of segmentation of individual MCs and detection of cluster boundary: (a) DCIS ROI mask delineated by radiologist; (b) segmented by the algorithm.
Feature extraction
Computer vision features
For this task, we built a comprehensive feature set similar to that described by Bria et al. [14]. Specifically, from the segmented MCs and clusters, we extracted three types of mammographic features: (i) shape features to describe heterogeneous morphology and size of MC and clusters; (ii) topological features capturing the topological relations between MCs from the weighted graphs associated with the clusters; (iii) texture features obtainable from the original magnification views, such as MC pixel values, background values and statistical measures of gray level co-occurrence matrices (GLCM). Individual MC-level features were computed for all MCs belonging to the same cluster. From these values, four global statistical measures (Mean, STD, Min, and Max) were computed to describe the cluster. For each cluster, we obtained 113 features: 100 individual MC-level and 13 cluster-level features, which are shown in Table. 1. We denote this feature set as computer vision features. For more detailed description of these features, we refer readers to [14].
Table 1.
Computer vision features extracted from individual MCs and cluster.
| Category | Feature | Description | |
|---|---|---|---|
| Individual MCs | Shape | MC perimeter (p) | Length of MC contour |
| MC area (Amc) | Number of pixels for a MC × pixel area (µm2) | ||
| MC circularity | 4π*Amc/p2, a measure of “roundness” | ||
| MC eccentricity | Another measure of “roundness” | ||
| MC major axis | Length of major axis of MC region | ||
| MC minor axis | Length of minor axis of MC region | ||
| MC Hu’s moments *7 | Descriptive weighted averages of intensities | ||
| Topological | MC distance2centroid | Distance to cluster centroid | |
| MC distance2closest | Distance to nearest MC neighbor | ||
| MC degree | Number of edges incident to MC | ||
| MC normalized degree | Sum of normalized weights of MC degree | ||
| Texture | MC background *2 | Mean and std. of background pixel intensities | |
| MC foreground *2 | Mean and std. of MCs’ pixel intensities | ||
| MC GLCM * 4 | Measures computed from GLCMs | ||
| Cluster | Shape | MCCs area (Ac) | Area of cluster |
| MCCs eccentricity | Eccentricity of cluster | ||
| Topological | MCCs number (n) | Number of MCs in cluster | |
| MCCs density | 2E/n*(n-1): E is number of graph edges | ||
| MCCs coverage | sum(Amc/Ac) | ||
| Texture | Cluster background *2 | Mean and std. of background pixel intensities in cluster | |
| Cluster foreground *2 | Mean and std. of MCs’ pixel intensities in cluster | ||
| Cluster GLCM * 4 | Measures computed from GLCMs for whole cluster |
Physician-interpreted features
Prior studies suggested relationships between outcomes of DCIS and histologic features from pathology reports [1, 5, 6, 27, 29] or BI-RADS mammographic features [5, 25–28]. Although not intended for the present task, those features nonetheless may have predictive value. Therefore, we recorded another set of features (denoted as physician-interpreted features) to compare to the computer vision features. From the core biopsy pathology reports, two histologic features were identified: the nuclear grade (low, intermediate, or high) and the presence or absence of comedo type necrosis. Each case was reviewed independently by two fellowship-trained, dedicated breast radiologists, who were blinded to whether invasive disease was eventually found. One of the radiologists (denoted as Radiologist-A in the remaining sections) has 3 years of experience in breast imaging; the other radiologist (denoted as Radiologist-B) has 20 years of experience in breast imaging. By following the terminology of BI-RADS, the following mammographic features were obtained independently from two radiologists: calcification description, distribution, and BI-RADS assessment (4a, 4b, 4c, and 5). Since radiologists were aware that all included subjects had biopsy-proven DCIS, their BI-RADS assessments should all be within category 4a, 4b, 4c, or 5. In addition, we recorded the patient’s age and lesion size as well. The lesion size was measured from each radiologist’s outline of the lesion on the best magnification view by both 2D area and the major axis length. For the description and distribution of calcifications, the options were further ranked with the order of increasing risk of being abnormal, similar to [30]. Furthermore, the radiologists were also asked to provide another ranking score (between 1–100) as their overall judgment of the probability of occult invasion. In total, nine different types of physician-interpreted features were extracted, as shown in Table 2.
Table 2.
Comparison of histologic and mammographic features of the DCIS and invasive groups.
| Feature | DCIS (74) | Invasion (25) | p-value | ||||
|---|---|---|---|---|---|---|---|
|
| |||||||
| Age | 59.8 | 58.2 | p ≤ 0.5330 | ||||
|
| |||||||
| Histologic | Nuclear grade (1–3) | 2.51 | 2.58 | p ≤ 0.6044 | |||
|
|
|||||||
| 1 | 6 | 3 | |||||
|
|
|||||||
| 2 | 27 | 6 | |||||
|
|
|||||||
| 3 | 41 | 16 | |||||
|
|
|||||||
| Subtype of DCIS | p ≤ 0.5250 | ||||||
|
|
|||||||
| Comedo | 36 | 14 | |||||
|
| |||||||
| Non-Comedo | 38 | 11 | |||||
|
| |||||||
| Radiologist-A | Radiologist-B | ||||||
|
|
|||||||
| Mammographic | Size of lesion | ||||||
|
|
|||||||
| Area (mm^2) | 210.3 | 369.0 | p ≤ 0.2257 | 182.5 | 442.9 | p ≤ 0.0305 * | |
| Major Axis (mm) | 16.7 | 24.8 | p ≤ 0.0496 * | 17.3 | 25.4 | p ≤ 0.0345 * | |
|
|
|||||||
| Morphology of calcifications | p ≤ 0.0704 | p ≤ 0.8690 | |||||
|
|
|||||||
| Low Risk (Typically benign) | 0 | 1 | 0 | 0 | |||
|
|
|||||||
| Medium Risk (Amorphous/Coarse heterogeneous) | 41 | 7 | 16 | 5 | |||
|
|
|||||||
| High Risk (Fine pleomorphic/Fine linear) | 33 | 17 | 58 | 20 | |||
|
|
|||||||
| Distribution of calcifications | p ≤ 0.6653 | p ≤ 0.2056 | |||||
|
|
|||||||
| Regional | 2 | 0 | 11 | 3 | |||
|
|
|||||||
| Segmental | 5 | 3 | 3 | 4 | |||
|
|
|||||||
| Linear | 2 | 1 | 15 | 7 | |||
|
|
|||||||
| Clustered | 65 | 21 | 45 | 11 | |||
|
|
|||||||
| BI-RADS level of suspicion | p ≤ 0.0247 * | p ≤ 0.0321* | |||||
|
|
|||||||
| 4a | 40 | 7 | 1 | 1 | |||
|
|
|||||||
| 4b | 17 | 8 | 35 | 6 | |||
|
|
|||||||
| 4c | 14 | 8 | 23 | 7 | |||
|
|
|||||||
| 5 | 3 | 2 | 15 | 11 | |||
|
|
|||||||
| Radiologist’s score of being invasive | 14.5 | 21.0 | p ≤ 0.0052 * | 32.2 | 35.4 | p ≤ 0.4965 | |
Difference for the comparison was statistically significant.
Building and evaluating predictive models
We developed predictive models for both computer vision features as well as physician-interpreted features using univariate and multivariate analyses.
To assess the performance of individual computer vision features, we directly used their normalized numerical values as the posterior probability of being invasive. In the multivariate setting, a logistic regression classifier was utilized with sequential floating forward feature selection (SFFS) [31] nested within leave-one-out cross validation (LOOCV).
For the physician-interpreted features, in univariate setting we performed the Student’s t-test for the continuous features (i.e., age, size of lesion), chi-squared analysis for the nominal feature (i.e., subtype of DCIS), and Mann-Whitney U-test for the other ordinal features. The significance level was 0.05. For multivariate analysis, all features were converted into numeric form (0–1) and then modeled with logistic regression with LOOCV.
The generalization performance of the predictive model was assessed using ROC analysis. To analyze whether the area under the curve of different ROC curves differ significantly, comparisons of AUCs were performed using DeLong’s method [32] implemented in the pROC package [33] with R (V.3.3.1).
Results
Univariate performance
Computer vision features
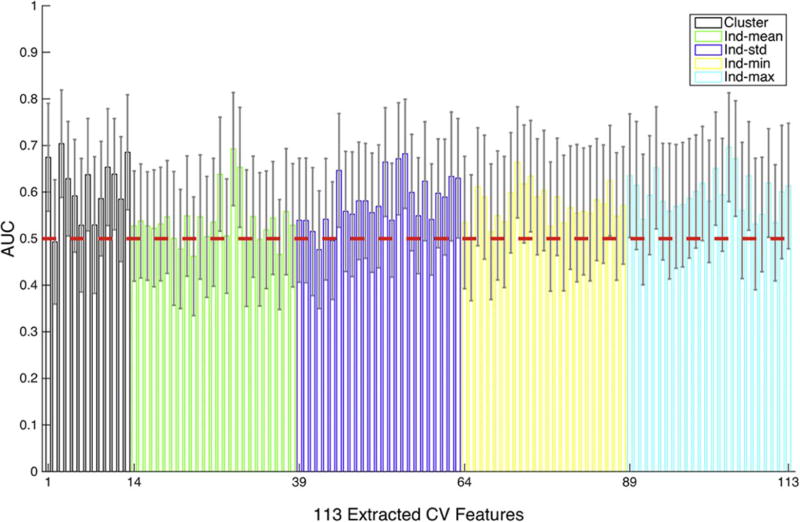
The AUC-ROC performance for individual computer vision features is shown in Fig. 4. Overall, the AUC-ROC performance averaged over all 113 computer vision features is 0.58 ± 0.06, with 25 out of 113 features performing better than chance (p<0.05) at predicting occult invasive disease. Specifically, for individual cluster-wise features (features indexed between 1–13 in Fig.4), the averaged AUC-ROC performance cluster-wise features is 0.61 ± 0.07, with 7 out of 13 features in this group performing better than chance (p<0.05); for individual MC-level features using “mean” statistic (features indexed between 14–38 in Fig.4), the averaged AUC-ROC performance is 0.54 ± 0.05, with 3 out of 25 features in this group performing better than chance (p<0.05); 0.58 ± 0.05 for individual MC-level features using “standard deviation” statistic (features indexed between 39–63 in Fig.4), with 5 features performing better than chance (p<0.05); 0.57 ± 0.04 for individual MC-level features using “minimum” statistic (features indexed between 64–88 in Fig.4), with 3 features performing better than chance (p<0.05); 0.60 ± 0.04 for “maximum”, with 7 features performing better than chance (p<0.05).
Figure 4.
The AUC-ROC performance of individual computer vision features. The red line indicates chance behavior for AUC-ROC being 0.5. The feature groups are cluster level (black) and summary statistics of individual calcification features: mean (green), standard deviation (blue), minimum (yellow), and maximum (cyan).
Physician-interpreted features
Results of the statistical analysis on physician-interpreted features are presented in Table 2. Between the pure DCIS and the invasive groups, there was no statistically significant difference in patient age and histologic features, i.e., nuclear grade, subtype of DCIS. For both radiologists, the morphology and distribution of calcifications showed no statistically significant difference between the pure DCIS and the invasive groups. However, the major axis length of DCIS lesion and BI-RADS levels of suspicion reached statistical significance for both radiologists (Radiologist-A: p ≤ 0.0496, p ≤ 0.0247; Radiologist-B: p ≤ 0.0345, p ≤ 0.0321). The lesion area was significant for only Radiologist-B (p ≤ 0.0305). The radiologist’s subjective score of being invasive was significant for only Radiologist-A (p ≤ 0.0052). Since this unique feature is directly associated with our specific task, we further assessed the inter-observer variability using intraclass correlation coefficients (ICC) (1-way model, consistency definition). The ICC showed a fair correlation of 0.53 (95% CI: 0.37–0.66) between the two radiologists.
Multivariate performance
Fig. 5 shows the ROC curves of the proposed predictive model using different features. For the physician-interpreted features, given that just Radiologist-A’s assessment was significant, only his BI-RADS related features were utilized. Using that subjective assessment as the posterior probability of being invasive achieved a univariate AUC-ROC of 0.68 (95% CI: 0.57–0.81), which performed significantly better than random chance with AUC-ROC of 0.5 (p<0.05) at predicting occult invasive disease. However, in multivariate modeling, building a logistic regression classifier by combining Radiologist-A’s three statistically significant features as shown in Table 2 only achieved AUC-ROC of 0.59 (95% CI: 0.45–0.73), compared to 0.52 (95% CI: 0.38–0.67) by combining all nine physician-interpreted features. Both of these two multivariate predictive models failed to reject the null hypothesis of random chance with AUC-ROC of 0.5.
Figure 5.
ROC curves showing the classification performance using different features. The ROC curve for Radiologist-B’s subjective assessment achieved AUC-ROC of 0.55 (95% CI: 0.41–0.68) and showed no statistically significant difference from random chance and was thus not plotted.
By using the computer vision features, the proposed multivariate predictive model of using sequential floating forward feature selection (SFFS) and logistic regression classifier achieved AUC-ROC of 0.70 (95% CI: 0.59–0.81). Note that this corresponds to the best of the models that we implemented in our analysis; more details are included in the discussion. This multivariate model based on computer vision features significantly outperformed random chance (p<0.05), but shows no statistically significant difference with the univariate model of Radiologist-A’s subjective assessment (p>0.05).
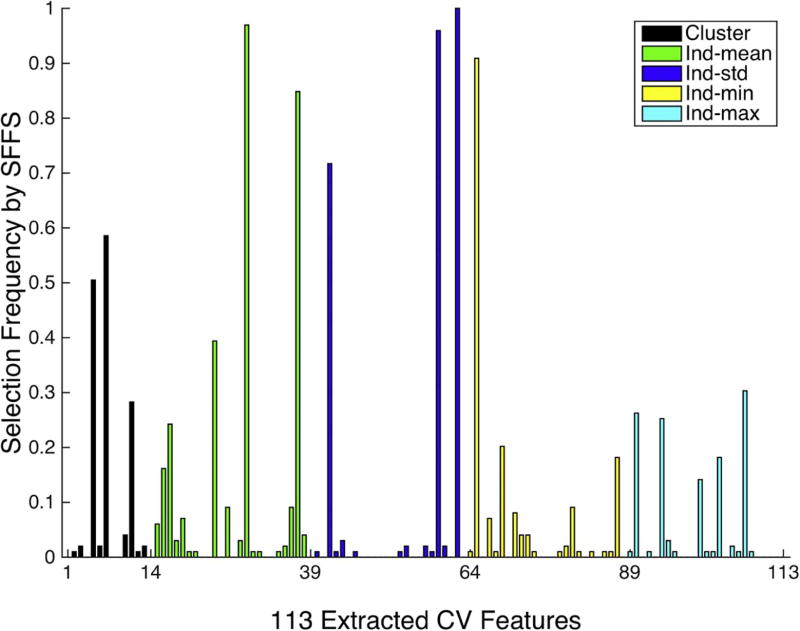
We also plotted the histogram of feature selection frequency when using SFFS method, as shown in Fig. 6. The selection frequencies for the 113 computer vision features were obtained by normalizing the overall 99 folds in LOOCV. The features among the top picks are associated with certain textural properties within clusters (features indexed at 63, 59, 37), the MC density of the cluster (feature indexed at 29), and the size and shape of the MCs (features indexed at 42 and 65).
Figure 6.
The histogram of feature selection frequency using computer vision features and SFFS across the cross validation. These feature groups are cluster level (black) and summary statistics of individual calcification features: mean (green), standard deviation (blue), minimum (yellow), and maximum (cyan).
Discussion
Our study is the first of its kind to examine the feasibility of using computer-extracted mammographic features to predict occult invasive disease in patients with core needle biopsy proven DCIS that presents as mammographic calcifications. In univariate analysis, 25 computer vision features out of total 113 showed significantly better-than-chance predictive power for detecting occult invasive disease. In comparison, there were mixed results among the radiologist interpreted features: the subjective assessments by two radiologists led to different results, with only one radiologist’s subjective score being predictive, although the DCIS lesion size measured in the major axis and the BI-RADS level of suspicion assessed by both radiologists showed statistically significant difference between the pure DCIS and the invasive groups. On multivariate modeling, the computer vision features significantly outperformed random chance (p<0.05), but with an AUC-ROC of 0.70 that showed only marginal improvements over Radiologist-A’s subjective assessment. This emphasizes the difficult nature of predicting the presence of invasive cancer in this setting.
In this initial exploratory analysis, we applied computer-vision features previously utilized in CAD systems, which were designed primarily for the detection of cancer [34–38]. While a useful starting point, the task of identifying a suspicious abnormality is different from discriminating between known DCIS and occult invasive disease. This likely explains in part why the AUC-ROC values achieved in our study are low, although still better than chance. Interestingly the textural features, which describe the heterogeneity of DCIS lesions, had better predictive power when analyzed in conjunction with the shape or topological features. Tumoral heterogeneity at the genetic level has been described as being associated with invasive potential [39], but the relationship between imaging features and genetics, termed radiogenomics, has not been adequately explored. Further investigation into the relationship between genetic heterogeneity and phenotypic manifestations in the form of calcifications at mammography are needed. These results indicate that computer-vision extracted mammographic features associated with microcalcifications and clusters show potential to predict invasive disease and if features can be designed specifically for the task of predicting upstaging the performance metrics will also likely improve.
The physician-interpreted features in our study showed mixed results for the prediction of upstaging. Common features such as BI-RADS morphology and distribution, which are associated with the risk of malignancy, were not useful in stratifying the risk of occult invasive disease. The pathology features including nuclear grade and presence of comedo type necrosis were also not associated with upstaging, despite a prior meta-analysis by Brennan et al. [5] which demonstrated an association with invasive cancer; however, this may be due in part to the smaller sample size included in our study. Previous investigators have looked at the predictive power of individual histologic or pathologic features [5, 6, 9, 25, 27–29], but only Park et al. [9] constructed a nomogram to predict the occult invasiveness of DCIS patients, and obtained an AUC-ROC of 0.71 on their validation set. Although similar in performance to our current study, the previous study included DCIS patients with microinvasion, and the overall underestimation rate of DCIS patients by preoperative biopsy was 42.6% (145/340), both of which significantly decreased the difficulty of the prediction task. A unique feature of our study is the inclusion of the radiologist’s subjective score of being invasive, which did show an association with upstaging for one of the two radiologists. This suggests that the radiologist might be able to identify predictive features that are not expressed in the BI-RADS descriptors, and provides an opportunity for computer-vision features to attempt to quantify and potentially improve upon what the radiologist is interpreting. This is especially important because when included into a multivariate model, the physician-interpreted features did not perform better than random chance.
The current study has several limitations. First, the sample size is relatively small because of the single-institution design and the strict exclusion criteria. This affects the performance of our predictive model, especially considering the high-dimensional computer-vision feature set we extracted. Due to this, a robust and effective feature selection method is necessary. We investigated several different methods and found the sequential floating forward feature selection method with the area under the precision-recall curve as the optimization measure [40] provided the best result (the range of AUC-ROC for other tested feature selection methods are [0.55 ~0.7]). Second, we did not conduct a thorough inter-observer analysis for radiologist-interpreted features, because the main purpose of this study was to explore the feasibility of building an automated model based on computer-extracted mammographic features. However, since the current two radiologists showed interestingly different performance in predicting occult invasive disease in DCIS, a comprehensive inter-observer analysis that includes more radiologists is warranted. Finally, this preliminary study was an unblinded, retrospective study. We were intentionally conservative with feature selection and modeling algorithms, as well as limiting the number of trials. However, our reported results were not adjusted by a multiple-hypothesis testing correction procedure, so there is still potential for overfitting bias.
Conclusions
In conclusion, our study demonstrates the feasibility of using computer-vision algorithms to predict occult invasive disease in DCIS. As a preliminary investigation, this work directly utilized CAD techniques and features not specifically designed for this task, and the size of the data set used is also relatively small, thus we were intentionally conservative with feature selection and modeling so as to minimize overfitting bias. In spite of these constraints, we were able to statistically predict occult invasive disease better than chance. Future work includes building upon these promising results in order to both refine and design new computer vision features specifically targeted towards detecting occult invasive disease, with the goal of improving the predictive power of our algorithm. In addition, we are also planning to include more subjects into this study via collaboration with other institutions for a better-justified validation of our model. Since the successful prediction of occult invasive disease in patients with newly diagnosed DCIS could notably change clinical management, therapeutic decision making, and discussions regarding patient outcomes, there is great potential for this line of inquiry.
Acknowledgments
This work was supported in part by NIH/NCI R01-CQA185138 and DOD Breast Cancer Research Program W81XWH-14-1-0473.
Footnotes
Publisher's Disclaimer: This is a PDF file of an unedited manuscript that has been accepted for publication. As a service to our customers we are providing this early version of the manuscript. The manuscript will undergo copyediting, typesetting, and review of the resulting proof before it is published in its final citable form. Please note that during the production process errors may be discovered which could affect the content, and all legal disclaimers that apply to the journal pertain.
References
- 1.Sue GR, Lannin DR, Killelea B, et al. Predictors of microinvasion and its prognostic role in ductal carcinoma in situ. The American Journal of Surgery. 2013;206(4):478–481. doi: 10.1016/j.amjsurg.2013.01.039. [DOI] [PubMed] [Google Scholar]
- 2.Society AC. Cancer Facts & Figures 2015. American Atlanta: 2015. [Google Scholar]
- 3.Ozanne EM, Shieh Y, Barnes J, et al. Characterizing the impact of 25 years of DCIS treatment. Breast Cancer Research and Treatment. 2011;129(1):165–173. doi: 10.1007/s10549-011-1430-5. [DOI] [PubMed] [Google Scholar]
- 4.Erbas B, Provenzano E, Armes J, et al. The natural history of ductal carcinoma in situ of the breast: a review. Breast Cancer Research and Treatment. 2006;97(2):135–144. doi: 10.1007/s10549-005-9101-z. [DOI] [PubMed] [Google Scholar]
- 5.Brennan ME, Turner RM, Ciatto S, et al. Ductal Carcinoma in Situ at Core-Needle Biopsy: Meta-Analysis of Underestimation and Predictors of Invasive Breast Cancer. Radiology. 2011;260(1):119–128. doi: 10.1148/radiol.11102368. [DOI] [PubMed] [Google Scholar]
- 6.Dillon MF, McDermott EW, Quinn CM, et al. Predictors of invasive disease in breast cancer when core biopsy demonstrates DCIS only. Journal of surgical oncology. 2006;93(7):559–563. doi: 10.1002/jso.20445. [DOI] [PubMed] [Google Scholar]
- 7.Kurniawan ED, Rose A, Mou A, et al. RIsk factors for invasive breast cancer when core needle biopsy shows ductal carcinoma in situ. Archives of Surgery. 2010;145(11):1098–1104. doi: 10.1001/archsurg.2010.243. [DOI] [PubMed] [Google Scholar]
- 8.Lee C-W, Wu H-K, Lai H-W, et al. Preoperative clinicopathologic factors and breast magnetic resonance imaging features can predict ductal carcinoma in situ with invasive components. European Journal of Radiology. 2016;85(4):780–789. doi: 10.1016/j.ejrad.2015.12.027. [DOI] [PubMed] [Google Scholar]
- 9.Park HS, Kim HY, Park S, et al. A nomogram for predicting underestimation of invasiveness in ductal carcinoma in situ diagnosed by preoperative needle biopsy. The Breast. 2013;22(5):869–873. doi: 10.1016/j.breast.2013.03.009. [DOI] [PubMed] [Google Scholar]
- 10.Park HS, Park S, Cho J, et al. Risk predictors of underestimation and the need for sentinel node biopsy in patients diagnosed with ductal carcinoma in situ by preoperative needle biopsy. Journal of Surgical Oncology. 2013;107(4):388–392. doi: 10.1002/jso.23273. [DOI] [PubMed] [Google Scholar]
- 11.Renshaw AA. Predicting invasion in the excision specimen from breast core needle biopsy specimens with only ductal carcinoma in situ. Archives of pathology & laboratory medicine. 2002;126(1):39–41. doi: 10.5858/2002-126-0039-PIITES. [DOI] [PubMed] [Google Scholar]
- 12.Kopans DB. Breast imaging. Lippincott Williams & Wilkins; 2007. [Google Scholar]
- 13.Dershaw D, Abramson A, Kinne D. Ductal carcinoma in situ: mammographic findings and clinical implications. Radiology. 1989;170(2):411–415. doi: 10.1148/radiology.170.2.2536185. [DOI] [PubMed] [Google Scholar]
- 14.Bria A, Karssemeijer N, Tortorella F. Learning from unbalanced data: a cascade-based approach for detecting clustered microcalcifications. Medical image analysis. 2014;18(2):241–252. doi: 10.1016/j.media.2013.10.014. [DOI] [PubMed] [Google Scholar]
- 15.El-Naqa I, Yang Y, Wernick MN, et al. A support vector machine approach for detection of microcalcifications. IEEE transactions on medical imaging. 2002;21(12):1552–1563. doi: 10.1109/TMI.2002.806569. [DOI] [PubMed] [Google Scholar]
- 16.Gavrielides MA, Lo JY, Floyd CE. Parameter optimization of a computer-aided diagnosis scheme for the segmentation of microcalcification clusters in mammograms. Medical Physics. 2002;29(4):475–483. doi: 10.1118/1.1460874. [DOI] [PubMed] [Google Scholar]
- 17.Gavrielides MA, Lo JY, Vargas-Voracek R, et al. Segmentation of suspicious clustered microcalcifications in mammograms. Medical Physics. 2000;27(1):13–22. doi: 10.1118/1.598852. [DOI] [PubMed] [Google Scholar]
- 18.Jing H, Yang Y, Nishikawa RM. Detection of clustered microcalcifications using spatial point process modeling This work was supported by NIH/NIBIB grant R01EB009905. Physics in medicine and biology. 2010;56(1):1. doi: 10.1088/0031-9155/56/1/001. [DOI] [PMC free article] [PubMed] [Google Scholar]
- 19.Wei L, Yang Y, Nishikawa RM, et al. Relevance vector machine for automatic detection of clustered microcalcifications. IEEE transactions on medical imaging. 2005;24(10):1278–1285. doi: 10.1109/TMI.2005.855435. [DOI] [PubMed] [Google Scholar]
- 20.Zhang E, Wang F, Li Y, et al. Automatic detection of microcalcifications using mathematical morphology and a support vector machine. Bio-medical materials and engineering. 2014;24(1):53–59. doi: 10.3233/BME-130783. [DOI] [PubMed] [Google Scholar]
- 21.Pai VR, Gregory NE, Swinford AE, et al. Ductal Carcinoma in Situ: Computer-aided Detection in Screening Mammography 1. Radiology. 2006;241(3):689–694. doi: 10.1148/radiol.2413051366. [DOI] [PubMed] [Google Scholar]
- 22.Plant C, Ngo D, Retter F, et al. Computer-aided diagnosis of small lesions and nonmasses in breast MRI. 2012 [Google Scholar]
- 23.Srikantha A. Symmetry-Based Detection and Diagnosis of DCIS in Breast MRI. In: Weickert J, Hein M, Schiele B, editors. Pattern Recognition: 35th German Conference, GCPR 2013, Saarbrücken, Germany, September 3–6, 2013 Proceedings. Springer Berlin Heidelberg; Berlin, Heidelberg: 2013. pp. 255–260. [Google Scholar]
- 24.Wang L, Harz M, Boehler T, et al. A robust and extendable framework towards fully automated diagnosis of nonmass lesions in breast DCE-MRI. 2014 IEEE 11th International Symposium on Biomedical Imaging (ISBI) 2014
- 25.Bagnall MJ, Evans AJ, Wilson ARM, et al. Predicting invasion in mammographically detected microcalcification. Clinical radiology. 2001;56(10):828–832. doi: 10.1053/crad.2001.0779. [DOI] [PubMed] [Google Scholar]
- 26.Dinkel H, Gassel A, Tschammler A. Is the appearance of microcalcifications on mammography useful in predicting histological grade of malignancy in ductal cancer in situ? The British journal of radiology. 2000;73(873):938–944. doi: 10.1259/bjr.73.873.11064645. [DOI] [PubMed] [Google Scholar]
- 27.Lee CH, Carter D, Philpotts LE, et al. Ductal Carcinoma in Situ Diagnosed with Stereotactic Core Needle Biopsy: Can Invasion Be Predicted? 1. Radiology. 2000;217(2):466–470. doi: 10.1148/radiology.217.2.r00nv08466. [DOI] [PubMed] [Google Scholar]
- 28.O'Flynn E, Morel J, Gonzalez J, et al. Prediction of the presence of invasive disease from the measurement of extent of malignant microcalcification on mammography and ductal carcinoma in situ grade at core biopsy. Clinical radiology. 2009;64(2):178–183. doi: 10.1016/j.crad.2008.08.007. [DOI] [PubMed] [Google Scholar]
- 29.Sim Y, Litherland J, Lindsay E, et al. Upgrade of ductal carcinoma in situ on core biopsies to invasive disease at final surgery: a retrospective review across the Scottish Breast Screening Programme. Clinical radiology. 2015;70(5):502–506. doi: 10.1016/j.crad.2014.12.019. [DOI] [PubMed] [Google Scholar]
- 30.Baker JA, Kornguth PJ, Lo JY, et al. Breast cancer: prediction with artificial neural network based on BI-RADS standardized lexicon. Radiology. 1995;196(3):817–822. doi: 10.1148/radiology.196.3.7644649. [DOI] [PubMed] [Google Scholar]
- 31.Pudil P, Ferri F, Novovicova J, et al. Proceedings of the Twelveth International Conference on Pattern Recognition, IAPR. Citeseer; 1994. Floating search methods for feature selection with nonmonotonic criterion functions. [Google Scholar]
- 32.DeLong ER, DeLong DM, Clarke-Pearson DL. Comparing the areas under two or more correlated receiver operating characteristic curves: a nonparametric approach. Biometrics. 1988:837–845. [PubMed] [Google Scholar]
- 33.Robin X, Turck N, Hainard A, et al. pROC: an open-source package for R and S+ to analyze and compare ROC curves. BMC bioinformatics. 2011;12(1):1. doi: 10.1186/1471-2105-12-77. [DOI] [PMC free article] [PubMed] [Google Scholar]
- 34.Mina LM, Isa NAM. A Review of Computer-Aided Detection and Diagnosis of Breast Cancer in Digital Mammography. Journal of Medical Sciences. 2015;15(3):110. [Google Scholar]
- 35.Giger ML, Karssemeijer N, Schnabel JA. Breast image analysis for risk assessment, detection, diagnosis, and treatment of cancer. Annual review of biomedical engineering. 2013;15:327–357. doi: 10.1146/annurev-bioeng-071812-152416. [DOI] [PubMed] [Google Scholar]
- 36.Jalalian A, Mashohor SB, Mahmud HR, et al. Computer-aided detection/diagnosis of breast cancer in mammography and ultrasound: a review. Clinical imaging. 2013;37(3):420–426. doi: 10.1016/j.clinimag.2012.09.024. [DOI] [PubMed] [Google Scholar]
- 37.Dromain C, Boyer B, Ferre R, et al. Computed-aided diagnosis (CAD) in the detection of breast cancer. European journal of radiology. 2013;82(3):417–423. doi: 10.1016/j.ejrad.2012.03.005. [DOI] [PubMed] [Google Scholar]
- 38.Petrick N, Sahiner B, Armato SG, et al. Evaluation of computer-aided detection and diagnosis systems. Medical Physics. 2013;40(8):087001. doi: 10.1118/1.4816310. [DOI] [PMC free article] [PubMed] [Google Scholar]
- 39.Cowell CF, Weigelt B, Sakr RA, et al. Progression from ductal carcinoma in situ to invasive breast cancer: revisited. Molecular oncology. 2013;7(5):859–869. doi: 10.1016/j.molonc.2013.07.005. [DOI] [PMC free article] [PubMed] [Google Scholar]
- 40.Davis J, Goadrich M. Proceedings of the 23rd international conference on Machine learning. ACM; 2006. The relationship between Precision-Recall and ROC curves. [Google Scholar]


