Abstract
Study Design
Prospective experimental.
Objectives
To compare sensory function as revealed by light touch and pin prick tests of the International Standards for Neurological Classification of Spinal Cord Injury (ISNCSCI) and the electrical perceptual threshold (EPT) exams in individuals with chronic incomplete cervical spinal cord injury (SCI).
Setting
Pittsburgh, United States.
Methods
EPT was tested using cutaneous electrical stimulation (0.5 ms pulse width, 3 Hz) in 32 healthy controls and in 17 participants with SCI over key points on dermatomes C2 to T4 on each side of the body. Light touch and pin prick ISNCSCI scores were tested at the same key dermatomes in SCI participants.
Results
In controls, EPT values were higher in older males (1.26±0.2 mA, mean±s.d.) compared with younger males (1.0±0.2 mA) and older females (0.9±0.2 mA), regardless of the dermatome and side tested. Fifteen out of seventeen SCI participants showed that the level of sensory impairment detected by the EPT was below the level detected by the ISNCSCI (mean=4.5±2.4, range 1–9). The frequency distribution of EPTs was similar to older male controls in dermatomes above but not below the ISNCSCI sensory level. The difference between EPT and ISNCSCI sensory level was negatively correlated with the time post injury.
Conclusions
The results show that, in the chronic stage of cervical SCI, the EPT reveals spared sensory function at lower (~5) spinal segments than the ISNCSCI sensory exam. It is hence found that the EPT is a sensitive tool to assess recovery of sensory function after chronic SCI.
Keywords: American Spinal Injuries Association (ASIA), ASIA Impairment Scale (AIS), electrical perceptual threshold, sensory testing, tetraplegia, light touch, pin prick
Introduction
There are ~12 000 new cases of spinal cord injury (SCI) every year in the United States, with an estimated 280 000 persons currently living with SCIs. About 66% of all new injuries are classified as incomplete and 45% of these affect the cervical spinal cord. Incomplete cervical SCI impairs somatic sensory function, which dramatically diminishes the quality of life1. A major role of somatic sensory receptors is to provide information about the state of the motor system to allow performance of complex movements and behaviors. Thus, the assessment of sensory function is critical to examine the degree of dysfunction and spontaneous or therapy-mediated recovery after SCI.
The current gold standard for assessing light touch and pin prick in humans with SCI is the International Standards for Neurological Classification of Spinal Cord Injury (ISNCSCI2). The ISNCSCI has been extensively used to assess individuals immediately after the injury and longitudinally3. However, because the results are variable and the recording system itself does not capture detailed information about sensory function there is a need for quantitative sensitive outcome measurements of sensory function that supplement the ISNCSCI4–6. There are currently 679 SCI clinical trials in various phases of research (ClinicalTrials.gov), supporting the need for better assessment tools for SCI translational research.
The electrical perceptual threshold (EPT) exam measures the sensory threshold or minimally detectable electrical stimulus intensity applied to the skin. It was initially used to monitor peripheral nerve function7 and then adapted to be used in the same key dermatome points as used in the ISNCSCI8 for individuals with SCI9–13. At present, all studies that used the EPT in participants with SCI detected sensory deficits as compared to healthy controls. The EPT is a reliable exam across examiners and has sufficient sensitivity to assess sensory function across multiple sessions10,13. So far studies using the EPT involved heterogeneous groups including individuals in the acute and chronic phase of SCI with complete and incomplete injuries at the cervical, thoracic, and lumbar spinal cord. When the EPT results were directly compared with the pin prick and light touch sensory portions of the ISNCSCI exam, it was found that the sensory level detected by the EPT was either higher, lower or at the same level as the ISNCSCI 9,11,13, which may result from the heterogeneity of the test group. Studies that compare the sensory level detected by the EPT versus ISNCSCI in a more homogenous SCI group are needed to reveal specific sensory impairments in after SCI.
The purpose of our study was to compare sensory function as revealed by the ISNCSCI and EPT exams in a group of participants with chronic (≥1 year) incomplete cervical SCI. Studies have reported that individuals with chronic cervical incomplete SCI have the ability to improve upper-limb sensorimotor function14. We expected that, after chronic incomplete cervical SCI, the EPT would be more sensitive in detecting spared sensory function at or below the sensory level determined by the ISNCSCI exam.
Materials and Methods
Subjects
Seventeen participants with SCI (age=52.5±15.1 years, 2 female; Table 1) and 32 age-comparable controls (mean age=46.1±20.1 years, P=0.23, 16 female) participated in the study. All subjects gave informed consent to experimental procedures, which were approved by the local ethics committee at the University of Pittsburgh. Previous studies in healthy controls demonstrated differences across age and gender in EPT values18. Therefore, healthy controls were divided into gender and age-comparable categories: younger males and females (younger female, mean age=25.4±3.9, range 20-32, n=8; younger male, mean age=29.8±9.8, range 20-50, n=8; P=0.21) and older males and females (older female, mean age=64.0±7.2, range 53-72, n=8; older male, mean age=65.1±6.6, range 54-77, n=8, P=0.74). Participants with SCI had a chronic (≥1 year), cervical injury (C1–C8), and incomplete SCI as determined by the American Spinal Injuries Association Impairment Scale (AIS) grade. Light touch and pin prick were measured using the ISNCSCI sensory scores. Two out of seventeen SCI participants were categorized as AIS B and the other fifteen were classified as incomplete AIS C and D (Table 1).
Table 1.
Spinal cord Injury participants
| SCI subjects | Age (years) | Gender | Injury (years) | Etiology | Medication | Spasm score | ISNCSCI | ASI score | ISNCSCI Sensory Light Touch
|
ISNCSCI Sensory pin prick
|
||
|---|---|---|---|---|---|---|---|---|---|---|---|---|
| Left | Right | Left | Right | |||||||||
| 1 | 64 | M | 6.5 | NT | Bac | 0 | C5 | D | C6 | T4 | C5 | C5 |
| 2 | 80 | M | 9.8 | T | None | 1 | C3 | D | T4 | T4 | C3 | C3 |
| 3 | 65 | M | 6.8 | T | None | 0 | C2 | D | C6 | C3 | C2 | C6 |
| 4 | 49 | M | 13.1 | T | None | 1 | C4 | D | C5 | C5 | C4 | C4 |
| 5 | 53 | M | 4.6 | T | None | 1 | C4 | D | T4 | T1 | T1 | C4 |
| 6 | 56 | M | 6.6 | T | Bac | 4 | C3 | C | C5 | C3 | C5 | C5 |
| 7 | 54 | M | 2.5 | T | Bac, Tiz | 3 | C2 | D | C3 | C2 | C2 | C3 |
| 8 | 28 | M | 7.9 | T | Bac | 4 | C4 | C | C5 | C4 | C4 | C4 |
| 9 | 29 | F | 7.5 | T | Bac | 2 | C6 | C | C6 | C6 | C6 | C6 |
| 10 | 62 | F | 16.7 | T | Bac, Gbp | 2 | C6 | C | T3 | T4 | T1 | C6 |
| 11 | 54 | M | 4.6 | T | Bac,Gbp,Tiz | 2 | C7 | C | C7 | T3 | T3 | C7 |
| 12 | 58 | M | 3.6 | T | Bac | 1 | C4 | D | C5 | C6 | C4 | C4 |
| 13 | 68 | M | 5.8 | T | None | 3 | C2 | D | C2 | C3 | C2 | C2 |
| 14 | 27 | M | 6.5 | T | Bac | 1 | C6 | B | C7 | C6 | C6 | C7 |
| 15 | 59 | M | 2.7 | T | None | 1 | C3 | D | T1 | C4 | C7 | C3 |
| 16 | 63 | M | 6.2 | T | Tiz | 3 | C1 | C | C2 | C1 | C4 | C4 |
| 17 | 54 | M | 9.6 | T | None | 1 | C2 | B | C3 | C2 | C2 | C2 |
SCI = Spinal cord injury, Time since injury in years, M = Male, F = Female, AIS = American Spinal Injury Association impairment scale, T = Traumatic, NT = Non-traumatic, LOI = Level of injury, C = cervical, Spasm frequency score: 0 = no spasms, 1 = one or fewer spasms per day, 2 = 1 to 5 spasms per day, 3 = 5 to 10 spasms per day, and 4 = 10 or more spasms per day, Bac = baclofen, Gbp = gabapentin, Tiz = tizanidine
EPT
Testing was conducted using constant current square wave electrical pulses (0.5 ms pulse width duration, 3Hz stimulation frequency, DS7A, Digitimer Ltd, Hertfordshire, UK). Stimuli were delivered to the skin over the ISNCSCI sensory key points in 22 dermatomes between C2 and T4 (Figure 1) on both sides of the body by using disposable adhesive electrodes. The cathode was positioned over the ISNCSCI sensory key point, and the anode was placed on the ipsilateral arm of the applied stimulus. The stimulus intensity was manually increased in increments of 0.1 mA up to 10 mA. Each subject was given a familiarization trial run in order to recognize the electrical pulses. Subjects were asked to report verbally when the first sensation was felt. The procedure was repeated 3 times on each dermatome and the EPT (mA) was calculated as the mean of the intensities when sensation just disappeared on each trial (lowest descending stimulus intensity). The perceived stimulus was described as a light ‘tapping’ or gentle ‘pulsing’ sensation, and was not reported as painful by any of the subjects. Subjects were blind to the amplitude of the stimulus current. In healthy controls, the mean EPT values and values 2 s.d. above the mean were calculated at each dermatome. Frequency histograms were created for groups separated by gender and age (Figure 3). In SCI participants, EPTs were analyzed in two ways. First, as in controls, the mean EPT value was calculated and values 2 s.d. above the mean for each dermatome. EPT was considered ‘abnormal’ when it was >2 s.d. of the mean value of an age and gender comparable control group. Second, we assessed significant deviations of EPT values in SCI participants from the mean results in age and gender comparable controls using Z-scores. A Z-score represents the distance between the raw score and the population mean in units of the standard deviation. Thus, a Z-score is negative when the raw score is below the mean and positive when it is above. Frequency histograms were created for old males and SCI participants in dermatomes located above and below the ISNCSCI sensory level. EPT was completed on two separate occasions separated by 1-3 weeks in healthy controls and in individuals with SCI to examine reliability of measurements across sessions.
Figure 1. Experimental Set-up.
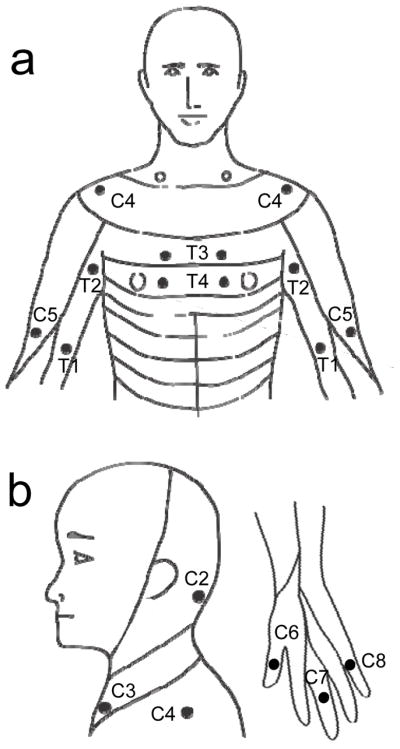
Sensory key points by spinal dermatomes reproduced from the International Standards for Neurological Classification of Spinal Cord Injury (ISNCSCI). a) C4,C5,T1-T4; b) C2-C4 and C6-C8. The ISNCSCI key points in dermatomes from C2 to T4 were tested in the study.
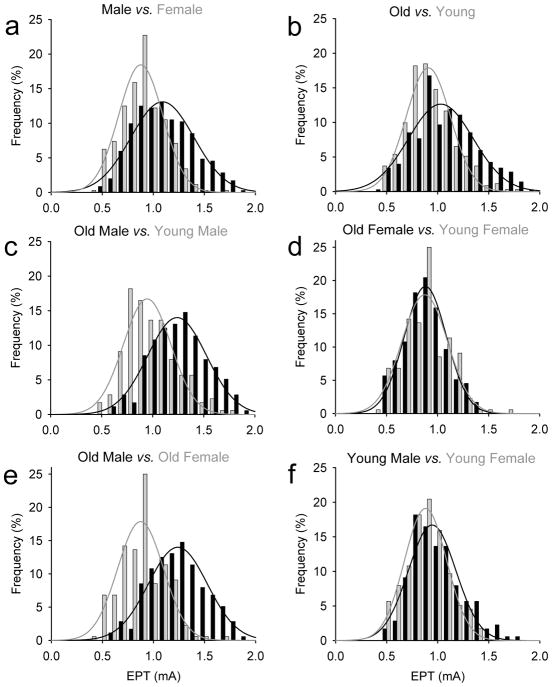
Figure 3. EPT frequency histograms.
In the graphs, the abscissa shows the stimulus intensity (mA) used during testing and the ordinate shows the number of times that intensities were repeated regardless of the dermatome tested expressed as a %. The fitted lines shows the frequency distribution for male and females (black and gray bars; A), old and young individuals (black and gray bars; B), old and young male (black and gray bars; C), old and young females (black and gray bars; D), old male and females (black and gray bars; E) and young male and females (black and gray bars; F). Note that the frequency distribution of EPT values in older males was shifted to the right compared to young males and old females.
ISNCSCI
Individuals with SCI participated in a neurological assessment from a spinal cord physician, following the standards by the ISNCSCI guidelines2. The ISNCSCI exam involved sensory and not motor assessment. The sensory exam included the pin prick and light touch components from dermatomes C2 to T4 on both sides of the body (Figure 1 and Table 1). ISNCSCI sensory examinations were completed by the same physician on two separate occasions separated by 1-3 weeks in SCI participants to examine reliability of measurements across sessions. Note that the ISNCSCI sensory level was defined as the most caudal intact dermatome for both pin prick and light touch sensation. Therefore, there may be some sensation, although abnormal, below the ISNCSCI sensory level.
Results
Repeated-measures analysis of variance were performed to determine the effect of gender (female, male), age (young, old), side (left, right), and dermatome (C2 to T4, 11 dermatomes per side) on EPT values in healthy controls by using the dermatome as the repeated measure. Bonferroni post hoc analysis was used to test for significant comparisons. Paired t-tests were performed to test the difference between groups and sides as needed. Z-scores for the SCI population were computed for each dermatome by using the following formula: (SCI EPT value – EPT mean value for age and gender comparable population)/(s.d. for same age and gender comparable population). Test-retest rater reliability was measured by calculating intra-class correlation coefficients (ICC). ICC performed on the sensory level as assessed by the EPT showed good reliability (ICC=0.92, 95% confidence interval=0.85–0.96). ICCs performed on the sensory level as assessed by the ISNCSCI showed lower reliability compared with EPT (ICC=0.62, 95% confidence interval=0.1–0.87). A Pearson correlation analysis was used as needed. Significance was set at P<0.05. Group data are presented as the means ± s.d. in the text.
EPT – healthy controls
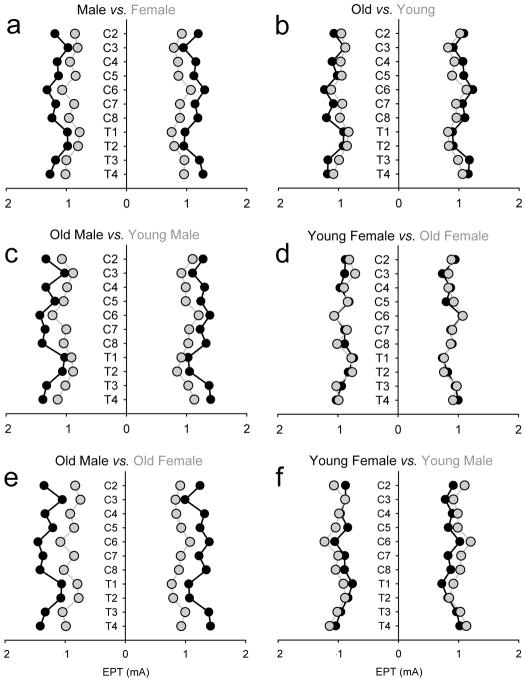
Figure 2 illustrates the group mean EPTs for all dermatomes tested in healthy controls separated by gender and age. Note that EPT values were higher in male than females, regardless of the side and dermatome tested (Figure 2a). Also, note that older male showed higher EPT values than younger male and older females, regardless of the side and dermatome tested (Figure 2c and e).
Figure 2. EPT – healthy controls.
EPT results plotted by gender (male, black circles vs. female, gray circles; A) and age (young, ≤ 50 years old, gray circles vs. old, ≥ 50 years old, black circles; B) in all healthy controls tested. Data for old and young males (black and gray circles; C), old and young females (gray and black circles; D), old male and females (black and gray circles; E), and young male and females (gray and black circles; F) is also presented. The x-axis shows that stimulus intensity (mA) used during testing and the y-axis shows the dermatomes tested. Note that overall older male show higher EPT values.
Repeated-measures analysis of variance showed a significant effect of gender (F(1,28)=25.9, P<0.001), age (F(1,28)=6.7, P=0.01) and their interaction (F(1,28)=6.3, P=0.01) but not of side (F(1,28)=0.9, P=0.43) on EPT values. post hoc testing showed that when we separated subjects by gender and age, old males had a higher threshold than young (P<0.001; Figure 2c) whereas no differences were found between old and younger females (P=0.95; Figure 2d). Old males had a higher threshold compared with old females (P<0.001; Figure 2e) but these differences were not present between young males and females (P=0.10; Figure 2f).
Figure 3 illustrates frequency histograms using EPT values in all control subjects. We found that the frequency distribution of EPTs in females and young individuals were shifted to the left compared with males and old individuals, suggesting that in most of the dermatomes tested EPT values were lower in female compared with males (Figure 3a) and in young vs old subjects (Figure 3b). The differences between gender and age became clear by our finding that old males have a frequency distribution of EPT values shifted to the right compared with younger male (Figure 3c) and older females (Figure 3d). Note that because EPTs varied significantly based on age and gender, our SCI participants (age=52.5±15.1 years) were most of the time compared to older male controls (age=64.0±7.2 years, p=0.11), as this constituted the largest group of SCI participants.
EPT – SCI participants
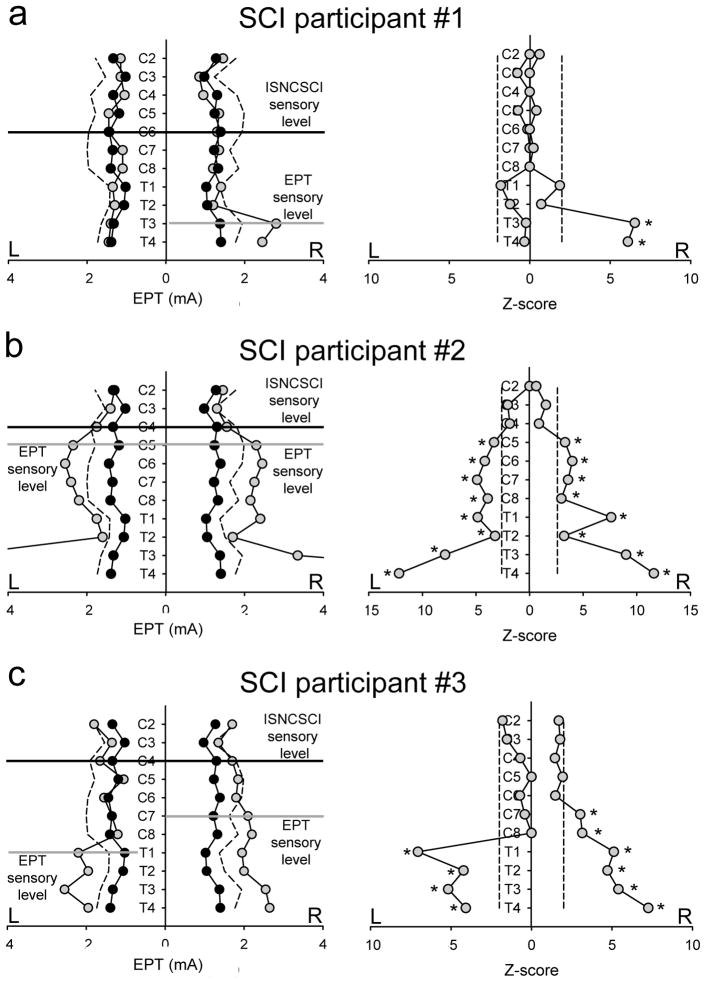
Figure 4 illustrates EPT values and their subsequent Z-score analysis in three representative individuals. Note in SCI participant #1 (Table 1 and Figure 4a), the EPT exam showed a unilateral sensory impairment on the right side below T2. The level of sensory impairment detected by the EPT was located five segments below the ISNCSCI sensory level as shown by the difference between the black and gray lines. In agreement, the Z-score analysis revealed a significant deviation of EPT values from the mean of old male controls below T2 on the right side. In SCI participant #2 (Table 1 and Figure 4b), the EPT results showed a bilateral symmetric sensory impairment below dermatome C4. The sensory level detected by the EPT was located one segmental level below the ISNCSCI sensory level. Similarly, the Z-score analysis revealed significant bilateral deviations of EPT values from the mean of old male controls below C4 bilaterally. Note that both individuals showed normal light touch scores several segments below the ISNCSCI sensory level (Table 1), highlighting the lack of sensitivity of the ISNCSCI exam. In SCI participant #3 (Table 1 and Figure 4c), the EPT and Z-scores revealed significant bilateral asymmetric deviations of EPT values from the mean of old male controls from C8 on the left and from C6 on the right side. The EPT sensory level was five segments below the ISNCSCI sensory level on the left side and three segments below on the right side.
Figure 4. EPT vs ISNCSCI in SCI participants.
EPT values and Z-score are shown in representative SCI participants (gray circles) compared to age-comparable old males (black circles). Dotted lines represent values 2SD from the mean of male controls. ISNCSCI sensory level is shown by a horizontal black line and the EPT level is shown by a horizontal gray line. Note in SCI participant #1 (A), the EPT and Z-scores showed a unilateral sensory impairment on the right side from T2. In SCI participant #2 (B), the EPT and Z-scores showed a bilateral symmetric sensory impairment from dermatome C4. While in SCI participant #3 (C), the EPT and the Z-score analysis revealed significant bilateral asymmetric deviations of EPT values from the mean of old male controls from C8 on the left and from C6 on the right side. *P<0.05.
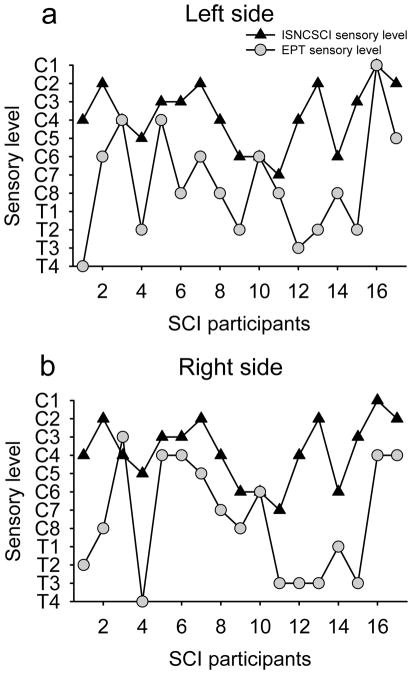
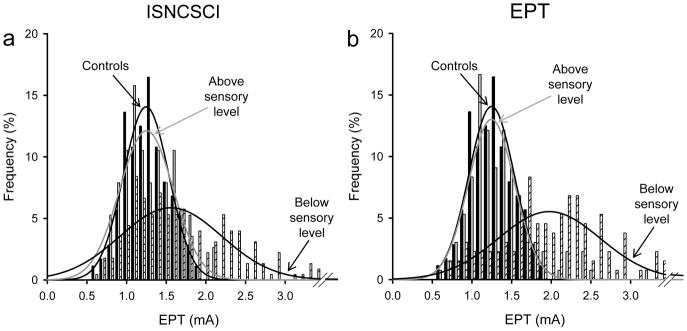
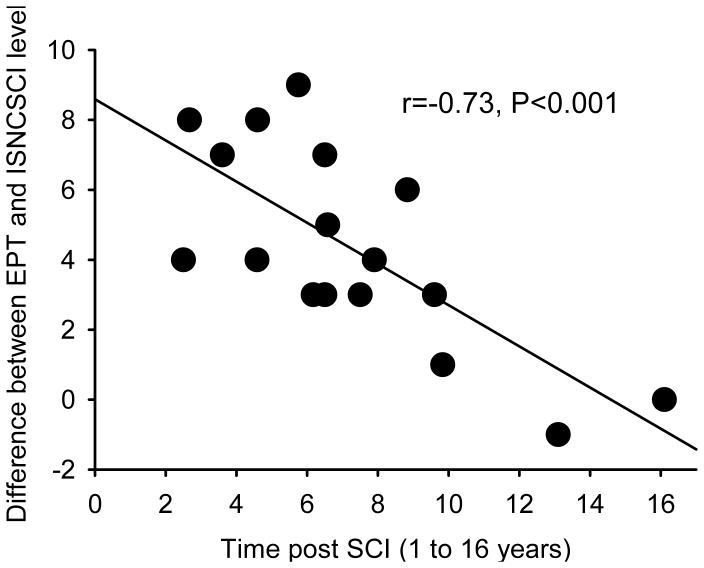
Figure 5 illustrates the EPT and ISNCSCI sensory level in all SCI subjects tested. Note that in the majority of SCI participants the EPT sensory level was found several segments below the ISNCSCI sensory level, regardless of the side tested (left side 14/17, right side 15/17). On average, the EPT indicated a sensory level 4.5±2.4 segments below that detected by ISNCSCI exam (range 1-9). In one SCI participant, the EPT sensory level was one segment higher than the ISNCSCI sensory level in one of the sides tested, and in another participant with SCI the EPT was the same as the ISNCSCI sensory level in both sides. We also found that the frequency distribution of EPTs was similar between SCI participants and old male controls in dermatomes located above the sensory level but shifted to higher values, wider and of smaller amplitude compared with controls in dermatomes located below the sensory level, regardless if the sensory level was detected by the ISNCSCI (Figure 6a) or EPT (Figure 6b) exams. A negative correlation was found between differences found between EPT and ISNCSCI sensory level and the time post SCI (r=−0.73, P<0.001; Figure 7). Thus, participants with longer times with SCI showed a smaller difference between EPT and ISNCSCI sensory level.
Figure 5. EPT vs ISNCSCI in SCI participants.
In the graphs, the abscissa shows the SCI participants tested and the ordinate shows the sensory level detected by the EPT (gray circles) and ISNCSCI (black triangles) exams in the left (A) and right (B) side of the body. Note that regardless of the side tested the sensory level detected by the EPT was below the sensory level detected by the ISNCSCI exam in the majority of SCI participants.
Figure 6. EPT frequency histograms above and below detected sensory level.
In the graphs, the abscissa shows the stimulus intensity (mA) used during testing and the ordinate shows the number of times that intensities were repeated regardless of the dermatome tested expressed as a % when the sensory level was detected by the ISNCSCI (A) and EPT (B) exams. In both graphs the fitted lines shows the frequency distribution of EPT values for old males (controls, indicated by an arrow), EPT values for dermatomes located above (above sensory level, indicated by arrow) and below (below sensory level, indicated by arrow) the sensory level in SCI participants. Note that in dermatomes above the sensory level detected by the ISNCSCI and EPT the frequency distribution of EPT values was similar between SCI participants and controls but impaired in dermatomes below the detected sensory level.
Figure 7. Correlation.
The abscissa shows the number of years that individuals had SCI and the ordinate shows the difference between the sensory level detected by the EPT and ISNCSCI sensory exams. Note that subjects with longer times with SCI showed a smaller difference between EPT and ISNCSCI sensory level. Note that the correlation was significant even though participants with SCI for more than 10 years were removed from the analysis (r=−0.52, p=0.04).
Discussion
Our results demonstrate that in the chronic stage of cervical SCI, the EPT exam reveals spared sensory function at lower (~5) spinal segments than the ISNCSCI. The frequency distribution of EPTs in SCI participants was similar to old male controls in dermatomes above but not below the ISNCSCI sensory level. The difference between EPT and ISNCSCI scores was negatively correlated with the time post injury: individuals who had SCI for longer time showed smaller differences between the sensory level detected by the EPT and ISNCSCI. Thus, our findings indicate that the EPT is a sensitive tool to assess recovery of sensory function after chronic human SCI.
EPT vs ISNCSCI sensory level
Our results in SCI participants agree with previous studies showing that the EPT exam is sensitive to detect sensory deficits in the SCI population9–13. We demonstrate for the first time that, after chronic incomplete cervical SCI, the most caudal unaffected sensory level detected by the EPT can be ~5 segments below those detected by the ISNCSCI. Previous studies comparing the EPT results with the pin prick and light touch sensory portions of the ISNCSCI exam found that the EPT sensory level was either higher, lower, or at the same level as the ISNCSCI in individuals with different characteristics and degrees of SCI 9–13. We now show in a more homogeneous group of SCI participants that the EPT can detect changes below the ISNCSCI exam in the majority of individuals. Indeed, in contrast to the acute phase where the sensory level measured by the EPT was typically several segments above the clinical ISNCSCI sensory level13 our results showed that in the chronic phase of SCI the EPT detects changes below the clinical exam level. This in part might be related to differences in physiological and behavioral processes taking place in the acute or chronic phases of SCI16. A possibility is that in the acute phase of SCI the EPT might be more sensitive to detect small sensory impairments that were missed by the ISNCSCI exam, whereas in the chronic phase the consistently lower EPT values suggest that this exam is more sensitive to assess the extent of recovery. This is in agreement with previous results in individuals with incomplete SCI showing that the number of participants with a sensory level detected by EPT below the level assessed by the ISNCSCI exam was larger 6 months compared to 1 month after the injury13. This is also supported by the inverse correlation that we found between differences in EPT and ISNCSCI sensory level and time post SCI. Here, individuals with SCI for longer periods of times were those who showed smaller differences between the sensory level detected by the EPT and ISNCSCI.
A disagreement between EPT and ISNCSCI sensory level was seen in ~90% of the SCI participants in at least one of the sides of the body. A possibility is that differences in the sensory fibers targeted by both examinations affected our results. The EPT exam mainly assesses dorsal column function9, whereas the ISNCSCI sensory exam is widely accepted as assessing dorsal column function in the light touch test and the anterolateral spinothalamic tract in the pin prick test16, despite the fact that the pin prick test involves a strong element of discrimination (between sharp and blunt) probably also involving dorsal column transmission17. We found similar differences in the sensory level detected by the EPT and light touch and between the EPT and the pin prick, suggesting that if even the injury damaged sensory pathways to a different extent it is less likely that this factor largely contributed to our results. It is also less likely that these differences were due to asymmetries in the injury, because the EPT and ISNCSCI light touch and pin prick exams detected asymmetries in the majority of our SCI participants. The presence of some spared sensory function below the ISNCSCI sensory level highlights the lack of sensitivity of the ISNCSCI scoring system compared with the EPT exam. Indeed, ISNCSCI sensory exam is able to detect some spared sensory function, which gets lost during the quantification procedures. This might be in part related to the three-point nature of the numerical scoring system, where 2 is normal (just like sensation on the face), 1 is abnormal (different from the face, either hyposensitive or hypersensitive), and 0 is either absent or unable to tell the difference between sharp and dull more than 80% of the time, which does not allow a precise delineation of the preserved sensory function after a SCI, even though measurements can be reproduced over time. This might also be influenced by the restrictions imposed by the ISNCSCI sensory exam to define normality. Since a ‘normal’ sensory level corresponds to the most caudal segment at which both sides of the body show a score of 2, this immediately excludes the possibility of detecting asymmetries and does not consider possible variations between light touch and pin prick scores. Thus, as proposed before3–6, our results support the view that additional and more sensitive outcome measurements of sensory function are needed to supplement the ISNCSCI exam. Although, it is unclear if discrepancies between EPT and ISNCSCI sensory level will be more or less pronounced in the acute and chronic phases of SCI, our study highlights the need to examine EPTs in a longitudinal manner in future studies.
Our results in control subjects agree with previous studies showing that EPT values are higher in males compared with females8,15,18, which is congruent with evidence showing that females had lower sensory thresholds to electrical and mechanical stimuli applied to the skin compared with males19. We also found no differences in EPTs between left and right sides of the body as previously shown8,20. On the other hand, our finding that older males showed higher EPT values compared with younger males and that this age difference was not found among females contrasts with earlier results showing no age-related difference in EPT among males20 and that women had higher EPT with age20. These discrepancies with previous studies may be explained by the small number of subjects previously tested and by the lack of correction for multiple comparisons in previous studies20. Our results underline the need to use proper age and gender comparable controls groups for comparisons of EPT values across populations.
In summary, our results extend previous finding showing that the EPT exam has good sensitivity to detect subclinical sensory changes that were not detected by the ISNCSCI sensory exam and suggest that in the chronic phase of incomplete cervical SCI, the EPT might provide a more sensitive tool to examine the recovery of sensory function
Footnotes
The authors declare no conflict of interest.
References
- 1.Herrmann KH, Kirchberger I, Biering-Sørensen F, Cieza A. Differences in functioning of individuals with tetraplegia and paraplegia according to the International Classification of Functioning, Disability and Health (ICF) Spinal Cord. 2011;49:534–543. doi: 10.1038/sc.2010.156. [DOI] [PubMed] [Google Scholar]
- 2.Kirshblum SC, Burns SP, Biering-Sorensen F, Donovan W, Graves DE, Jha A, Johansen M, Jones L, Krassioukov A, Mulcahey MJ, Schmidt-Read M, Waring W. International standards for neurological classification of spinal cord injury (revised 2011) J Spinal Cord Med. 2011;34:535–546. doi: 10.1179/204577211X13207446293695. [DOI] [PMC free article] [PubMed] [Google Scholar]
- 3.Boakye M, Harkema S, Ellaway PH, Skelly AC. Quantitative testing in spinal cord injury: overview of reliability and predictive validity. Journal of Neurosurgery Spine. 2012;17:141–150. doi: 10.3171/2012.5.AOSPINE1296. [DOI] [PubMed] [Google Scholar]
- 4.Steeves JD, Lammertse D, Curt A, Fawcett JW, Tuszynski MH, et al. Guidelines for the conduct of clinical trials for spinal cord injury (SCI) as developed by the ICCP panel: clinical trial outcome measures. Spinal Cord. 2007;45:206–221. doi: 10.1038/sj.sc.3102008. [DOI] [PubMed] [Google Scholar]
- 5.Ellaway PH, Kuppuswamy A, Balasubramaniam AV, Maksimovic R, Gall A, Craggs MD, et al. Development of quantitative and sensitive assessments of physiological and functional outcome during recovery from spinal cord injury: a clinical initiative. Brain Research Bulletin. 2011;84:343–357. doi: 10.1016/j.brainresbull.2010.08.007. [DOI] [PubMed] [Google Scholar]
- 6.Alexander MS, Anderson KD, Biering-Sorensen F, Blight AR, Brannon R, Bryce TN, et al. Outcome measures in spinal cord injury: recent assessments and recommendations for future directions. Spinal Cord. 2009;47:582–591. doi: 10.1038/sc.2009.18. [DOI] [PMC free article] [PubMed] [Google Scholar]
- 7.Rendell MS, Katims JJ, Richter R, Rowland F. A comparison of nerve conduction velocities and current perception thresholds as correlates of clinical severity of diabetic sensory neuropathy. Journal of Neurology, Neurosurgery, and Psychiatry. 1989;52:502–511. doi: 10.1136/jnnp.52.4.502. [DOI] [PMC free article] [PubMed] [Google Scholar]
- 8.Davey NJ, Nowicky AV, Zaman R. Somatopy of perceptual threshold to cutaneous electrical stimulation in man. Experimental Physiology. 2001;86:127–130. doi: 10.1113/eph8602086. [DOI] [PubMed] [Google Scholar]
- 9.Savic G, Bergstrom EM, Frankel HL, Jamous MA, Ellaway PH, Davey NJ. Perceptual threshold to cutaneous electrical stimulation in patients with spinal cord injury. Spinal Cord. 2006;44:560–566. doi: 10.1038/sj.sc.3101921. [DOI] [PubMed] [Google Scholar]
- 10.Savic G, Frankel HL, Jamous MA, Jones PW, King NK. Sensitivity to change of the cutaneous electrical perceptual threshold test in longitudinal monitoring of spinal cord injury. Spinal Cord. 2011;49:439–444. doi: 10.1038/sc.2010.123. [DOI] [PubMed] [Google Scholar]
- 11.Kramer JL, Moss AJ, Taylor P, Curt A. Assessment of posterior spinal cord function with electrical perception threshold in spinal cord injury. Journal of Neurotrauma. 2008;25:1019–1026. doi: 10.1089/neu.2007.0503. [DOI] [PubMed] [Google Scholar]
- 12.King NK, Savic G, Frankel H, Jamous A, Ellaway PH. Reliability of cutaneous electrical perceptual threshold in the assessment of sensory perception in patients with spinal cord injury. Journal of Neurotrauma. 2009;26:1061–1068. doi: 10.1089/neu.2008.0787. [DOI] [PubMed] [Google Scholar]
- 13.Lauschke JL, Leong GW, Rutkowski SB, Waite PM. Changes in electrical perceptual threshold in the first 6 months following spinal cord injury. Journal of Spinal Cord Medicine. 2011;34:473–481. doi: 10.1179/2045772311Y.0000000036. [DOI] [PMC free article] [PubMed] [Google Scholar]
- 14.Cortes M, Elder J, Rykman A, Murray L, Avedissian M, Stampa A, et al. Improved motor performance in chronic spinal cord injury following upper-limb robotic training. NeuroRehabilitation. 2013;33:57–65. doi: 10.3233/NRE-130928. [DOI] [PMC free article] [PubMed] [Google Scholar]
- 15.Leong GW, Lauschke J, Rutowski SB, Waite PM. Age, gender, and side differences of cutaneous electrical perceptual threshold testing in an able-bodied population. Journal of Spinal Cord Medicine. 2010;33:249–255. doi: 10.1080/10790268.2010.11689702. [DOI] [PMC free article] [PubMed] [Google Scholar]
- 16.Dimitrijevic MR, Kakulas BA, McKay WB, Vrbova G. Restorative Neurology of Spinal Cord Injury. Oxford University Press; 2011. [Google Scholar]
- 17.Vasquez N, Gall A, Ellaway PH, Craggs MD. Light touch and pin prick disparity in the International Standard for Neurological Classification of Spinal Cord Injury (ISNCSCI) Spinal Cord. 2013;51:375–378. doi: 10.1038/sc.2012.175. [DOI] [PubMed] [Google Scholar]
- 18.Maffiuletti NA, Herrero AJ, Jubeau M, Impellizzeri FM, Bizzini M. Differences in electrical stimulation thresholds between men and women. Annals of Neurology. 2008;63:507–512. doi: 10.1002/ana.21346. [DOI] [PubMed] [Google Scholar]
- 19.Torgén M, Swerup C. Individual factors and physical work load in relation to sensory thresholds in a middle-aged general population sample. European Journal of Applied Physiology. 2002;86:418–427. doi: 10.1007/s00421-001-0567-z. [DOI] [PubMed] [Google Scholar]
- 20.Leong GW, Gorrie CA, Ng K, Rutkowski S, Waite PM. Electrical perceptual threshold testing: a validation study. Journal of Spinal Cord Medicine. 2009;32:140–146. doi: 10.1080/10790268.2009.11760765. [DOI] [PMC free article] [PubMed] [Google Scholar]


