

Abstract
In this issue of Cell Reports, Almendro et al. report one of the first comprehensive studies on the intratumor heterogeneity of cell phenotypes and genotypes before and after chemotherapy in breast cancer. These data challenge the concept of genetic population bottlenecks and suggest that cellular phenotypes play an important role in developing resistance to therapy.
Intratumor heterogeneity was originally reported as early as the late 1800s by pathologists and gained further evidence by cytologists in the late 1900s with the development of chromosome staining techniques. In the last decade, there has been an overwhelming amount of data on genetic intratumor heterogeneity, largely because of the advent of next-generation sequencing methods. However, although many studies have reported that intratumor heterogeneity exists in many human cancers, few have ventured into the questions of why it exists and whether it plays an important role in tumor progression. Clonal diversity may be critically important when tumor cells encounter selective pressures, including the immune system, hypoxia, nutrient deprivation, geographic isolation, and, perhaps strongest of all, chemotherapy (Burrell et al., 2013; Merlo et al., 2006). Although several studies have investigated intratumor heterogeneity prior to chemotherapy and often report that increased diversity correlates with resistance (Chen et al., 2012; Mroz et al., 2013), few have analyzed the diversity of tumor cells in posttreatment samples. In this issue of Cell Reports, Almendro et al. (2014) have investigated the role of intratumor heterogeneity in response to neoadjuvant therapy in breast cancer patients by examining both pre- and posttreatment samples.
An important distinction in studying intratumor heterogeneity is the difference between genotypic diversity and phenotypic diversity. Genomic mutations may not necessarily result in phenotypic changes in cells, and, conversely, variations in phenotypes do not necessarily imply different mutations. In their previous work leading up to the present study, Almendro et al. (2014) developed an approach called iFISH to track both phenotypic and genotypic diversity by combing fluorescence in situ hybridization with immunocytochemistry (Park et al., 2010). The advantage of this approach is that it can determine the genotype and phenotype of thousands of single cells and determine their spatial organizations in situ. Using this approach, they investigated differences in intratumor heterogeneity in three major subtypes of breast cancer (luminal A, Her2, and basal-like) and reported that the basal-like tumors showed the highest levels of genetic diversity and a strong bias toward mesenchymal phenotypes.
In the present study, Almendro et al. (2014) selected a cohort of 47 breast cancer patients that span the four major subtypes of breast cancer (luminal A, luminal B, Her2, and basal-like). They collected longitudinal tumor samples before neoadjuvant treatment (using anthracyclins or taxol derivatives) and 60–300 days after treatment. To track phenotypes, they stained cells with antibodies in order to distinguish between differentiated (CD24+) and mesenychmal (CD44+) phenotypes. To measure geno-types, they analyzed copy-number states using FISH probes for 8q24.3, 10p13, 16p13.3, and 20q13.31. In total, they analyzed 21,236 single cancer cells and used statistical methods from ecology to calculate diversity indexes, including the Shannon and Simpson indices. From this data, they compared changes in the diversity indices before and after neoadjuvant therapy.
Challenging a population of tumor cells with a drug could have several outcomes on the diversity of the population. The therapy could completely eradicate the tumor cell population (Figure 1A) or lead to a population bottleneck followed by the reconstitution of the tumor mass by the resistant clones (Figure 1B). Alternatively, the drug could have no effect on the diversity of the tumor cell population (Figure 1C). The current paradigm holds that tumor cells are diverse populations that harbor resistance mutations in rare clones (Merlo et al., 2006; Nowell, 1976). When challenged with therapy, this model predicts that the majority of the tumor mass will be eliminated; however, over time, the mass will slowly be repopulated by resistant clones. However, the data reported by Almendro et al. (2014) are inconsistent with this model, instead showing that genetic diversity did not change after chemotherapy (Figure 1C). These data may be explained if most of the tumor cells, regardless of genotype, are resistant to the therapy. Alternatively, the tumor cell populations may have undergone a population bottleneck for a brief period of time but then quickly repopulated the tumor mass and its diversity over the time period (60–300 days) that occurred before the posttreatment samples were collected.
Figure 1. Models of Genetic and Phenotypic Diversity in Response to Therapy.
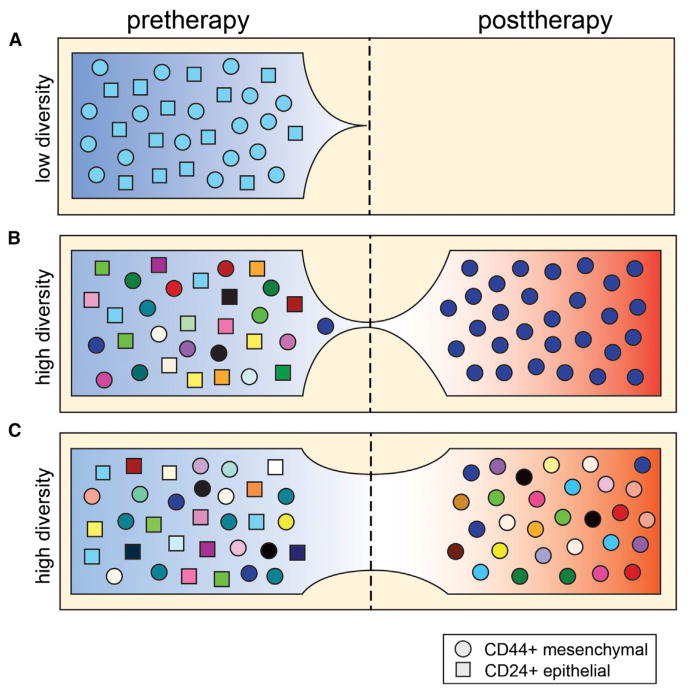
(A) Genetically homogenous population with complete response.
(B) Genetic population bottleneck and selection of CD44+ phenotypes.
(C) No change in genetic diversity after therapy, but phenotypic selection of CD44+ cells.
In contrast to genetic diversity, Almendro et al. (2014) did observed significant changes in phenotypic diversity. In most of the patients, the tumor cells shifted from a differentiated phenotype (CD24+/CD44−) to a mesenchymal phenotype (CD24−/CD44+) after therapy. This pattern occurred in all of the subtypes except for the Her2 tumors. The change in phenotypes was also accompanied by a decrease in overall cell proliferation (Ki67 staining), suggesting that the chemotherapy may have eliminated most of the rapidly dividing cells while leaving the slowly proliferating cells intact. These data suggest that cell phenotypes play a critical role in developing resistance to neoadjuvant therapy in breast cancer.
Almendro et al. (2014) also tracked the spatial organization of tumor clones in response to therapy. By measuring inter-cell distances of clones with different 8q24 and chr8 CEP copy-number states, they observed differences in the spatial distribution of clones after therapy. In most patients the tumor clones remained intermixed within tissue regions rather than clustering into distinct regions. These results differ from recent studies in kidney tumors in which multiple regions were sampled for next-generation sequencing (Gerlinger et al., 2012) but are consistent with an earlier report in breast cancer in which genomic copy-number profiling and FISH were used to show the intermingling of clones in the same geographical regions (Navin et al., 2010).
On the contrary, Almendro et al. (2014) found strong evidence for phenotypic clustering in response to therapy. To better understand the spatial organization of phenotypes in response to therapy, they developed a mathematical simulation that incorporated empirical parameters, including cell proliferation rates (Ki67). By modeling each patient, they found that the clustering of tumor cells with similar phenotypes could not be solely attributed to cell divisions, placing their daughter cells in adjacent regions, but instead must require phenotype switching in distinct regions of the tumor. They also modeled the effects of cell migration, which increased the rate of phenotype switching, and may be necessary for converting the scattered migratory cells back to the correct phenotype in a distinct region of the tumor.
These studies highlight the importance of cellular phenotypes in developing resistance to chemotherapy and the clinical value of measuring diversity to predict complete response. Furthermore, they illustrate the power of combining experimental data with mathematical modeling to understand complex biological processes in cancer. However, these data are inconsistent with a recent study in acute myeloid leukemia that employed next-generation sequencing to analyze pre- and posttherapy samples (Ding et al., 2012), showing evidence of decreasing genetic diversity in response to therapy as minor clones emerged with new resistance mutations. Although these pioneering studies have begun to unravel the complex interplay between genetic and phenotypic diversity in the evolution of chemoresistance, additional work combining both cytogenetic and genomic tools will be needed to fully understand this complex process, which plagues the treatment of most human cancers.
Acknowledgments
N.E.N. is a Nadia's Gift Foundation Damon Runyon-Rachleff Innovator (DRR-25-13). This work is supported by an RO1 (1RO1CA169244-01) and R21 (R21CA174397-01) grant from the NIH. N.E.N. is also supported by the Alice Reynolds Kleberg Foundation and the Center for Genetics and Genomics at the MD Anderson Cancer Center.
References
- Almendro V, Cheng K, Randles A, Itzkovitz S, Marusyk A, Ametller E, Gonzalez-Farre X, Muñoz M, Russnes HG, Helland Å, et al. Cell Rep. 2014;6:514–527. doi: 10.1016/j.celrep.2013.12.041. this issue. [DOI] [PMC free article] [PubMed] [Google Scholar]
- Burrell RA, McGranahan N, Bartek J, Swanton C. Nature. 2013;501:338–345. doi: 10.1038/nature12625. [DOI] [PubMed] [Google Scholar]
- Chen ZY, Zhong WZ, Zhang XC, Su J, Yang XN, Chen ZH, Yang JJ, Zhou Q, Yan HH, An SJ, et al. Oncologist. 2012;17:978–985. doi: 10.1634/theoncologist.2011-0385. [DOI] [PMC free article] [PubMed] [Google Scholar]
- Ding L, Ley TJ, Larson DE, Miller CA, Koboldt DC, Welch JS, Ritchey JK, Young MA, Lamprecht T, McLellan MD, et al. Nature. 2012;481:506–510. doi: 10.1038/nature10738. [DOI] [PMC free article] [PubMed] [Google Scholar]
- Gerlinger M, Rowan AJ, Horswell S, Larkin J, Endesfelder D, Gronroos E, Martinez P, Matthews N, Stewart A, Tarpey P, et al. N Engl J Med. 2012;366:883–892. doi: 10.1056/NEJMoa1113205. [DOI] [PMC free article] [PubMed] [Google Scholar]
- Merlo LM, Pepper JW, Reid BJ, Maley CC. Nat Rev Cancer. 2006;6:924–935. doi: 10.1038/nrc2013. [DOI] [PubMed] [Google Scholar]
- Mroz EA, Tward AD, Pickering CR, Myers JN, Ferris RL, Rocco JW. Cancer. 2013;119:3034–3042. doi: 10.1002/cncr.28150. [DOI] [PMC free article] [PubMed] [Google Scholar]
- Navin N, Krasnitz A, Rodgers L, Cook K, Meth J, Kendall J, Riggs M, Eberling Y, Troge J, Grubor V, et al. Genome Res. 2010;20:68–80. doi: 10.1101/gr.099622.109. [DOI] [PMC free article] [PubMed] [Google Scholar]
- Nowell PC. Science. 1976;194:23–28. doi: 10.1126/science.959840. [DOI] [PubMed] [Google Scholar]
- Park SY, Gönen M, Kim HJ, Michor F, Polyak K. J Clin Invest. 2010;120:636–644. doi: 10.1172/JCI40724. [DOI] [PMC free article] [PubMed] [Google Scholar]