

Abstract
The baboon provides a model of photosensitive, generalized epilepsy. This study compares cerebral blood flow (CBF) responses during intermittent light stimulation (ILS) between photosensitive (PS) and healthy control (CTL) baboons using H215O-PET. We examined effective connectivity associated with visual stimulation in both groups using structural equation modeling (SEM). Eight PS and six CTL baboons, matched for age, gender and weight, were classified on the basis of scalp EEG findings performed during the neuroimaging studies. Five H215O-PET studies were acquired alternating between resting and activation (ILS at 25 Hz) scans. PET images were acquired in 3D mode and co-registered with MRI. SEM demonstrated differences in neural connectivity between PS and CTL groups during ILS that were not previously identified using traditional activation analyses. First-level pathways consisted of similar posterior-to-anterior projections in both groups. While second-level pathways were mainly lateralized to the left hemisphere in the CTL group, they consisted of bilateral anterior-to-posterior projections in the PS baboons. Third- and fourth-level pathways were only evident in PS baboons. This is the first functional neuroimaging study using to model the photoparoxysmal response (PPR) using a primate model of photosensitive, generalized epilepsy. Evidence of increased interhemispheric connectivity and bidirectional feedback loops in the PS baboons represents electrophysiological synchronization associated with the generation of epileptic discharges. PS baboons demonstrated decreased model stability compared to controls, which may be attributed to greater variability in the driving response or PPRs, or to the influence of regions not included in the model.
Keywords: Intermittent Light Stimulation, Photosensitivity, Positron Emission Tomography, Cerebral Blood Flow, Structural Equation Modeling
Although almost 40% of individuals with recurrent unprovoked seizures have genetic generalized epilepsy (GGE; www.epilepsyfoundation.org/about/statistics.cfm), little is known about the underlying mechanisms. Photosensitivity, i.e. the ability to trigger ictal and interictal epileptic discharges with intermittent light stimulation (ILS), provides a window into the mechanisms of generalized epilepsies. Photoparoxysmal responses (PPRs) represent interictal epileptic discharges (IEDs) whereas photoconvulsive responses (PCRs) describe myoclonic, tonic or generalized tonic-clonic seizures associated with an ictal discharge. There is still debate regarding the mechanisms underlying PPRs. While PPRs in humans undergoing scalp EEG can be posteriorly predominant initially, generalized IEDs are characterized with a more frontal distribution (Kasteleijn-Nolst Trenite, 1989). Recent neuroimaging studies using magnetoencephalography (MEG; Parra et al. 2003) and blood oxygen level dependent (BOLD) functional MRI (Moeller et al. 2009) evaluated electrophysiological and cerebral blood flow (CBF) changes prior to PPRs. Both studies demonstrated that synchronization and activation of the parietal cortices prior to PPRs and PCRs, respectively (Parra et al. 2003; Moeller et al. 2009). Nonetheless, a recent study modeling scalp EEG responses suggested that PPRs and PCRs were generated frontally (Varotto et al. 2012), resonating with earlier electrophysiological studies in the photosensitive baboon which suggested that the PPRs and PCRs were generated in the frontorolandic cortices, whereas the occipital lobes served only as a trigger (Fischer-Williams et al. 1968; Naquet et al. 1975).
Photosensitivity studies in humans are limited by movement artifact, the risk of activating generalized seizures, and by potential suppression of the photosensitivity by antiepileptic medications. Because of these safety considerations in humans, and the potential to map these responses electrophysiologically with intracranial electrodes, an appropriate animal model is important. The epileptic baboon represents a natural animal model of photosensitive, generalized epilepsy (Killam 1979). Epileptic baboons exhibit rare spontaneous myoclonic and generalized tonic-clonic seizures, similar to those seen in humans with GGE. The epileptic baboon also demonstrates PPRs and PCRs resembling those recorded in humans. Among nonhuman primates, the baboon is well adapted to neuroimaging due to its brain size and similar structural and functional cortical anatomy.
H215O-PET also provides a direct means to evaluate CBF changes associated with physiological activation of the visual (Mintun et al. 1989) and extrastriatal (Mentis et al. 1997) cortices with ILS. Because of the relative ease of monitoring clinical seizure activity during radiotracer-uptake—since the baboons were not paralyzed—and of scalp EEG activity between PET scans, our group utilized H215O-PET to evaluate the CBF changes in the visual network underlying the photosensitive epilepsy of baboons (Szabó et al. 2007; Szabó et al. 2011). We decided to evaluate differences in inter-regional effective connectivity in PS and CTL groups as differences were found on previous comparisons of regional CBF responses during ILS (Szabó et al. 2007; Szabó et al. 2011).
In the present study, we extend beyond these prior neuroimaging activation analyses of functional connectivity (Szabó et al. 2007; Szabó et al. 2011), and investigate the “effective” connectivity of the network associated with photosensitivity in epileptic baboons, as delineated by the causal inference relationships between neural regions during the visual stimulation (Friston et al 2003). Evaluation of the effective connectivity associated with the photoparoxysmal response provides a model for altered cortico-cortical interactions associated with photosensitivity. Effective connectivity was examined using structural equation modeling (SEM)—a well-established statistical technique used to test and estimate causal relationships (Schumacker and Lomax 2004) in which models are comprised of variables representing brain regions and paths representing connections between brain regions (McIntosh et al. 1994; Laird et al. 2008; Price et al. 2009). SEM is the analytic technique of choice because of the single-capture nature of PET. Other connectivity modeling techniques, such as Granger causality and dynamic causal modeling, are applied models defined a priori, and require time series data to model connectivity between regions typically acquired by functional MRI.
As a statistical analysis method, SEM computes partial correlations among a set of mutually influential variables (Harris, 1975). Although not originally created for neural-system modeling, SEM has proven to be remarkably well suited for modeling connectivity in a variety of modalities and paradigms (McIntosh et al. 1994), and has a well-established literature base (Zhuang et al. 2005, Peltier et al. 2007, Laird et al. 2008). SEM uses fit statistics generated from assessing the extent of difference between the observed covariance matrix of the data and one generated by the model to determine overall fit of the model and suggest improvements in an exploratory setting. Optimal SEM models seek maximal covariance between regions of interest using as few connections as possible.
As SEM can be used to model the covariance between regional time series using a linear equation system yielding unidirectional path weights, we were able to examine connections between brain regions and, subsequently, make inferences regarding regional influences. Here, we modeled the CBF changes during a visual stimulation, with the response originating from the occipital lobes. Path weights were calculated for each level of connectivity (i.e. projections from visual cortices represent the first level, subsequent projections from the target nodes represent the second level pathways). The resultant connectivity observed between regions associated with the visual network was then evaluated during physiological and photoparoxysmal CBF responses to ILS.
The overall objective of this study was to map the effective connectivity of the physiological response in healthy baboons to ILS and of pathophysiological networks associated with photosensitivity. We hypothesized that SEM would reveal symmetrical physiological pathways emanating from the visual cortices, with activation of more extensive frontoparietal cortico-cortical circuits subserving the epileptic networks in the photosensitive baboons (Szabó et al. 2007).
Methods
The baboon represents a natural model of GGE. Epileptic baboons usually demonstrate sporadic spontaneous myoclonic or generalized tonic-clonic seizures and have both generalized ictal and interictal discharges on scalp EEG (Szabó et al. 2013). More importantly, interictal epileptic discharges and seizures may be provoked by ILS in about 40% of the epileptic baboons, providing a reliable tool to provoke PPRs or PCRs in a laboratory setting. Eight photosensitive (PS) and six control (CTL) baboons (Papio hamadryas (P.h.) anubis and hybrids) were selected from a database of animals housed at the Southwest National Primate Regional Center (SNPRC) at the Texas Biomedical Research Institute (TBRI; San Antonio, Texas) that had undergone scalp EEG studies (Szabó et al. 2013). Four (50%) PS baboons had a history of spontaneous seizures and seven (88%) had IEDs and photoepileptic responses on a previous scalp EEG study. Nonetheless, all of the PS baboons were selected on the basis of positive PPRs and PCRs during the PET scans. Six (75%) PS baboons also had IEDs during the resting scans. None of the CTL animals had positive PPRs or PCRs during their PET scans nor myoclonic seizures or IEDs during their resting scans. None of the CTL baboons had a history of spontaneous seizures and all had previously normal scalp EEG studies.
PPRs were defined as the average IED rate during activation scans being at least twice the rate in the averaged resting trials for each baboon, and PCRs as an activation or increase of myoclonic seizures (PCR) compared to baseline. The presence or absence of PPR or PCR responses as well as the level of sedation were assessed by review of scalp EEG as described previously (Szabó et al. 2007). There were no significant differences in age or weight between the PS and CTL groups by two-tailed Student t-tests (α<0.05) (Table 1). The baboons were treated in strict accordance with the U.S. Public Health Service's Guide for the Care and Use of Laboratory Animals and the Animal Welfare Act (Committee, 2011). The Institutional Animal Care and Use Committees of UTHSCSA and TBRI approved this study. The PET studies were performed in the morning, when baboons are maximally photosensitive (Killam 1979).
Table 1. Demographic and Procedural Information.
EDs interictal epileptic discharges, MS myoclonic seizures, PS photosensitive.
| Groups | Photosensitive | Control |
|---|---|---|
| Gender | 8 Females | 6 Females |
| Age | 21 +/- 5 years | 14 +/- 7 years |
| Weight | 19 +/- 4 kg | 18 +/- 1 kg |
| Ketamine Dose | 136 +/- 49 mg/hr | 170 +/- 46 mg/hr |
| Trials used in SEM | 14 activation scans 21 resting scans |
12 activation scans 9 resting scans |
| EEG Findings in the Photosensitive Baboons | ||
| EEG Samples | Resting | ILS |
| IEDs | 12 (54%) | 14 (100%) |
| Seizures | 5 (23%) trials in 3 baboons | 6 (42%) trials in 4 baboons |
| Number of IEDs and seizures per scan | 2 +/- 3 Median 1 |
7 +/- 4 Median 7 |
PET and MRI Scans
EEG electrodes were affixed and soft restraints and facemask or Velcro straps were fitted to limit head movement in the scanner. A continuous ketamine (KetaVed, Phoenix Scientific, St. Joseph, Missouri) infusion (initially at 6 mg/kg/hr) was then started. Atropine (0.5 mg) was given intramuscularly to reduce oropharyngeal secretions. The animals' EEG, respiration and movement were monitored to assure adequate, but minimal sedation. Dynamic PET images were acquired on a CTI/Siemens HR+ scanner (Siemens, Munich, Germany; 63 contiguous slices, 2.4 mm thickness, 12 frames of 10 seconds each) in 3D mode; a transmission scan was performed for attenuation correction. PET processing, including correction of inter-frame and inter-scan motion, is described elsewhere (Szabó et al. 2007; Szabó et al. 2011). Each baboon received five injections of radioactive tracer (20mCi H215O), with each injection delivered at 8-10 minute intervals. The first, third and fifth scans measured resting CBF, during which the baboons remained in a lightly sedated state, while ILS was delivered at 25 Hz during the second and fourth scans, starting 60 seconds before until 90 seconds after the injection of the radiotracer (for block design, see Figure 1). Scalp EEG was simultaneously recorded using eight scalp electrodes (Nihon Kohden, Japan). As the PET and EEG were not supported on the same platform, the EEG recording was marked at the time of each injection. From 28 activation and 42 resting scans that were acquired, 26 activation and 30 resting scans were included in the analysis (Table 1). The remaining scans were excluded either because of motion artifact or over-sedation. Overall, photoepileptic events, including brief IEDs and myoclonic seizures (<0.5 seconds), were increased in the PS group from 2+/-3 (median 1) at rest per 90 second H215O-uptake period to 7+/-4 (median 7) during ILS.
Figure 1. Acquisition and ROI Selection.
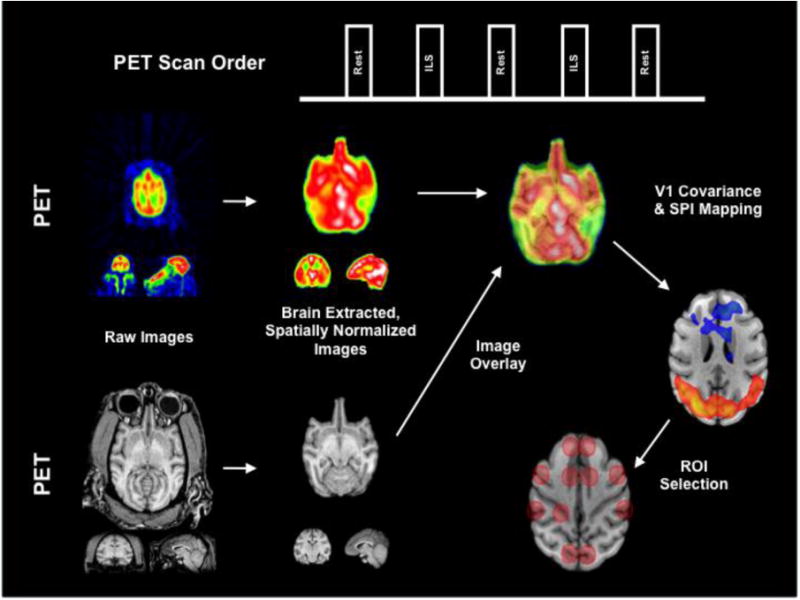
The block design of the PET acquisition is shown. Once acquired, the PET and MRI raw images were spatially processed, then analyzed using statistical parametric imaging and covariance mapping to determine the ROIs used for SEM. This figure was adapted from Szabo et al. (2011) and has been reproduced with permission.
At the end of each PET session, a high-resolution (500μm isotropic), high gray-matter/white-matter contrast (∼25%) and T1-weighted (∼25 signal-to-noise) images were acquired using a retrospective motion-corrected protocol on Siemens 3T Trio MRI scanner (Siemens, Munich, Germany). MRI processing, as well as PET/MRI coregistration, was described elsewhere (Figure 1; Szabó et al. 2007; Szabó et al. 2011; Lancaster et al. 1999).
Structural Equation Modeling
Eight homologous regions of interest were identified using a data-driven composite of the results obtained from both statistical parametric imaging and covariance mapping during the ILS/PET sessions; as reported previously, these regions were consistently activated during ILS/PET sessions (Szabó et al. 2011). Since we utilized a data-driven approach, brain regions—such as the thalamus—whose group averages for activation or deactivation did not reach statistical significance in either the ILS/PET statistical parametric or covariance maps were not included in the SEM model. In a previous analysis, performed on the same PET dataset (8 PS and 6 CTL baboons) presented in this study, Szabó et al. (2011) found that there were no significant global or regional CBF differences between the PS and CTL baboon groups at rest, despite evidence of a few (median = 1) ictal or interictal epileptic discharges in the PS group.
The eight ROIs included: the primary visual (V1) and primary motor areas (M1), parieto-temporal (PT), anterior inferior parietal lobe (AIP), superior parietal lobe (SP), anterior cingulate (AC), orbitofrontal regions (OF), and posterior cingulate (PC). The averaged, value normalized PET counts were extracted from all ROIs with cubic volumes of 1000 mm3. These data were analyzed using Amos 7.0 for SEM (Arbuckle 2006). Each ROI was modeled as an observed variable, while ILS rate was modeled as a separate observed variable directly modulating the stimulated site (i.e. bilateral visual cortices). The values of this intensity variable were 0 (representing the rest condition), and 1 (representing the condition in which ILS was applied at 25 Hz). Error terms on each ROI were modeled as unknown and exogenous variables and the regression weights of these error terms were set to a value of 1.
As mentioned above, rather than postulate a structural equation model based on a priori assumptions (confirmatory SEM), we proceeded with a data-driven, model-generating procedure to identify the best-fit model for the given data set (exploratory SEM; Laird et al. 2008). We assumed that all regional connections were dependent upon the occipital lobe stimulation with ILS; hence this initial interaction was explicitly modeled in the analysis. The exploratory SEM analysis was performed stepwise, beginning with a unidirectional input path that linked ILS to the occipital regions. From these original paths, all other ROIs were postulated as unidirectional output paths from the stimulation site. Each path was tested using the exploratory specification search function in SPSS Amos (IBM, Inc.; Arbuckle 2006). Specification searches allow for a large number of candidate models to be simultaneously tested using optional unidirectional path loadings to determine the most appropriate choice based on fit, parsimony, and interpretability. These initial connections originating from the site of stimulation (i.e. V1/V2) were considered to be first-level connections; once these were established, second-level paths were tested from each of the primary connections, and the third-level paths from the secondary connections, and so forth, until this iterative procedure failed to identify any further paths to improve model fit, resulting in a fully specified model. We utilized the root mean square error of approximation (RMSEA), Tucker Lewis Index (TLI), Goodness of Fit Index (GFI) to assess overall model fit and the Bayes information criterion (BIC) was used to prevent over-fitting (Laird et al. 2008).
Results
SEM in Healthy Baboons
The number of data points in the CTL group was 21 (6 subjects, 2 conditions, 12 rest and 9 ILS trials) with 16 variables: 8 observed, endogenous variables for each ROI and 8 unobserved, exogenous variables representing the error terms loaded onto those ROIs. The PC and inferior parietal regions, as well as the right SP, AC, OF and PT regions did not demonstrate significant connectivity, and were not included in the model.
Model fit statistics
Measures of model goodness of fit for two levels of specification searches (Table 2) show that as expected, the initial model did not fit the data well and the second round of specification searches generated an extremely large increase in the P value, resulting in the non-significance of the model (P<0.0003 for first-level paths to P=0.987 for second-level paths; Table 2). This large transition indicates the introduction of critical paths during the second-level of the analysis. After the second round of specification searches, the estimates were calculated and it was determined that the overall final model fit was outstanding (χ2=2.731, df=10, P=0.987, TLI=1.205, GFI=0.921, RMSEA=0.0000). These statistics indicate little difference between the sample variance–covariance matrix and the reproduced variance–covariance matrix implied by this model (Schumacker and Lomax, 2004).
Table 2. Fit statistics of SEM for CTL (8 ROIs) and PS (11 ROIs) groups at each level of analysis.
Overall model goodness improved as more paths were added via specification search. In the CTL group, the first-level cascade contained 6 loadings originating from left and right V1 (Fig. 2A, black paths). The second-level paths added 10 additional loadings to the model (16 total paths; Fig. 2A, black, striped paths). In the PS group, the first-level cascade still contained 4 loadings originating from left and right V1 (Fig. 2B, black paths). However, the second-level paths added 7 additional loadings to the model (Fig. 2B, black, striped paths). The third-level paths added 6 additional loadings to the model (Fig. 2B, gray paths), and finally the fourth-level paths added 2 more loadings to the final model (Fig. 2B, gray, striped paths). DF = degrees of freedom; P = probability of getting as large a discrepancy as occurred with the present sample (P value for testing that the model fits perfectly in the given population). Larger values of P indicate a better fit of the model. RMSEA = root mean square error of approximation, TLI = Tucker Lewis Index; BIC(0) = Bayes information criterion, scaled such that the minimum value for the tested models equals zero; smaller values indicate a higher degree of goodness than larger values. L(eft), R(ight), V1 primary visual, SP superior parietal, PT parietotemporal, M1 primary motor, AC anterior cingulate, OF orbitofrontal cortices.
| Study Groups | χ2 | DF | P | RMSEA | TLI | BIC (0) |
|---|---|---|---|---|---|---|
| Control Baboons | ||||||
| No paths | 127.097 | 28 | 0.000 | 0.550-0.785 | 0.000 | NA |
| First-level paths | 78.175 | 20 | 0.000 | 0.466-0.767 | 0.178 | 7.33 |
| Second-level paths | 2.731 | 10 | 0.987 | 0.000-0.000 | 1.205 | 4.15 |
| Photosensitive Baboons | ||||||
| No paths | 101.282 | 55 | 0.000 | .175-.331 | 0.000 | n/a |
| First-level paths | 88.351 | 50 | 0.001 | .157-.325 | 0.088 | 86.01 |
| Second-level paths | 60.702 | 43 | 0.039 | .043-.275 | 0.511 | 189.92 |
| Third-level paths | 31.780 | 37 | 0.712 | .000-.153 | 1.168 | 127.08 |
| Fourth-level paths | 23.659 | 35 | 0.927 | .000-.064 | 1.385 | 43.88 |
Effective Connectivity of the Visual System
The effective connectivity of the visual system in healthy baboons as modeled by SEM is shown in Figure 2A. Regression weights for these paths can be seen in Table 3. The first-level pathways were symmetrical, revealing visuomotor connectivity within each hemisphere. The right (R) V1 demonstrated significant connectivity to left (L) hemispheric regions, including LOF, LAC and LM1 cortices, while LV1 demonstrated significant connectivity to LSP and RV1. The second-level pathways arose from LPT, LSP, LAC, LOF and RM1 regions, most of these converging on left M1.
Figure 2. Final model of effective connectivity in visual networks of CTL and PS baboons exposed to ILS.
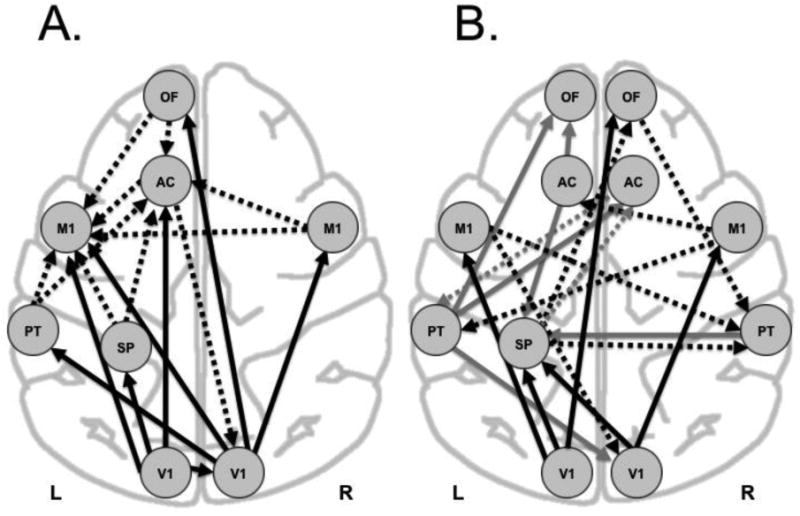
Panel A shows the CTL group, Panel B the PS group. Black arrows=first-level paths from visual cortices; black, striped arrows=second-level paths; gray arrows=third-level paths; and gray, striped arrows=fourth-level paths. L(eft), R(ight), V1 primary visual, SP superior parietal, PT parietotemporal, M1 primary motor, AC anterior cingulate, OF orbitofrontal cortices.
Table 3. Maximum likelihood estimates of CTL and PS models.
Estimate = estimate of the standardized regression weight; S.E. = standard error of the regression weight; CR = critical ratio for regression weight, which is computed by dividing the regression weight estimate by the estimate of its standard error; P = level of significance for regression weight.20
| Control Baboons | ||||
|---|---|---|---|---|
| Paths | Estimate | S.E. | C.R. | Probability |
| 1. LV1→LSP | 0.700 | 0.259 | 2.703 | 0.007 |
| 1. LV1→RV1 | -1.510 | 0.495 | -3.049 | 0.002 |
| 1. LV1→LAC | 0.017 | 0.064 | 0.271 | 0.786 |
| 1. LV1→LM1 | -0.349 | 0.007 | -50.477 | <0.001 |
| 1. RV1→RM1 | 0.716 | 0.279 | 2.567 | 0.010 |
| 1. RV1→LM1 | 0.237 | 0.005 | 51.766 | <0.001 |
| 1. RV1→LPT | -0.099 | 0.206 | 00.481 | 0.631 |
| 1. RV1→LOF | 0.130 | 0.054 | 2.401 | 0.016 |
| 2. LSP→LAC | -0.512 | 0.053 | -9.687 | <0.001 |
| 2. LSP→LM1 | -0.265 | 0.017 | -15.223 | <0.001 |
| 2. LPT→LM1 | 0.424 | 0.032 | 13.136 | <0.001 |
| 2. LPT→LAC | 0.973 | 0.060 | 16.097 | <0.001 |
| 2. LOF→LAC | 0.370 | 0.158 | 2.337 | 0.019 |
| 2. LOF→LM1 | -0.108 | 0.020 | -5.471 | <0.001 |
| 2. LAC→RV1 | -1.257 | 0.638 | -1.969 | 0.049 |
| 2. RM1→LAC | 0.382 | 0.039 | 9.718 | <0.001 |
| 2. RM1→LM1 | 0.298 | 0.013 | 23.046 | <0.001 |
| Photosensitive Baboons | ||||
| 1. LV1→LSP | -0.101 | 0.172 | -0.585 | 0.558 |
| 1. LV1→LM1 | -0.387 | 0.192 | -2.022 | 0.043 |
| 1. LV1→ ROF | 0.020 | 0.203 | 0.097 | 0.923 |
| 1. RV1→RM1 | 0.221 | 0.318 | 0.695 | 0.487 |
| 1. RV1→LSP | 0.999 | 0.213 | 4.691 | <0.001 |
| 2. LM1→RPT | -0.652 | 0.228 | -2.856 | 0.004 |
| 2. LM1→RV1 | -0.550 | 0.242 | -2.275 | 0.023 |
| 2. LSP→RPT | -0.379 | 0.213 | -1.784 | 0.074 |
| 2. LSP→ROF | -0.595 | 0.246 | -2.414 | 0.016 |
| 2. RM1→LAC | -0.367 | 0.229 | -1.603 | 0.109 |
| 2. RM1→LPT | 0.601 | 0.195 | 3.086 | 0.002 |
| 2. ROF→LM1 | -1.302 | 0.292 | -3.530 | <0.001 |
| 3. LPT→LOF | 0.428 | 0.216 | 1.986 | 0.047 |
| 3. LPT→RAC | 0.119 | 0.273 | 0.434 | 0.664 |
| 3. LPT→RV1 | 0.601 | 0.211 | 2.841 | 0.004 |
| 3. LAC→LOF | 0.910 | 0.269 | 3.387 | <0.001 |
| 3. LAC→LSP | 0.855 | 0.204 | 4.182 | <0.001 |
| 3. RPT→LSP | -0.697 | 0.203 | -3.434 | <0.001 |
| 4. LSP→RAC | -0.506 | 0.256 | -1.974 | 0.048 |
| 4. RAC→LPT | 0.775 | 0.285 | 2.722 | 0.006 |
A non-recursive loop is reflected in the final model, involving the nodes RV1, RM1, LOF and LAC cortices (Figure 2A). Non-recursive relations pose a unique challenge during simultaneous estimation of the model structural coefficients due to an infinite sequence of linear dependencies among nodes. For some regression weights, these dependencies will converge to a set of well-defined relations, thereby exhibiting system stability. To ensure that an adequate level of stability for the network system was achieved (within the range of − 1.0 to + 1.0) (Bentler and Freeman 1983; Fox 1980), we used an instrumental variable design strategy (Heise 1975). Once implemented, the stability of the recursive loops and the entire system was estimated using the full information maximum likelihood (FIML) estimation algorithm with the invoked ridge regression option (statistical basis for evaluating the stability of the non-recursive path model) (Laird et al. 2008; Bentler and Freeman, 1983). The stability index was observed as 0.431, indicating a mathematically stable solution.
SEM in Photosensitive Baboons
The number of data points in the PS group was 35 (8 subjects, 2 conditions, 21 rest and 14 ILS trials) with 16 variables: 11 observed, endogenous variables for each ROI and 11 unobserved, exogenous variables representing the error terms loaded onto those ROIs.
Model fit statistics
Measures of model goodness of fit for four levels of specification searches (Table 2) show that while the initial model of only 4 loadings did not fit the data well, additional levels of analysis improved the fit of the model dramatically. This transition possibly reflects the introduction of critical paths during that stage of the analysis. After the fourth round of specification searches, the estimates were calculated and it was determined that the overall final model fit was outstanding (χ2=23.659, df=35, P=0.927, TLI=1.385, GFI=0.806, RMSEA=0.0000). Recursive loops are present in the final model, involving nodes RV1, RM1 and LPT, and LSP, ROF, and RPT, respectively, as well as reciprocal connections between LSP and RPT or RAC and LPT.
Effective Connectivity of the Visual System in Photosensitive Baboons
The effective connectivity of the visual system in the photosensitive baboons as modeled by SEM is shown in Figure 2B, and regression weights of these paths can be found in Table 3. Two of three visuomotor connections seen in the CTL group were maintained in first-level pathways of the PS baboons. While the visuomotor connections were less significant in the PS group, particularly from the right occipital lobe, subsequent levels of connectivity demonstrated significance, suggesting either decreased activation or increased inhibition of the visual cortices in the response to ILS, or activation of the motor cortices through alternate nodes not included in the model. Surprisingly, effective connectivity diverged between the two groups at the second-level pathways. LM1 was no longer the target of multiple ipsilateral or contralateral, extrastriatal regions. Instead, second-level, anterior-to-posterior, pathways arose from the motor cortices, targeting contralateral posterior regions, such as LPT and RPT, as well as RV1. Third-level connectivity was represented by recursive (LPT to RV1) and reciprocal (RPT and LSP) pathways. Fourth-level pathways demonstrated connectivity between LSP and RAC, and RAC and LPT, respectively. Latency variables were higher in the PS compared to the CTL baboons, suggesting increased connectivity to regions not included in this model (Table 4). The stability index was observed as 0.399, indicating a mathematically stable solution.
Table 4. Latency Variables Loading on the ROIs of both SEM models.
Higher values are correlated with increased latent connectivity of each region with ROIs not included in these models. L(eft), R(ight), V1 primary visual, SP superior parietal, PT parietotemporal, M1 primary motor, AC anterior cingulate, OF orbitofrontal cortices.
| Regions of Interest | CTL (N=8) | PS (N=11) |
|---|---|---|
| LV1 | 0.53 | 1.18 |
| RV1 | 0.55 | 0.56 |
| LM1 | 0.00 | 0.57 |
| RM1 | 0.57 | 0.93 |
| LAC | 0.01 | 0.77 |
| RAC | NA | 0.64 |
| LPT | 0.23 | 0.47 |
| RPT | NA | 0.50 |
| LSP | 0.28 | 0.42 |
| LOF | 0.03 | 0.72 |
| ROF | NA | 0.63 |
Discussion
The goal of this study was to evaluate the effective connectivity of the visual pathways of healthy control and photosensitive baboons in response to intermittent light stimulation (ILS) at 25 Hz—the optimal frequency for activation of ictal or interictal discharges in PS baboons (Killam, 1979). The data-driven (i.e. exploratory) structural equation modeling (SEM) implemented in this study developed best-fit models using the functional imaging measurements of cerebral blood flow (CBF). These exploratory models represent theoretical relationships between network nodes involved in the visual system. Although the exploratory SEM approach provided a data-driven model of the visual system's effective connectivity, any causal inferences made by this model should be validated using direct electrophysiological recordings.
As the occipital lobes represent the first cortical regions activated by ILS, we expected SEM to reveal cortico-cortical connections downstream from primary visual connections. While the number of regions identified by the model may have been limited by sample size and selection of regions, there were stark differences in effective connectivity between the CTL and PS groups. In the CTL baboons, the model of the physiological activation of the visual network stabilized at the second level of path iterations. While left and right occipital lobes demonstrated different patterns of connectivity, the left-sided predominance of ROIs reflect increased connectivity within the left hemisphere. The PS group demonstrated similar first-level pathways, but greater inter-hemispheric connectivity and increased connectivity of frontal and parietal and cortices within each hemisphere, as would be expected in a generalized epileptic network. The model for the PS group required additional levels of model specification prior to stabilization compared to the CTL group (i.e. PS group required testing of four levels of pathways whereas the CTL group only required testing of second-level paths), reflecting a more complex model associated with photosensitivity.
Cerebral Blood Flow Responses in Healthy Controls
In the CTL animals, the occipital regions demonstrated hemispheric variability in their connectivity, with the right occipital lobe projecting to both motor cortices and the left occipital lobe projecting only ipsilaterally. The predominance of the left-sided interactions was consistent with our previous covariance studies, which demonstrated more widespread left hemispheric cerebral blood flow (CBF) changes correlated to left occipital activation (Szabó et al. 2011). One possible explanation for this is enhanced connectivity subserving higher integrative functions (i.e. communication or emotion) which may be lateralized to the left hemisphere of baboons (Meguerditchian and Vauclair 2006). Similarly, more second level pathways involved the left than the right motor cortex. Covariance analyses in these same baboons demonstrated CBF decreases in the primary motor cortex with increasing occipital CBF, suggesting inhibition of the motor cortices (Szabó et al. 2011). However, caution must be warranted regarding the interpretation of positive or negative correlations of these pathways, as TMS studies stimulating the primary motor cortices during ILS in healthy humans actually reduced the cortical silence period, suggesting reduced intracortical inhibition (Strigaro et al. 2013).
Photoepileptic Response
Simultaneous EEG-recordings confirmed the activation of photoparoxysmal (PPRs) and photoconvulsive (PCRs, myoclonic seizures) responses in the PS baboons. Nonetheless, connectivity of the visual cortices remained similar between the PS and CTL groups, as did the left hemispheric predominance of the pathways. These findings support that photosensitivity depends upon intact visual pathways. However, compared to the CTL group, PS baboons demonstrated weaker visuomotor connections, particularly related to the right occipital region. This is counterintuitive, as intracranial EEG recording in photosensitive baboons demonstrate ictal and interictal epileptic discharges being activated by ILS in photosensitive baboons (Naquet et al. 1975). Nonetheless, in contrast to healthy subjects, TMS of the primary motor cortices during ILS in photosensitive patients does not alter the cortical silent period, supporting either an alteration of visuomotor connectivity or evidence of compensatory mechanisms within the larger cortical-subcortical networks (Groppa et al. 2008; Strigaro et al. 2013). Compensatory mechanisms were suggested by a recent EEG-fMRI study of PPRs in photosensitive JME patients, demonstrating a more prolonged reduction of BOLD signal in the motor cortices and basal ganglia after a brief activation of the striatal/extrastriatal and motor cortices (Bartolini et al. 2014). Another explanation for reduced connectivity may be a recently reported reduction of neurons in the primary sensorimotor cortices of epileptic baboons (Young et al. 2014). Nonetheless, the weakening of visuomotor connectivity did not appear to affect second-level connections arising from the motor cortices. At the second level, the pathways, linking both hemispheres, appeared predominantly anterior-to-posterior, similar to a synchronization or connectivity pattern described prior to PPR or PCRs in humans (Varotto et al. 2012). The third and fourth levels of connectivity, were represented by reciprocal pathways emanating from the posterior temporal, parietal lobe and anterior cingulate regions, with the recurrent connectivity resulting in further synchronization of both hemispheres. Whether this synchronization represents the activation state prior to the generation of ictal or interictal epileptic discharges or post-discharge inhibition, or reflects a steady-state connectivity between the ictal and interictal epileptic discharges, needs to be addressed by intracranial electrophysiological studies evaluating coherence and synchronization of EEG during visual stimulation.
The only node to be linked at every level of connectivity was the left superior parietal region, reflecting an important role of the underlying intraparietal sulcus in the epileptic network, also supported by functional studies in humans (Parra et al. 2003; Moeller et al. 2009) and structural imaging in the baboon (Szabó et al. 2011). The intraparietal sulcus, represents an important node in the PPR of photosensitive baboons, connecting occipital lobes with the premotor cortices (Catier et al. 1975), and may play a modulating role in the generation of photoepileptic responses.
Increased latency variables can arise for several reasons, including bias in ROI selection, over-fitting of the model, and misspecification of the starting point in the model. While SEM, using the same parameters in the CTL baboons, demonstrated that ROIs reflecting the most significant CBF changes satisfied the model, the influence of latent variables was deemed to be limited (Table 3). Therefore, the high latency coefficients in the PS baboons suggest an important role of other regions not included in the model. Other regions of interest with high connectivity participate in these feedback loops, such as the precuneus, insula or supplementary sensorimotor area (SSMA), all structures that are extensively connected with the frontal, parietal and occipital cortices and which have been associated with CBF changes in EEG-fMRI studies (Bai et al. 2010; Benuzzi et al. 2012). These regions were not included in our model because they did not demonstrate significant CBF changes during the PPR in earlier conditional contrast and covariance studies (Szabó et al. 2007; Szabó et al. 2011). The thalamus is another structure extensively connected with the frontoparietal cortices, which is typically activated in the setting of prolonged generalized spike-and-wave discharges or absence seizures in humans (Bai et al. 2010; Benuzzi et al. 2012), and in the setting of sustained repetitive IEDs in the epileptic baboon (Fischer-Williams et al. 1968; Szabó et al. 2008; Silva-Barrat et al. 1986). However, as most of the PPRs were brief and PCRs were restricted to brief myoclonic seizures in the PS baboons, it not surprising that the thalamus was not involved or significantly activated. Both in intracranial EEG studies in baboons, and in human EEG-fMRI studies, the thalamus was rarely co-activated in association with discrete PPRs (Moeller et al. 2009; Silva-Barrat et al. 2008). It is possible, nonetheless, that with a larger sample size, other cortical and subcortical structures that are activated in association with spontaneous IEDs would emerge as nodes of the epileptic network (Szabó et al. 2008).
Shortfalls
Some disadvantages of this study compared to recently published human studies include the choice of the imaging modality and the overall need to sedate the animals. While H215O-PET is more lenient with respect to movement artifact related to motor seizures, it has less spatial and temporal resolution than BOLD-MRI. CBF changes are measured during the ninety-second H215O-uptake period, averaging CBF either preceding, during or after ictal or interictal epileptic discharges. It was not conducive for temporally correlating IEDs with CBF as the EEG recording ran on a separate platform. EEG-fMRI may be implemented to evaluate hemodynamic changes independently of ictal or interictal epileptic discharges during rest or ILS (assuming they are infrequent); sorting out CBF contributions due to epileptic discharges may allow differentiation of transient network reconfigurations from steady-state connectivity. Furthermore, ketamine was used to lightly sedate the baboons. As mentioned above, ketamine can alter resting CBF in a dose-dependent fashion (Szabó et al. 2008), particularly in epileptic baboons. It can also induce IEDs or seizures at low doses (Szabó et al. 2005). In order to minimize the depth of sedation, the animal's behavior and EEG were closely monitored. H215O-PET did allow continuous on-line observation of seizure activity, state changes and the depth of anesthesia, which was previously not feasible on functional MRI platforms. IEDs and myoclonic seizures were quantified during resting and activation scans, and were consistently increased with ILS in the PS baboons. The effect of antiepileptic medications on CBF and connectivity also need to be factored into human imaging studies (Moeller et al. 2009; Kay et al. 2013).
Advantages
This study employed a steady-state activation protocol, which included one minute of ILS prior to radionuclide injection to optimize and stabilize the induced CBF signal (Ito et al. 2001). This method of ILS would be extremely difficult to perform in patients with photosensitive epilepsy, particularly if not medicated. While the weakening of the visuomotor connections could indiscriminately implicate downstream modeling (Kim and Horwitz, 2009), steady-state activation provides a stable platform to evaluate effective connectivity across subsequent levels of pathways associated with photosensitivity.
Conclusions
SEM revealed the effective connectivity for the visual network in healthy and photosensitive baboons. In the CTL group, first-level pathways were relatively symmetric, but second-level connections were lateralized to the left hemisphere. While first-level pathways were similar between PS and CTL animals, interhemispheric connectivity was increased in the PS baboons from the second level of pathways onwards. In contrast to electrophysiological studies in photosensitive baboons (Naquet et al. 1975) or humans (Varotto et al. 2012), PPRs seem to require synchronization of frontoparietal networks beyond the frontorolandic cortices. It is essential for future electrophysiological and/or cortical stimulation studies to confirm the roles and causality of these brain regions (or networks) in the generation or modification of PPR.
Acknowledgments
This study was supported by the National Institutes of Health (P51 RR013986 and R21 NS065431-01 to CÁS, Ruth L. Kirschstein National Research Service Award (F32) NS066694 to FSS, and R01 NS047755-01 to JTW) and used primate resources of the Texas Biomedical Research Institute in San Antonio, Texas, supported by the Research Facilities Improvement Grants C06 RR013556, C06 RR014578, and C06 RR015456.
Footnotes
Ethical Standards: Animal studies have been approved by the Institutional Animal Care and Use Committee of the UTHSCSA, and have therefore been performed in accordance with the ethical standards laid down in the 1964 Declaration of Helsinki and its later amendments. The manuscript does not include clinical studies or patient data.
Disclosures: The authors declare that they have no conflict of interest.
References
- Arbuckle JL. Amos 7.0 User's Guide. SPSS; Chicago: 2006. [Google Scholar]
- Bai X, Vestal M, Berman R, Negishi M, Spann M, Vega C, Desalvo M, Novotny EJ, Constable RT, Blumenfeld H. Dynamic time course of typical childhood absence seizures: EEG, behavior, and functional magnetic resonance imaging. J Neurosci. 2010;30:5884–5893. doi: 10.1523/JNEUROSCI.5101-09.2010. [DOI] [PMC free article] [PubMed] [Google Scholar]
- Bartolini E, Pesaresi I, Fabbri S, Cecchi P, Giorgi FS, Sartucci F, Bonuccelli U, Cosottini M. Abnormal response to photic stimulation in juvenile myoclonic epilepsy: an EEG-fMRI study. Epilepsia. 2014;55:1038–1047. doi: 10.1111/epi.12634. [DOI] [PubMed] [Google Scholar]
- Bentler PM, Freeman EH. Tests for stability in linear structural equation systems. Psychometrika. 1983;48:143–145. [Google Scholar]
- Benuzzi F, Mirandola L, Pugnaghi M, Farinelli V, Tassinari CA, Capovilla G, Cantalupo G, Beccaria F, Nichelli P, Meletti S. Increased cortical BOLD signal anticipates generalized spike and wave discharges in adolescents and adults with idiopathic generalized epilepsies. Epilepsia. 2012;53:622–630. doi: 10.1111/j.1528-1167.2011.03385.x. [DOI] [PubMed] [Google Scholar]
- Catier J, Charmasson G, Pellet W, Christolomme A, Naquet R. Advantages of combining neuroanatomical and electrophysiological techniques in the study of intrahemispheric cortical connections in the photosensitive baboon. Exp Neurol. 1975;48:392–405. doi: 10.1016/0014-4886(75)90002-3. [DOI] [PubMed] [Google Scholar]
- Committee for the Update. Guide for the Care and Use of Laboratory Animals. Eighth. National Academy Press; Washington, D.C: 2011. [Google Scholar]
- Fischer-Williams M, Poncet M, Riche D, Naquet R. Light-induced epilepsy in the baboon Papio papio: Cortical and depth recordings. Electroencephalogr Clin Neurophysiol. 1968;25:557–569. doi: 10.1016/0013-4694(68)90235-6. [DOI] [PubMed] [Google Scholar]
- Fox J. Effect analysis in structural equation models. Soc Methods Res 1980. 1980;9:3–28. [Google Scholar]
- Friston K, Frith C, Frackowiak RSJ. Time-dependent changes in effective connectivity measured with PET. Hum Brain Mapp. 1993;1:69–79. [Google Scholar]
- Groppa S, Siebner HR, Kurth C, Stephani U, Siniatchkin M. Abnormal responses of motor cortex stimulation in idiopathic generalized epilepsy. Epilepsia. 2008;49:2022–2029. doi: 10.1111/j.1528-1167.2008.01709.x. [DOI] [PubMed] [Google Scholar]
- Harris RJ. A Primer of Multivariate Statistics. New York: Academic Press; 1975. [Google Scholar]
- Heise DR. Causal Analysis. John Wiley & Sons; New York: 1975. [Google Scholar]
- Ito H, Takahashi K, Hatazawa J, Kim SG, Kanno I. Changes in human regional cerebral blood flow and cerebral blood volume during visual stimulation measured by positron emission tomography. J Cereb Blood Flow Metab. 2001;21:608–612. doi: 10.1097/00004647-200105000-00015. [DOI] [PubMed] [Google Scholar]
- Kasteleijn-Nolst Trenité DGA. Photosensitivity in epilepsy: Electrophysiological and clinical correlates. Acta Neurol Scand Suppl. 1989;125:3–149. [PubMed] [Google Scholar]
- Kay BP, DiFrancesco MW, Privitera MD, Gotman J, Holland SK, Szaflarski JP. Reduced default mode network connectivity in treatment-resistant idiopathic generalized epilepsy. Epilepsia. 2013;54:461–470. doi: 10.1111/epi.12057. [DOI] [PMC free article] [PubMed] [Google Scholar]
- Killam EK. Photomyoclonic seizures in the baboon, Papio papio. Federation Proc. 1979;38:2429–2433. [PubMed] [Google Scholar]
- Kim J, Horwitz B. How well does structural equation modeling reveal abnormal brain anatomical connections? An fMRI simulation study. Neuroimage. 2009;45:1190–1198. doi: 10.1016/j.neuroimage.2009.01.006. [DOI] [PMC free article] [PubMed] [Google Scholar]
- Laird AR, Robbins JM, Li K, Price LR, Cykowski MD, Narayana S, Laird RW, Franklin C, Fox PT. Modeling motor connectivity using TMS/PET and structural equation modeling. Neuroimage. 2008;41:424–436. doi: 10.1016/j.neuroimage.2008.01.065. [DOI] [PMC free article] [PubMed] [Google Scholar]
- Lancaster JL, Fox PT, Downs H, Nickerson DS, Hander TA, El Mallah M, Kochunov PV, Zamarripa F. Global spatial normalization of human brain using convex hulls. J Nucl Med. 1999;40:942–955. [PubMed] [Google Scholar]
- McIntosh AR, Grady CL, Ungerleider LG, Haxby JV, Rapoport SI, Horwitz B. Network analysis of cortical visual pathways mapped with PET. J Neurosci. 1994;14:655–666. doi: 10.1523/JNEUROSCI.14-02-00655.1994. [DOI] [PMC free article] [PubMed] [Google Scholar]
- Meguerditchian A, Vauclair J. Baboons communicate with their right hand. Behav Brain Res. 2006;171:170–174. doi: 10.1016/j.bbr.2006.03.018. [DOI] [PubMed] [Google Scholar]
- Mentis MJ, Alexander GE, Grady CL, Horowitz B, Krasuski J, Pietrini P, Strassburger T, Hample H, Schapiro MB, Rapoport SI. Frequency variation of a pattern-flash visual stimulus during PET differentially activates brain from striate through frontal cortex. Neuroimage. 1997;5:116–128. doi: 10.1006/nimg.1997.0256. [DOI] [PubMed] [Google Scholar]
- Mintun MA, Fox PT, Raichle ME. A highly accurate method of localizing regions of neuronal activation in the human brain with positron emission tomography. J Cereb Blood Flow Metab. 1989;9:96–103. doi: 10.1038/jcbfm.1989.13. [DOI] [PubMed] [Google Scholar]
- Moeller F, Siebner HR, Ahlgrimm N, Wolff S, Muhle H, Granert O, Boor R, Gotman J, Stephani U, Siniatchkin M. fMRI activation during spike and wave discharges evoked by photic stimulation. Neuroimage. 2009;48:682–695. doi: 10.1016/j.neuroimage.2009.07.019. [DOI] [PubMed] [Google Scholar]
- Naquet R, Catier J, Menini C. Neurophysiology of photically induced epilepsy in Papio papio. Adv Neurol. 1975;10:107–118. [PubMed] [Google Scholar]
- Parra J, Kalitzin SN, Iriarte J, Blanes W, Velis DN, Lopes da Silva FH. Gamma-band phase clustering and photosensitivity: Is there an underlying mechanism common to photosensitive epilepsy and visual perception? Brain. 2003;126:1164–1172. doi: 10.1093/brain/awg109. [DOI] [PubMed] [Google Scholar]
- Peltier S, Stilla R, Mariola E, LaConte S, Hu XP, Sathian K. Activity and effective connectivity of parietal and occipital cortical regions during haptic shape perception. Neuropsychologia. 2007;45:476–483. doi: 10.1016/j.neuropsychologia.2006.03.003. [DOI] [PubMed] [Google Scholar]
- Price LR, Laird AR, Fox PT, Ingham RJ. Modeling dynamic functional neuroimaging data using structural equation modeling. Structural Equation Modeling. 2009;16:147–162. doi: 10.1080/10705510802561402. [DOI] [PMC free article] [PubMed] [Google Scholar]
- Schumacker RE, Lomax RG. A Beginner's Guide to Structural Equation Modeling. Second. Lawrence Erlbaum Associates; Mahwah, NJ: 2004. [Google Scholar]
- Silva-Barrat C, Ménini C, Bryére P, Naquet R. Multiunitary activity analysis of cortical and subcortical structures in paroxysmal discharges and grand mal seizures in photosensitive baboons. Electroencephalogr Clin Neurophysiol. 1986;64:455–468. doi: 10.1016/0013-4694(86)90079-9. [DOI] [PubMed] [Google Scholar]
- Strigaro G, Prandi P, Varrasi C, Magistrelli L, Falletta L, Cantello R. Intermittent photic stimulation affects motor cortex excitability in photosensitive idiopathic generalized epilepsy. Epilepsy Res. 2013;104:78–93. doi: 10.1016/j.eplepsyres.2012.08.009. [DOI] [PubMed] [Google Scholar]
- Szabó CÁ, Leland MM, Knape KD, Elliott JJ, Haines VL, Williams JT. Clinical and EEG phenotypes of epilepsy in the baboon (Papio hamadryas spp) Epilepsy 2005. 2005;65:71–80. doi: 10.1016/j.eplepsyres.2005.05.003. [DOI] [PubMed] [Google Scholar]
- Szabó CÁ, Narayana S, Kochunov PV, Franklin C, Knape KD, Davis MD, Fox PT, Leland MM, Williams JT. PET imaging in the photosensitive baboon: case-controlled study. Epilepsia. 2007;48:245–253. doi: 10.1111/j.1528-1167.2006.00949.x. [DOI] [PubMed] [Google Scholar]
- Szabó CÁ, Narayana F, Franklin C, Knape KD, Davis MD, Fox PT, Leland MM, Williams JT. Resting” CBF in the epileptic baboon: correlation with ketamine dose and interictal epileptic discharges. Epilepsy Res. 2008;82:57–63. doi: 10.1016/j.eplepsyres.2008.07.015. [DOI] [PMC free article] [PubMed] [Google Scholar]
- Szabó CÁ, Salinas FS, Narayana S. Functional PET evaluation of the photosensitive baboon. In: Duong TQ (Ed) Neuroimaging of Non-Human Primates. ONIJ. 2011;5(Suppl 2-M9):206–215. doi: 10.2174/1874440001105010206. [DOI] [PMC free article] [PubMed] [Google Scholar]
- Szabó CÁ, Knape KD, Leland MM, Williams JT. Electroclinical Phenotypes in a pedigreed baboon colony. Epilepsy Res. 2013;105:77–85. doi: 10.1016/j.eplepsyres.2013.02.012. [DOI] [PMC free article] [PubMed] [Google Scholar]
- Varotto G, Visani E, Canafoglia L, Franceschetti S, Avanzini G, Panzica F. Enhanced frontocentral EEG connectivity in photosensitive generalized epilepsies: a partial directed coherence study. Epilepsia. 2012;53:359–367. doi: 10.1111/j.1528-1167.2011.03352.x. [DOI] [PubMed] [Google Scholar]
- Young NA, Szabó CÁ, Phelix CE, Fleherty DK, Foust-Yeoman KB, Collins E, Kaas JH. Epileptic baboons have lower numbers of neurons in specific areas of cortex. PNAS. 2013;110:19107–19112. doi: 10.1073/pnas.1318894110. [DOI] [PMC free article] [PubMed] [Google Scholar]
- Zhuang JC, LaConte S, Peltier S, Zhang K, Hu XP. Connectivity exploration with structural equation modeling: an fMRI study of bimanual motor coordination. NeuroImage. 2005;25:462–470. doi: 10.1016/j.neuroimage.2004.11.007. [DOI] [PubMed] [Google Scholar]