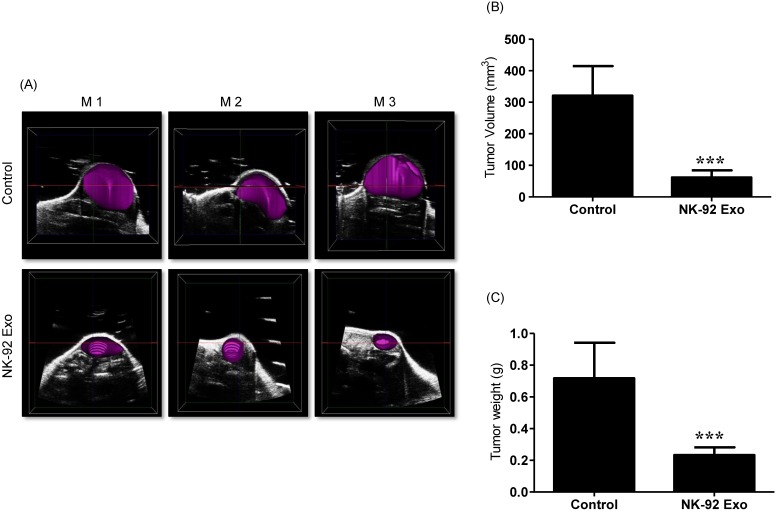
Fig 10.
Ultrasound imaging of tumors in vivo. After collecting the B model imaging of (A), the tumor was imaged by ultrasonography. (B) Tumor volumes were measured by 3-D imaging obtained using software. (C) Tumor masses (g) were measured after mice were sacrificed. Values are expressed as the mean ± SD, ***p < 0.001.

