Abstract
Chimeric antigen receptors (CARs) are synthetic receptors that redirect and reprogram T cells to mediate tumour rejection1. The most successful CARs used to date are those targeting CD19 (ref. 2), which offer the prospect of complete remission in patients with chemorefractory or relapsed B-cell malignancies3. CARs are typically transduced into the T cells of a patient using γ-retroviral4 vectors or other randomly integrating vectors5, which may result in clonal expansion, oncogenic transformation, variegated transgene expression and transcriptional silencing6–8. Recent advances in genome editing enable efficient sequence-specific interventions in human cells9,10, including targeted gene delivery to the CCR5 and AAVS1 loci11,12. Here we show that directing a CD19-specific CAR to the T-cell receptor α constant (TRAC) locus not only results in uniform CAR expression in human peripheral blood T cells, but also enhances T-cell potency, with edited cells vastly outperforming conventionally generated CAR T cells in a mouse model of acute lymphoblastic leukaemia. We further demonstrate that targeting the CAR to the TRAC locus averts tonic CAR signalling and establishes effective internalization and re-expression of the CAR following single or repeated exposure to antigen, delaying effector T-cell differentiation and exhaustion. These findings uncover facets of CAR immunobiology and underscore the potential of CRISPR/Cas9 genome editing to advance immunotherapies.
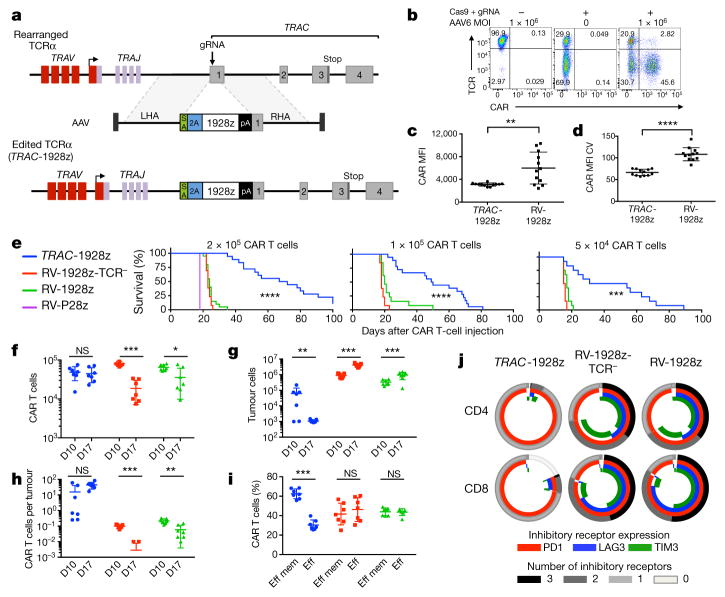
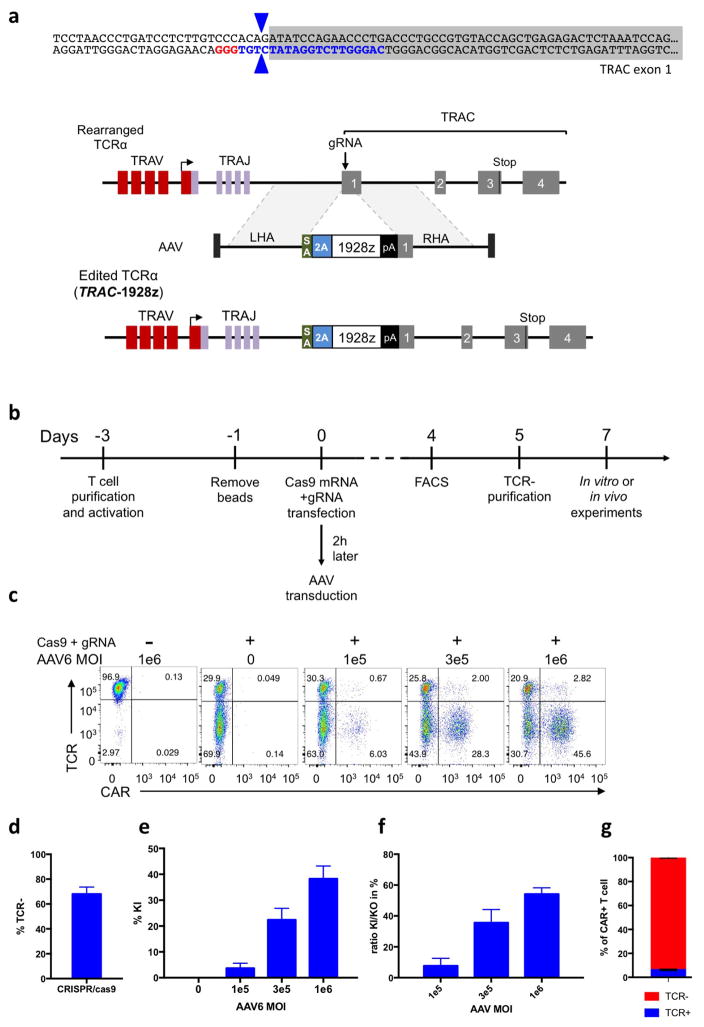
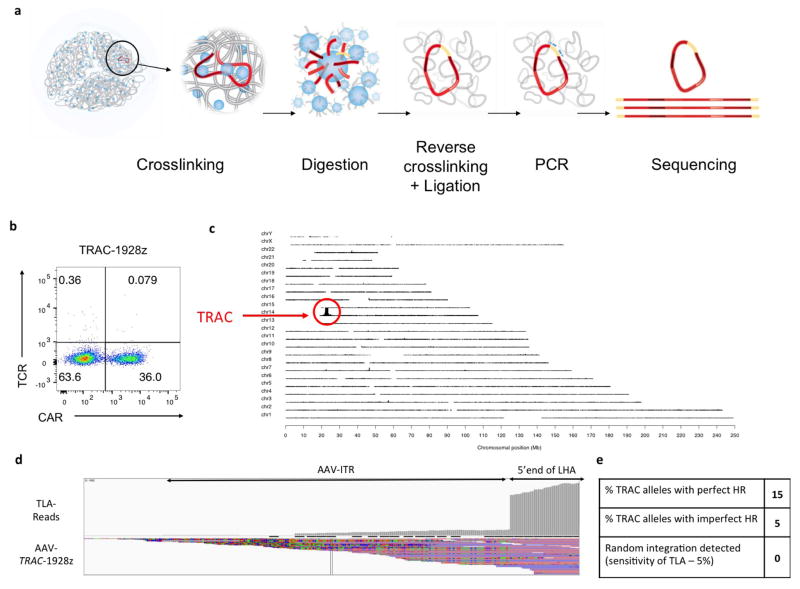
To disrupt the TRAC locus and place the CD19-specific 1928z CAR13 under its transcriptional control (TRAC-CAR), we designed a guide RNA (gRNA) targeting the 5′ end of the first exon of TRAC and an adeno-associated virus (AAV) vector repair matrix encoding a self-cleaving P2A peptide followed by the CAR cDNA (Fig. 1a, Extended Data Fig. 1a). T-cell electroporation of Cas9 mRNA and gRNA yielded a high knockout frequency (~70%; Fig. 1b, Extended Data Fig. 1d) with limited cell death. The knock-in was proportional to AAV dosage, exceeding 40% at a multiplicity of infection of 106 (Fig. 1b, Extended Data Fig. 1c, e). This efficient targeting, reported here for the first time at the TRAC locus, is comparable to levels reached in T cells at the AAVS1, CCR5 or CD40L loci12,14,15. Approximately 95% of CAR+ cells were T-cell receptor (TCR)-negative (Extended Data Fig. 1g), validating the 2-in-1 TCR-knockout and CAR-knock-in strategy. The observed 5% of CAR+TCR+ cells is consistent with the typical frequency of dual-TCRα-expressing T cells16. The targeting specificity was confirmed by mapping AAV vector integration over the whole genome17, which confirmed the high selectivity for TRAC integration and absence of off-target hotspots (Extended Data Fig. 2). These results demonstrate the high efficiency and precision of gene targeting offered by CRISPR/Cas9 and our ability to reproducibly generate up to 50 × 106 TRAC-CAR T cells. We found homogenous and consistent expression of TRAC-CAR in multiple donors, in contrast to retrovirally encoded CAR (RV-CAR), which showed variegated expression with a twofold higher mean expression (Fig. 1c, d).
Figure 1. TRAC-CAR T cells outperform conventional CAR T cells by preventing exhaustion in vivo.
a, CRISPR/Cas9-targeted CAR gene integration into the TRAC locus. Top, TRAC locus; middle, rAAV6 containing the CAR cassette flanked by homology arms; bottom, edited TRAC locus. b, Representative TCR/CAR flow plots 4 days after TRAC targeting. c, d, CAR mean fluorescence intensity (MFI) (c) and CAR MFI coefficient of variance (d) of CAR+ T cells (n = 12 independent experiments, 6 donors). e, Kaplan–Meier analysis of survival of mice. f–j, NALM-6-bearing mice were treated with 1 × 10⁵ CAR T cells (n = 7 per group; dot = one mouse), and euthanized at days 10 and 17 after infusion; bone marrow CAR T cells and NALM-6 cells were analysed and counted by FACS (colours as in e). f, CAR T cells. g, Tumour (GFP+CD19+) cells. h, CAR T cells to tumour ratio. i, Percentage of effector memory (CD62L−CD45RA−) and effector (CD62L−CD45RA+) in CAR T cells at day 17. j, Percentage of CAR T cells expressing exhaustion markers; quantified by FACS at day 17. *P <0.05, **P <0.01, ***P <0.001, ****P < 0.0001 (Welch’s two samples t-test (c, d); log-rank Mantel–Cox test (e); Mann–Whitney (f–i)). All data are means ± s.d. See also Extended Data Figs 1–4.
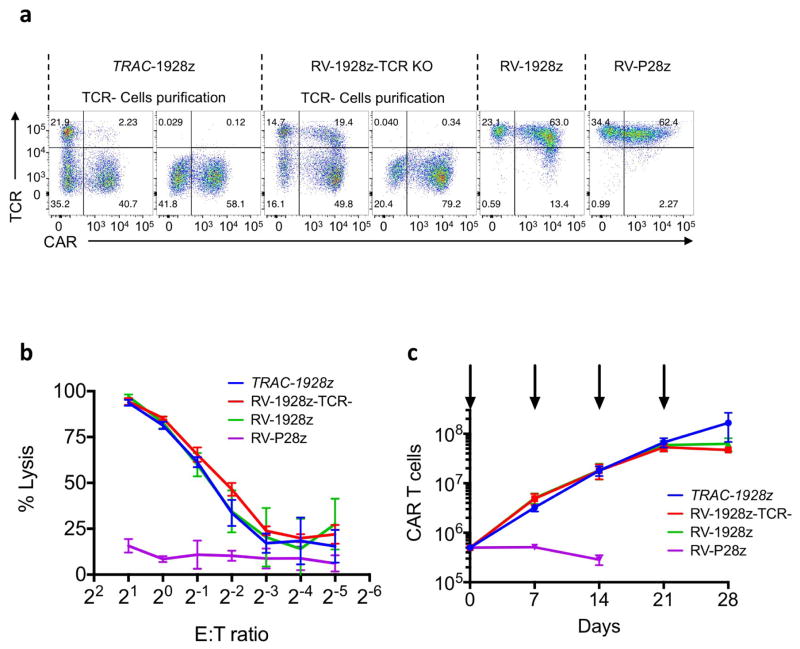
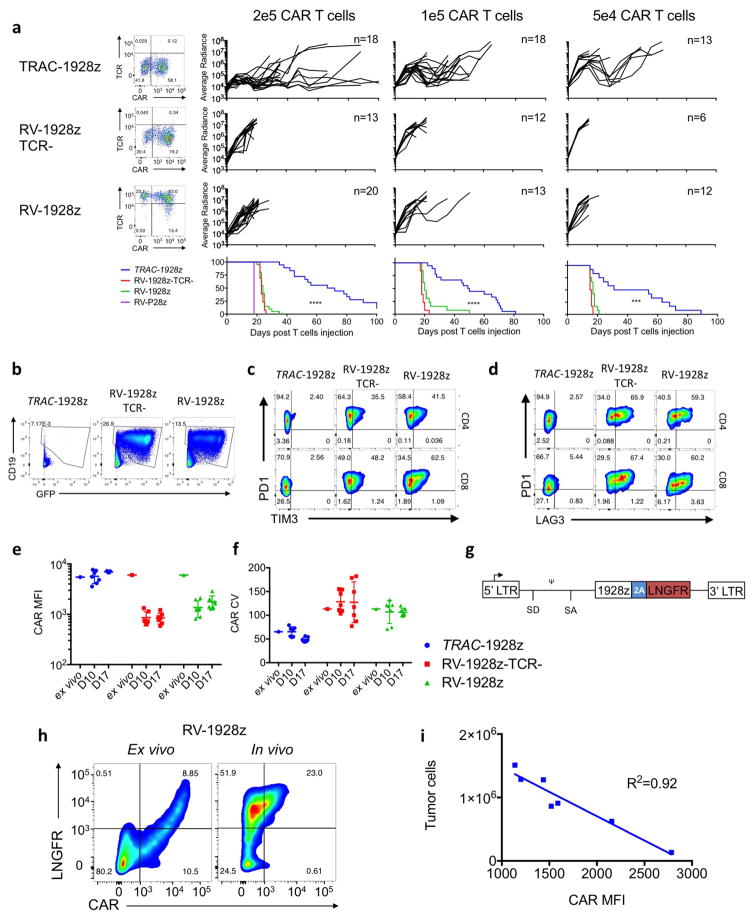
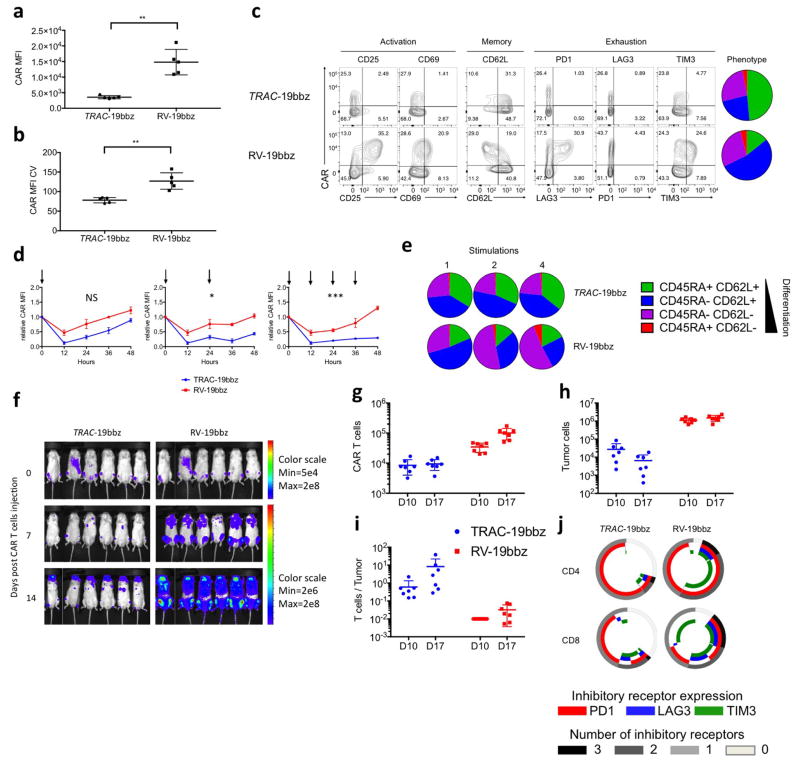
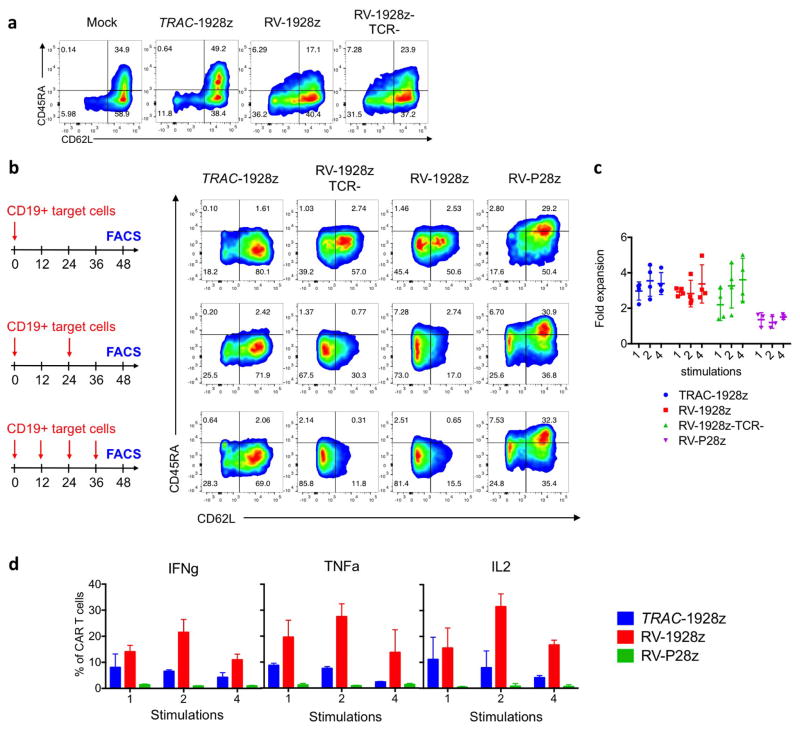
In vitro functional studies did not reveal any notable differences between TRAC-encoded and randomly integrated 1928z, in terms of both cytotoxicity and T-cell proliferation in response to weekly stimulation with CD19+ antigen-presenting cells2 (Extended Data Fig. 3b, c). These experiments included a control group in which TCR-disrupted T cells expressing retrovirally transduced CAR (RV-CAR-TCR−) responded similarly to RV-CAR TCR+ T cells (Extended Data Fig. 3a). In vivo, however, in the pre-B acute lymphoblastic leukaemia NALM-6 mouse model using the ‘CAR stress test’, in which CAR T-cell dosage is gradually lowered to reveal the functional limits of different T-cell populations2,18, TRAC-CAR, RV-CAR and RV-CAR-TCR− T cells differed markedly in their anti-tumour activity. TRAC-CAR T cells induced greater responses and prolonged median survival at every T-cell dose (Fig. 1e, Extended Data Fig. 4a). TCR disruption had no discernable effect on the potency of RV-CAR T cells. Bone marrow studies in mice injected with 1 × 10⁵ CAR T cells showed similar T-cell accumulation at the tumour site after 10 days (Fig. 1f). However, only the TRAC-CAR T cells achieved tumour control (Fig. 1g, h). By day 17, TRAC-CAR T cells exceeded RV-CAR T cells in number, as the latter diminished relative to day 10, despite the continued presence of CD19+ tumour cells (Fig. 1f–g, Extended Data Fig. 4b). Furthermore, the CAR T-cell groups differed in the degree of T-cell differentiation and exhaustion, as reflected in the proportion of terminal effector cells (CD45RA+CD62L−) and accumulation of co-expressed PD1, LAG3 and TIM3 (ref. 19), respectively. Thus, conventional CAR T cells showed up to 50% positive expression of three markers of exhaustion by day 17, in contrast to less than 2% of the TRAC-CAR T cells, which also retained a larger effector memory composition (Fig. 1i, j, Extended Data Fig. 4c, d). Terminal differentiation and acquisition of this exhaustion phenotype is consistent with diminished anti-tumour activity20. Interestingly, CAR expression in bone marrow T cells was similar to pre-infusion levels for TRAC-CAR T cells but diminished in both RV-CAR groups (Extended Data Fig. 4e). Importantly, cell-surface expression of the mutant LNGFR reporter21 (co-expressed through a self-cleaving 2A element) was undiminished, ruling out vector silencing as the explanation for diminished CAR expression (Extended Data Fig. 4g, h). The CAR expression level measured in RV-CAR T cells negatively correlated with tumour burden (Extended Data Fig. 4i), suggesting that cell-surface CAR was downregulated in proportion to tumour antigen. These in vivo findings thus not only demonstrated the superior anti-tumour activity of TRAC-CAR T cells, but also forged a link between tumour control, T-cell differentiation and exhaustion, and CAR expression levels. These same patterns were observed with another CAR, 19BBz, which utilizes the 4-1BB cytoplasmic domain as its costimulatory moiety (Extended Data Fig. 5).
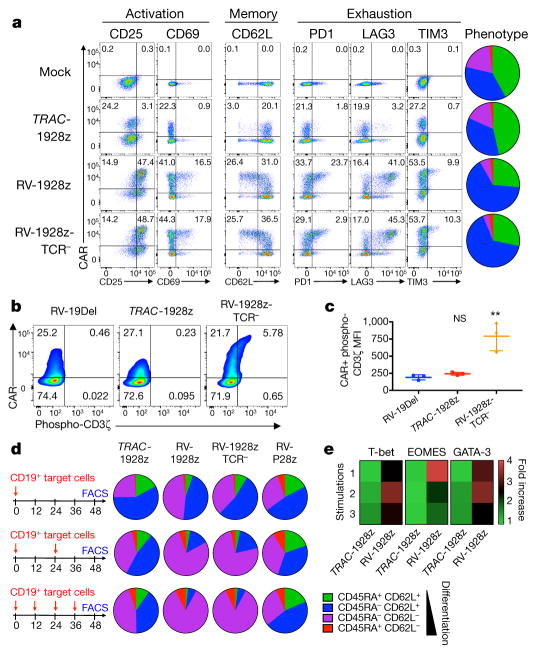
To further analyse the effect of CAR expression levels on T-cell function, we first examined T-cell phenotype when cultured in the absence or presence of antigen (Fig. 2). Five days after transduction, RV-CAR T cells already showed evidence of activation, exhaustion and differentiation (Fig. 2a, Extended Data Fig. 6a), similar to results obtained with a previously described retrovirally delivered CAR22. By contrast, TRAC-CAR T cells maintained a phenotype analogous to untransduced T cells (Fig. 2a), mainly composed of naive and central memory cells (CD62L+ cells), a phenotype associated with greater in vivo anti-tumour activity20,23. Consistent with constitutive activating signalling, we found that RV-CARs, but not TRAC-CARs, had phosphorylated immune-based tyrosine activation motifs22 (Fig. 2b, c). Further differences were noted upon exposure to antigen. In contrast to TRAC-CAR T cells, RV-CAR T cells stimulated 1, 2 or 4 times in a 48 h period differentiate into effector T cells, identified on the basis of phenotype (loss of CD62L), cytokine secretion (increased IFNγ, IL2 and TNFα) and expression of master transcription factors (increased T-bet, EOMES and GATA3) (Fig. 2d, e, Extended Data Fig. 6b–d). These results indicated that the improved efficacy of TRAC-CAR T cells is related to its CAR expression level by reducing tonic signalling and delaying T-cell differentiation upon stimulation.
Figure 2. TRAC-CAR T cells display reduced constitutive signalling and antigen-induced differentiation.
a, FACS analysis of activation, memory and exhaustion markers in T cells (day 5 after infusion; representative of 3 donors; pie chart for CD62L/D45RA expression (n = 3, 3 donors, colours as in d). b, CAR expression and CD3ζ ITAM phosphorylation (representative of 3 donors). RV-19Del, retrovirally expressed CD19-specific CAR lacking signalling domains. c, Phospho-CD3ζ MFI in the CAR+ population (n = 3, 3 donors; **P <0.05 Mann–Whitney test). d, CD62L/CD45RA expression in CAR T cells stimulated 1, 2 or 4 times. Pie charts show the phenotypes of the CAR+ T cells (n =3–5 on different donors). e, Heat map of T-bet, EOMES and GATA3 expression in CAR T cells collected as in d; fold-increase value of 1 represents to TRAC-1928z, 1 stimulation (n = 2, 2 donors). All data are means ± s.d. See also Extended Data Fig. 6.
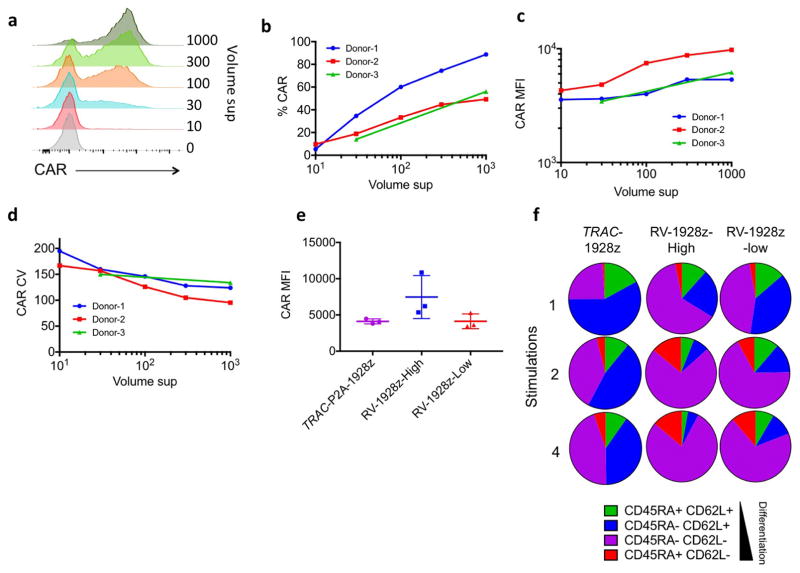
To control CAR expression, we first attempted to vary the retroviral vector copy number. Lowered gene transfer efficiency only modestly affected the CAR expression level (Extended Data Fig. 7). Interestingly, even when mean RV-CAR expression matched that of TRAC-CAR, the former still displayed accelerated differentiation upon multiple stimulations, suggesting that dynamic regulation of CAR expression, and not just baseline expression, promotes distinct functional characteristics.
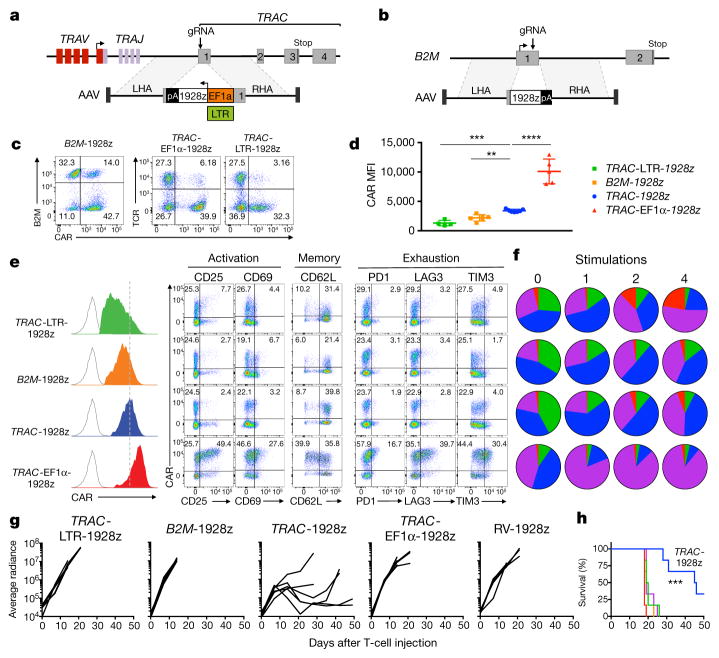
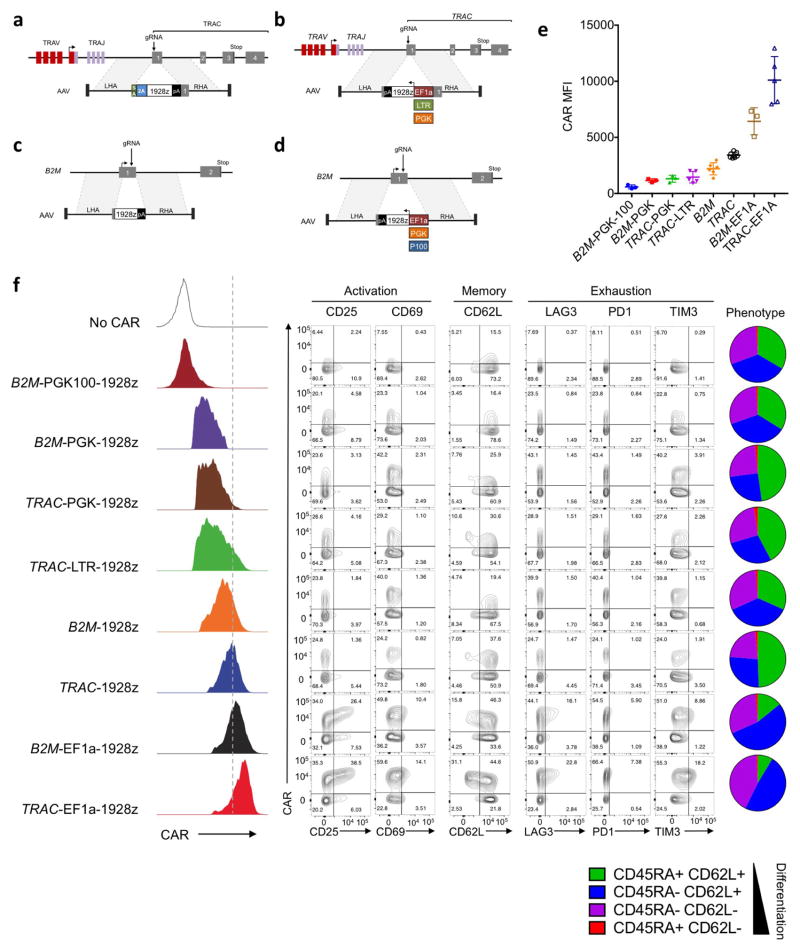
To further define the importance of CAR expression levels, we generated T cells that expressed CAR from different genomic loci and promoters. To examine the specific contribution of the TRAC locus and its promoter, we designed a further seven constructs targeting the 1928z CAR to the TRAC or the β2-microglobulin (B2M) locus (MHC-I-related gene known to be expressed in all T cells), using either endogenous or exogenous promoters (Fig. 3a, b, Extended Data Fig. 8a–e). We successfully engineered CAR T cells at both loci, achieving homogenous CAR expression with mean levels ranging from seven times lower (B2M-PGK100) to more than double (TRAC-EF1α) that of TRAC-CAR endogenous promoter (Fig. 3c–e, Extended Data Fig. 8).
Figure 3. The endogenous TRAC promoter surpasses other locus/promoter combinations in vivo.
a, CRISPR/Cas9-targeted promoter-CAR integration into the TRAC locus. Top, TRAC locus; bottom, rAAV6 containing the promoter-CAR-polyA cassette flanked by homology arms. b, CRISPR/Cas9-targeted promoter-less CAR integration into the B2M locus. Top, B2M locus; bottom, rAAV6 containing a promoter-less CAR cassette flanked by homology arms. c, Representative B2M/CAR or TCR/CAR flow plots 4 days after gene transfer. d, CAR MFI at day 4 (n = 4–7 independent experiments; 4 donors). e, Left, CAR expression (representative histogram) at day 4. Right, FACS analysis of activation, memory, and exhaustion markers of CAR T cells at day 5 (representative of 3 donors). f, CAR T cells stimulated on CD19+ target cells 0, 1, 2 or 4 times. Pie charts show the CD62L/CD45RA phenotypes of CAR+ T cells (n = 3–5 independent experiments on different donors, colours as in Fig. 2d). g, Tumour burden (average radiance) of NALM-6-bearing mice treated with 1 × 10⁵ CAR T cells (n =6; line =one mouse).
h, Kaplan–Meier analysis of the mice survival, **P <0.01, ***P <0.001, ****P < 0.0001 (Welch’s two samples t-test (d); log-rank Mantel–Cox test (g) and Mann–Whitney test (h–k). All data are means ± s.d. See also Extended Data Figs 8, 9.
All of the combinations that conferred higher CAR expression than TRAC-CAR displayed the tonic signalling signature, in contrast to those providing lower expression, consistent with a previous study linking expression level to antigen-independent signalling24 (Fig. 3e, Extended Data Fig. 8f). We selected three of these for in-depth analysis: high-expressing TRAC-EF1α and low-expressing B2M-CAR and TRAC-LTR (RV enhancer–promoter), comparing their in vitro and in vivo potency against TRAC-CAR. In vitro, following repeated antigenic stimulations, TRAC-EF1α CAR T cells rapidly acquired effector profiles, whereas B2M-CAR and TRAC-CAR T cells retained a central memory phenotype (Fig. 3f, Extended Data Fig. 9a). Interestingly, although TRAC-LTR directed lower baseline CAR expression than RV-CAR and averted the tonic signalling, the LTR still promoted from within the TRAC locus the same differentiation pattern as RV-CAR. In the NALM-6 stress test model, none of the three locus–promoter combinations displayed the same anti-tumour efficacy as TRAC-CAR (Fig. 3g, h). 10 and 17 days after infusion of 1 × 10⁵ CAR T cells, the number of CAR T cells that accumulated in bone marrow was similar or higher than for TRAC-CAR T cells; however, only TRAC-CAR T cells could efficiently control tumour progression (Extended Data Fig. 9c–e). Although B2M-CAR T cells seemed to preserve an effector/effector-memory ratio similar to TRAC-CAR T cells, they too acquired a preponderant exhaustion signature (Extended Data Fig. 9f, g), suggesting that delayed differentiation may be independent from exhaustion. Together these results underscored the effect of CAR targeting and further suggested regulation of CAR expression extending beyond baseline transcriptional control.
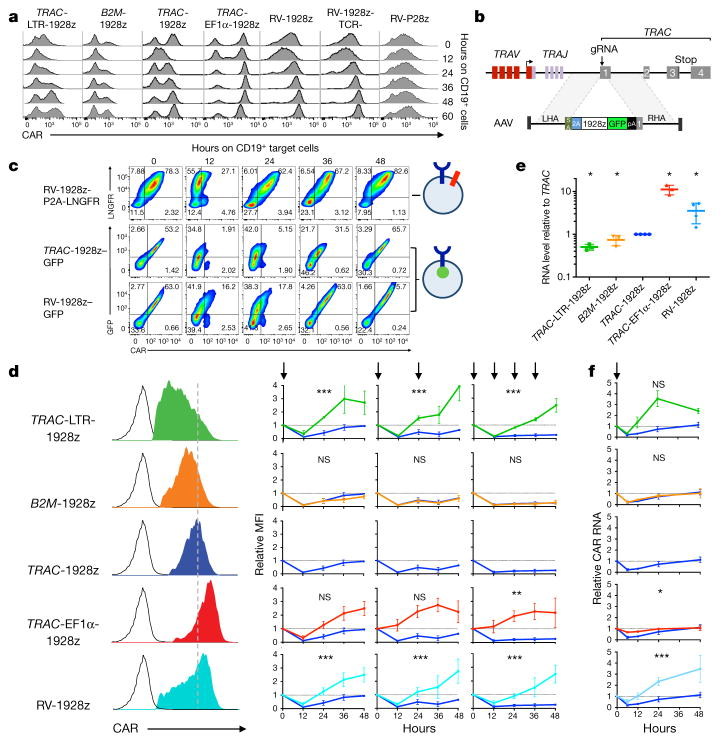
We therefore closely analysed CAR expression upon encounter with antigen. To this end, CAR T cells were admixed with CD19+ antigen-presenting cells and cell-surface CAR expression was examined at regular time intervals (Fig. 4a). CAR expression decreased within hours of exposure to CD19 in both targeted and randomly integrated CAR T cells, accompanied by a deeper drop and longer recovery lag when the initial level was lower. The subsequent return to baseline expression most notably distinguished the different T-cell populations.
Figure 4. TRAC locus affords optimal regulation of cell-surface CAR expression.
a, Representative histogram of CAR expression before and after co-culture with CD19+ target cells. b, CRISPR/Cas9-targeted integration of a CAR-GFP fusion gene into TRAC locus. c, Upper, LNGFR/CAR expression of the bicistronic CAR-P2A-LNGFR CAR T cells before and after co-culture with CD19+ target cells. Lower, GFP/CAR expression of CAR–GFP fusion targeted into the TRAC locus or randomly integrated with the RV vector (representative of 3 independent experiments on 3 donors). d, Left, representative histogram of the CAR expression 5 days after gene transfer. Right, relative CAR MFI (1 = MFI at 0 h) of CAR T cells after 1, 2 or 4 stimulations (indicated by arrows; n =3–7 independent experiments on different donors). e, Relative CAR RNA levels (1 =TRAC RNA level) 5 days after gene transfer. f, Time-course analysis of CAR RNA levels (1 = RNA level at 0 h) in CAR T cells stimulated once on CD19+ target cells (n = 3 independent experiments on 3 donors; CAR T cells as in d). All data are means ±s.d. *P <0.05, **P <0.01, ***P <0.001 (ANOVA F-test with Bonferroni correction (d; see Supplementary Information), and Mann–Whitney test (e)). See also Extended Data Fig. 10.
To better study the mechanism behind the drop in CAR cell-surface expression, we designed a CAR–GFP fusion protein to analyse both cell-surface and intra-cellular CAR expression, and compare it to cells expressing a CAR with a co-translated but cleaved LNGFR reporter (Fig. 4b, c). We observed that CAR expression was downregulated independently of LNGFR, suggesting physical internalization rather than a transcriptional process. The co-reduction of CAR and GFP signal following antigen encounter indicated that CAR internalization was followed by its degradation. The occurrence of CAR degradation following exposure to antigen suggested that de novo CAR synthesis from CAR mRNA would be needed to precisely and timely restore CAR expression and support effective T-cell function. Careful analysis of CAR cell-surface expression following repeated antigen stimulation (Fig. 4d, Extended Data Fig. 10a) identified two main patterns in the recovery phase (12–48 h hours after antigen exposure). In TRAC-EF1α, TRAC-LTR and RV-CAR T cells, CAR cell-surface expression increased after each stimulation, two- to fourfold above baseline within 24 h. In both TRAC- and B2M-CAR T cells, CAR expression decreased upon repeated stimulations and remained below baseline after 48 h (Fig. 4d). Steady-state mRNA analysis showed a linear correlation between cell-surface protein level (Fig. 4e, Extended Data Fig. 10b) and the transcriptional response to CAR T-cell activation (Fig. 4f), pointing to the essential role of promoter strength and regulation to enable optimal post-stimulation replenishment of cell-surface CAR expression.
This CAR protein/RNA downregulation and subsequent re-expression is reminiscent of TCR regulation upon stimulation of human T cells25 and antigen-induced TCR recirculation in mouse T cells26–28. Similarly, accelerated differentiation and exhaustion have been reported in the context of excessive and continuous activation of the TCR29,30. Altogether, these converging findings support the conclusion that TRAC has a role in control of CAR expression in two critical ways. One is to promote optimal baseline expression, which prevented tonic signalling in the absence of antigen and allowed effective CAR internalization upon single or multiple contacts with antigen. The other is to direct a balanced transcriptional response resulting in a kinetically optimal recovery of baseline CAR expression after antigen engagement. In contrast to T cells with higher CAR expression, the TRAC-CAR profile correlated with decreased T-cell differentiation and exhaustion, resulting in superior tumour eradication. Our studies, which compared randomly integrating CARs versus CARs targeted to two loci in eight different transcriptional configurations, illustrate the exquisite sensitivity of CAR regulation. Thus, although the endogenous B2M promoter responded similarly to TRAC upon CAR stimulation, B2M-CAR did not perform as well as TRAC-CAR in vivo, indicating that the lower basal expression level it offered is insufficient for effective CAR activity. TRAC-LTR provided baseline expression comparable to TRAC, but its prompt rebound after activation was associated with poor T-cell performance and accelerated differentiation. We therefore conclude that both the basal and dynamic CAR expression levels contribute to sustaining T-cell function.
In summary, we demonstrate that targeting a CAR coding sequence to the TCR locus, placing it under the control of endogenous regulatory elements, reduces tonic signalling, averts accelerated T-cell differentiation and exhaustion, and increases the therapeutic potency of engineered T cells. Our kinetic measurements of antigen-induced CAR internalization and degradation revealed differential recovery of cell-surface CAR depending on the enhancer/promoter elements driving CAR expression. These findings demonstrate that tight transcriptional regulation of CAR expression is critical for effective tumour eradication. The targeting of CARs to a TCR locus may thus provide a safer therapeutic T cell (by minimizing the risks of insertional oncogenesis and TCR-induced autoimmunity and alloreactivity), a better defined T-cell product (by yielding constant CAR expression and avoiding position-effect variegation and vector copy number variation) and a more potent T cell (by reducing constitutive signalling and delaying T-cell exhaustion). Finally, our results demonstrate the relevance of studying CAR immunobiology and the vast potential of genome editing to advance T-cell therapies.
METHODS
Data reporting
The experiments were not randomized and the investigators were not blinded to allocation during experiments and outcome assessment.
Guide RNA
We designed a gRNA to target the first exon of the constant chain of the TCRα gene (TRAC). The sequence targeted is located upstream of the transmembrane domain of the TCRα. This domain is required for the TCRα and β assembly and addressing to the cell-surface. Both, non-homologous end joining (NHEJ) and integration of the CAR by HDR at this locus would then efficiently disrupt the TCR complex.
For the B2M, we designed both a gRNA and a TALEN (transcription activator-like effector nucleases) targeting the first exon of B2M gene and obtained a higher cutting efficiency with the TALEN. We used the same protocol and obtained similar cytotoxicity and specificity of both methods and the CAR T cells obtained were not discernable in term of activity and proliferation (data not shown). For manufacturing reasons we mainly used the B2M TALEN in this study.
TRAC gRNA sequence
5′-C*A*G*GGUUCUGGAUAUCUGUGUUUUAGAGC UAGAAAUAGCAAGUUAAAAUAAGGCUAGUCCGUUAUCAACUUGAAAA AGUGGCACCGAGUCGGUGCU*U*U*U-3′
B2M gRNA sequence
5′-G*G*C*CACGGAGCGAGACAUCUUUUUAGAGC UAGAAAUAGCAAGUUAAAAUAAGGCUAGUCCGUUAUCAACUUGAAAA AGUGGCACCGAGUCGGUGCU*U*U*U-3′. Asterisk (*) represents 2′-O-methyl 3′ phosphorothioate.
B2M-TALEN-targeting sequence
5′-TTAGCTGTGCTCGCGC(TACTC TCTCTTTCTG)GCCTGGAGGCTATCCA-3′. Left TAL effector (spacer) right TAL effector.
Messenger RNA
Modified guide RNAs (gRNAs) and Cas9 mRNA were synthesized by TriLink Biotechnologies. Guide RNAs were reconstituted at 1 μg μl−1 in cytoporation T Buffer (Harvard Apparatus).
AAV
Based on a pAAV-GFP backbone (Cell Biolabs) we designed and cloned the pAAV-TRAC-1928z containing 1.9 kb of genomic TRAC (amplified by PCR) flanking the gRNA targeting sequences, a self-cleaving P2A peptide in frame with the first exon of TRAC followed by the 1928z CAR used in clinical trials13. Briefly, the CAR comprises a single chain variable fragment 19scFV specific for the human CD19 preceded by a CD8a leader peptide and followed by CD28 hinge-transmembrane-intracellular regions and CD3ζ intracellular domain. The CAR cDNA is followed by the bovine growth hormone polyA signal (bGHpA). When targeting the B2M locus, a similar strategy was followed, except that no P2A sequence was required since the 1928z-pA sequence was placed in frame at the ATG of the B2M gene. When using exogenous promoters (EF1α, LTR, PGK or PGK100), the promoter-1928z-pA cassette was placed in reverse orientation at the same TRAC or B2M entry points.
Cells
Buffy coats from healthy volunteer donors were obtained from the New York Blood Center. Peripheral blood mononuclear cells were isolated by density gradient centrifugation, and T lymphocytes were then purified using the Pan T cell isolation kit (Miltenyi Biotech). Cells were activated with Dynabeads (1:1 beads:cell) Human T-Activator CD3/CD28 (ThermoFisher) in X-vivo 15 medium (Lonza) supplemented with 5% human serum (Gemini Bioproducts) with 200 U ml−1 IL-2 (Miltenyi Biotech) at a density of 106 cells per ml. The medium was changed every 2 days, and cells were replated at 106 cells per ml.
Gene targeting
48 h after initiating T-cell activation, the CD3/CD28 beads were magnetically removed, and the T cells were transfected by electrotransfer of Cas9 mRNA and gRNA using an AgilePulse MAX system (Harvard Apparatus). 3 × 10⁶ cells were mixed with 5 μg of Cas9 and 5 μg of gRNA into a 0.2 cm cuvette. Following electroporation cells were diluted into culture medium and incubated at 37 °C, 5% CO2. Recombinant AAV6 donor vector (manufactured by SignaGen) was added to the culture 2 to 4 h after electroporation, at the indicated multiplicity of infection (1 × 10⁵ to 1 × 10⁶ range). Subsequently, edited cells were cultured using standard conditions (37 °C and expanded in T-cell growth medium, replenished as needed to maintain a density of ~1 × 10⁶ cells per ml every 2 to 3 days).
To obtain TCR-negative T cells, TCR-positive T cells were removed from the culture using magnetic biotin-anti-TCRαβ and anti-biotin microbeads and LS columns (Miltenyi Biotech). For whole-genome mapping of TRAC-1928z integration, TCR-negative cell fraction was analysed using the TLA technology17 (Cergentis B.V.). For details of targeting constructs and strategies, see Extended Data Figs 1, 8.
Retroviral vector constructs, retroviral production and transduction
Plasmids encoding the SFG γ-retroviral (RV) vector31 were prepared as previously described2,32. VSV-G pseudotyped retroviral supernatants derived from transduced gpg29 fibroblasts (H29) were used to construct stable retroviral-producing cell lines as previously described33. T cells were transduced by centrifugation on Retronectin (Takara)-coated plates.
Cell lines
NALM-6 and NIH/3T3 were obtained from ATCC and were regularly tested for mycoplasma contamination using the MycoAlert Mycoplasma Detection Kit (Lonza). NALM-6 cells were transduced to express firefly luciferase-GFP and NIH/3T3 cells transduced to express human CD19 (refs 2, 18).
Cytotoxicity assays
The cytotoxicity of T cells transduced with a CAR was determined by standard luciferase-based assay. In brief, NALM-6 expressing firefly luciferase-GFP served as target cells. The effector (E) and tumour target (T) cells were co-cultured in triplicates at the indicated E/T ratio using black-walled 96- well plates with 1 × 10⁵ target cells in a total volume of 100 μl per well in NALM-6 Medium. Target cells alone were plated at the same cell density to determine the maximal luciferase expression (relative light units; RLUmax). 18 h later, 100 μl luciferase substrate (Bright-Glo, Promega) was directly added to each well. Emitted light was detected in a luminescence plate reader or Xenogen IVIS Imaging System (Xenogen), and quantified using Living Image software (Xenogen). Lysis was determined as (1 − (RLUsample)/(RLUmax)) × 100.
Antigen stimulation and proliferation assays
NIH/3T3 expressing human CD19 were used as artificial antigen-presenting cells2. For weekly stimulations, 3 × 10⁵ irradiated CD19+ AAPCs were plated in 24-well plates 12 h before the addition of 5 × 10⁵ CAR T cells in X-vivo 15, human serum and 50 U IL-2 per ml. Every 2 days, cells were counted and media was added to reach a concentration of 1 × 10⁶ T cells per ml. For repeated proximal stimulations (Fig. 4d), cells were transferred to a new well plated with 3T3-CD19 after 24 h (2 stimulations) or every 12 h (4 stimulations). For each condition, T cells were counted and analysed by FACS for CAR, phenotypic and exhaustion markers expression every 12 h.
Antibodies and intracellular staining
CAR was labelled with a goat anti-mouse Fab (Jackson ImmunoResearch, 115-606-003). For T cell phenotyping the following antibodies were used: mouse anti-human BUV-395CD4 (563552), APC-cy7-CD8 (557834), BV-421-CD62L (563862), BV-510-CD279 (PD1, 563076) from BD biosciences; mouse anti-human APC-CD25 (17-0259-42), FITC-CD45RA (11-0458-42), PerCP-eFluor710 CD223 (LAG-3, 46-2239-42) from eBiosciences and FITC mouse anti-human CD366 (TIM-3, 345032) from Biolegend. For intracellular staining, T cells were fixed and permeabilized using BD Cytofix/Cytoperm Plus kit as per the recommendation of the manufacturer. Anti-CD8-FITC (clone HIT8a, eBioscience) and anti-CD4-BUV-395 (clone SK3, BD Horizon) were used for extracellular staining. Anti-TNF-Alexa Fluor 700 (clone MAb11, BD pharmingen), anti-IL2-BV421 (clone 5344.111, BD Horizon) and anti-IFNγ-BV510 (clone B27, BD Horizon) are used for intracellular staining.
Mouse systemic tumour model
We used 8- to 12-week-old NOD/SCID/IL-2Rγ-null (NSG) male mice (Jackson Laboratory), under a protocol approved by the MSKCC Institutional Animal Care and Use Committee. Mice were inoculated with 0.5 × 10⁶ FFLuc-GFP NALM-6 cells by tail vein injection, followed by 2 × 10⁵, 1 × 10⁵ or 5 × 10⁴, CAR T cells injected four days later. NALM-6 produce very even tumour burdens and no mice were excluded before treatment. No randomization or blinding methods were used. Bioluminescence imaging used the Xenogen IVIS Imaging System (Xenogen) with Living Image software (Xenogen) for acquisition of imaging datasets. Tumour burden was assessed as previously described34.
RNA extraction and real-time quantitative PCR
Total RNA was extracted from T cells by using the RNeasy kit (QIAGEN) combined with QIAshredder (QIAGEN), following the manufacturer’s instructions. RNA concentration and quality were assessed by UV spectroscopy using the NanoDrop spectrophotometer (Themo Fisher Scientific). One hundred to 200 ng total RNA were used to prepare cDNA using the SuperScript III First-Strand Synthesis SuperMix (Invitrogen), with a 1:1 volume ratio of random hexamers and oligo dT. Completed cDNA synthesis reactions were treated with 2U RNase H for 20 min at 37 °C. Quantitative PCR was performed using the ABsolute Blue qPCR SYBR Green Low ROX Mix, and the following primer sets: Ribosomal 18S: forward 5′-AACCCGTTGAACCCCATT-3′, reverse 5′-CCATCCAATCGGTAGTAGCG-3′; 1928z: forward 5′-CGTGCAGTCTAAAGACTTGG-3′, reverse 5′-ATAGG GGACTTGGACAAAGG-3′; T-bet: forward 5′-GAAACCCAGTTCATTGCCGT-3′, reverse 5′-CCCCAAGGAATTGACAGTTG-3′; EOMES: forward 5′-ACT GGTTCCCACTGGATGAG-3′, reverse 5′-CCACGCCATCCTCTGTAACT-3′; GATA3: forward 5′-CACAACCACACTCTGGAGGA-3′, reverse 5′-GGTTTCT GGTCTGGATGCCT-3′. PCR assays were run on the QuantStudio(TM) 7 Flex System, and Ct values were obtained with the QuantStudio Real-Time PCR software. Relative changes in gene expression were analysed with the 2Δ ΔCt method. RNA expression levels were normalized to the percentage of CAR+ T cells for each group of T cells analysed.
Statistics
All experimental data are presented as mean ± s.e.m. No statistical methods were used to predetermine sample size. Groups were compared using the Welch’s two-sample t-test for parametric data (sample size, >10) or the Mann–Whitney Test for non-parametric data (sample size, <10). We used Welch’s correction, as the variances were not equal. For the comparison of CAR MFI and RNA level upon CAR stimulation, ANOVA F-tests have been used (see Supplementary Information for the statistical model). Statistical analysis was performed on GraphPad Prism 7 software.
Data availability
All relevant data are available from the authors. Representative FACS profiles have been added to appropriate Extended Data Figures, and the statistical model used for the ANOVA F-tests are in the Supplementary Information.
Extended Data
Extended Data Figure 1. CRISPR/Cas9-mediated CAR gene targeting into the TRAC locus.
a, Top, TRAC locus with the 5′ end (grey) of the TRAC first exon, the TRAC gRNA (blue) and the corresponding PAM sequence (red). The two blue arrows indicate the predicted Cas9 double strand break. Bottom, CRISPR/Cas9-targeted integration into the TRAC locus. The targeting construct (AAV) contains a splice acceptor (SA), followed by a P2A coding sequence, the 1928z CAR gene and a polyA sequence, flanked by sequences homologous to the TRAC locus (LHA and RHA, left and right homology arm). Once integrated, the endogenous TCRα promoter drives CAR expression, while the TRAC locus is disrupted. TRAV, TCRα variable region; TRAJ, TCRα joining region; 2A, the self-cleaving Porcine teschovirus 2A sequence. pA: bovine growth hormone polyA sequence. b, Timeline of the CAR targeting into primary T cells. c, Representative TCR/CAR flow plots 4 days after transfection of T cells with Cas9 mRNA and TRAC gRNA and addition of AAV6 at the indicated multiplicity of infection. d, Percentage of TCR disruption 4 days post transfection of the Cas9 mRNA and the TRAC gRNA measured by FACS analysis of the TCR expression (n =5). e, Percentage of knock-in depending on the AAV6 multiplicity of infection measured by FACS analysis of the CAR expression (n =4). f, Percentage of CAR+ cells in the TCR-negative population (n =4). g, Percentage of TCR-positive and TCR-negative in the CAR+ population analysed by FACS (n =4).
Extended Data Figure 2. Whole-genome mapping of the AAV6 TRAC-1928z integration using the TLA technology.
a, Schematic representation of the TLA technology17. For this study, two sets of primers targeting the CAR and the left homology arm have been used. b, TCR/CAR FACS plot of the TRAC-1928z CAR T cells used for the TLA analysis. CAR T cells have been processed as in Extended Data Fig. 1b and expanded for 2 weeks. c, TLA sequence coverage across the human genome using 1928z CAR specific primers (CD28-specific forward: 5′-ACAATGAGAAGAGCAATGGA-3′ and scFV-specific reverse: 5′-GAGATTGTCCTGGTTTCTGT-3′). The chromosomes are indicated on the y axis, the chromosomal position on the x axis. TRAC-encoded CAR T cells were produced as in Fig. 1 and expanded for 10 days before processed for analysis. The primer set was used in an individual TLA amplification. PCR products were purified and library prepped using the Illumina NexteraXT protocol and sequenced on an Illumina Miseq sequencer. Reads were mapped using BWA-SW, which is a Smith–Waterman alignment tool. This allows partial mapping, which is optimally suited for identifying break-spanning reads. The human genome version hg19 was used for mapping. d, TLA sequence coverage aligned on the AAV-TRAC-1928z sequence (Targeting sequence flanked by ITRs). The grey vertical bars on top represent the coverage at the shown positions. The coverage showed integration of the AAV ITRs in fraction of reads. The coverage comparison between ITR and CAR integration at the 5′ and 3′ ends of the TRAC homology arms locus allow the measurement of faithful and unfaithful homologous recombination shown in e. e, Final results from the TLA analysis.
Extended Data Figure 3. In vitro cytotoxicity activity and proliferation response of TRAC-CAR T cells.
a, Representative flow cytometry analysis showing CAR and TCR expression. TRAC-1928z CAR T cells were generated as in Fig. 1b; CRISPR/Cas9-generated TCR− T cells were transduced with RV-1928z retroviral vector; TCR+ cells were transduced with either RV-1928z or RV-P28z (PSMA-specific CAR). TCR-negative T-cell purification was performed using magnetic beads on column. b, Cytotoxic activity using an 18 h bioluminescence assay, using firefly luciferase (FFL)-expressing NALM-6 as targets cells (n =3 independent experiments on 3 healthy donors). c, Representative cumulative cell counts of CAR T cells upon weekly stimulation with CD19+ target cells. Arrows indicate stimulation time points (n = 3 independent experiments on 3 healthy donors).
Extended Data Figure 4. TRAC-CAR T cells outperform conventional CAR T cells in vivo.
a, NALM-6-bearing mice were treated with 2 × 10⁵ (left), 1 × 10⁵ (middle) or 5 × 10⁴ (right) CAR T cells. Tumour burden was quantified weekly over a 100-day period using BLI. Quantification is the average photon count of ventral and dorsal acquisitions per animal at all given time points. Each line represents one mouse. Some groups are pooled from two to three independent experiments from different healthy donors, representing n = 6–20 mice per group. Lower, Kaplan–Meier analysis of survival of mice. b–f, NALM-6-bearing mice were treated with 1 × 10⁵ indicated CAR T cells. At 10 and 17 days after CAR T-cell infusion, 7 mice per group were euthanized and bone marrow cells were collected. CAR T cells and NALM-6 cells were analysed and counted with flow cytometry. b, Representative FACS analysis of tumour cells (CD19+GFP+) in the bone marrow at day 17. c, Representative FACS analysis of exhaustion markers PD1 and TIM3 in bone marrow CAR T cells at day 17. d, Representative FACS analysis of exhaustion markers PD1 and LAG3 in bone marrow CAR T cells at day 17. e, CAR MFI of the CAR+ cells in the bone marrow (each dot represents one mouse). f, Coefficient of variation measuring the dispersion in the CAR expression of the CAR+ population (ratio of the standard deviation to the mean; each dot represents one mouse). g, RV-1928z CAR design allows the co-expression of the CAR and LNGFR from the same LTR promoter by using a self-cleaving P2A sequence. LTR, long terminal repeat, SD, splice donor site; SA, splice acceptor site; 2A, Porcine teschovirus self-cleaving 2A sequence. h, Representative flow cytometry plots of RV-1928z transduced T cells cultured in vitro or in vivo (extracted from bone marrow) and labelled to detect CAR and LNGFR expression. i, Comparison between CAR MFI in the RV-1928z T cells and the tumour burden (NALM-6 count) in the bone marrow.
Extended Data Figure 5. TRAC-19BBz CAR T cells outperform conventional 19BBz CAR T cells by preventing exhaustion in vivo.
a, b, These results compiled the average CAR MFI (a) and coefficient of variation (b) of CAR+ T cells obtained from three independent transfections or transductions. The T cells used for these three experiments have been isolated from blood of three different healthy donors. c, Left, activation, memory, and exhaustion markers of CAR T cells analysed by flow cytometry 5 days after gene transfer. Left, plots indicate the phenotypes of the CAR+ T cells measured by flow cytometry analysis of CD62L and CD45RA expression 5 days after CAR vectorization; colours as in e. d, Relative CAR MFI (1 = MFI at 0 h) after CAR T cells being activated 1, 2 or 4 times on CD19+ target cells over a 48 h periods (n = 3 independent experiments, arrows indicate stimulation time points). e, CAR T cells stimulated on CD19+ target cells either 1, 2 or 4 times in 48 h period were analysed by flow cytometry. Plots indicate the phenotypes of the CAR+ T cells measured by flow cytometry analysis of CD62L and CD45RA expression (average proportion from 3 independent experiments). f, FFL-NALM-6-bearing mice were treated with 1 × 10⁵ CAR T cells. Tumour burden shown as bioluminescent signal quantified per animal every week over a 21-day period. n = 6 mice per group. g–j, NALM-6-bearing mice were treated with 1 × 10⁵ CAR T cells. At 10 and 17 days after CAR T-cell infusion, 7 mice per group were euthanized and bone marrow cells were collected. CAR T cells and NALM-6 cells were analysed and counted with flow cytometry. Each dot represents one mouse. g, CAR T cells count in marrow (n =7). h, Tumour (CD19+GFP+ NALM-6) cells count in bone marrow (n =7). i, Effector/tumour ratio in the bone marrow (n =7). j, Exhaustion marker analysis from bone marrow T cells collected at day 17 and analysed by flow cytometry. Represented as the average percentage of cells expressing the indicated markers (n =7). *P <0.05, **P <0.01, ***P < 0.001 (Mann–Whitney test (a, b) ANOVA F-test (d); see Supplementary information)
Extended Data Figure 6. TRAC-CAR T cells show reduced tonic signalling and antigen-induced differentiation in vitro.
a, Representative FACS analysis of T cells differentiation markers 5 days after the CAR gene transfer. b, Representative FACS analysis of the CAR T cell differentiation markers after 1, 2 or 4 stimulations on CD19+ target cells. c, CAR T cells expansion when stimulated 1, 2 or 4 times on CD19+ target cells over a 48 h period. No noticeable difference in the proliferation was found between the three 1928z CAR T cells conditions. d, Percentage of CAR T cells with positive expression of IFNγ, TNFα or IL-2 after intracellular staining at the end of the protocol in Fig. 2d (n =2 independent experiments on 2 donors).
Extended Data Figure 7. TRAC-CAR T cells show delayed in vitro antigen-induced differentiantion compared to lowly or highly transduced RV-CAR T cells.
a, Representative histogram of the CAR expression 5 days after transduction of different volume of retroviral supernatant in μl (representative of 3 independent experiments; total transduction volume 2 ml). b, Percentage of CAR+ T cells in function of the volume of retroviral supernatant analysed by FACS 5 days after transduction. (n =3 donors). c. CAR mean fluorescence intensity (MFI) of T cells as a function of the volume of retroviral supernatant analysed by FACS 5 days after transduction (n =3 donors). d, CAR coefficient of variation as a function of the volume of retroviral supernatant analysed by FACS 5 days after transduction (n =3 donors). e, Average CAR MFI of CAR T cells 5 days after transduction (n = 3 donors). High =1,000 μl, and low =30 μl. f, CAR T cells stimulated on CD19+ target cells either 1, 2 or 4 times in 48 h period were analysed by flow cytometry. Plots indicate the phenotypes of the CAR-positive T cells measured by flow cytometry analysis of CD62L and CD45RA expression (average proportion from of 3 independent experiments).
Extended Data Figure 8. CAR gene expression using different promoters at distinct loci influences tonic signalling levels in vitro.
a, CRISPR/Cas9-targeted integration into the TRAC locus. The targeting construct (AAV) contains a splice acceptor (SA), followed by a P2A coding sequence, the 1928z CAR gene and a polyA sequence, flanked by sequences homologous to the TRAC locus (LHA and RHA, left and right homology arm). Once integrated, the endogenous TCRα promoter drives CAR expression, while the TRAC locus is disrupted. TRAV, TCRα variable region; TRAJ, TCRα joining region; 2A, the self-cleaving Porcine teschovirus 2A sequence. b, CRISPR/Cas9-targeted promoter integration into the TRAC locus. The targeting construct (AAV) contains the 1928z CAR coding sequence in the reverse orientation, under the control of an exogenous promoter, the long version of human EF1α, the enhancer sequence from the gamma retrovirus used in Figs 1, 2 (Mo-MLV LTR here called LTR) or the phosphoglycerate kinase (PGK) promoter and a polyA sequence, flanked by sequences homologous to the TRAC locus (LHA and RHA, left and right homology arm). c, Schematic of tailored CRISPR/Cas9-induced targeted integration into the B2M locus. The targeting construct (AAV) contains the CAR gene flanked by homology sequences (LHA and RHA). Once integrated, the endogenous B2M promoter drives CAR expression. d, CRISPR/Cas9-targeted promoter integration into the B2M locus. The targeting construct (AAV) contains the 1928z CAR gene in the reverse orientation, under the control of an exogenous promoter, human EF1α, the PGK promoter or a truncated version of the PGK (PGK100) and a polyA sequence, flanked by sequences homologous to the B2M locus (LHA and RHA, left and right homology arm). e, Average CAR mean fluorescence intensity (MFI) analysed by FACS 4 days after transduction (n = 3 to 7 independent experiments and 4 different donors). pA: bovine growth hormone polyA sequence for all targeting constructs. f, Left, representative histogram of the CAR expression 5 days after its vectorization into T cells. Middle, activation, memory, and exhaustion markers of CAR T cells analysed by flow cytometry 5 days after the vectorization of the CAR. Right, plots indicate the phenotypes of the CAR+ T cells measured by flow cytometry analysis of CD62L and CD45RA expression 5 days after CAR gene transfer.
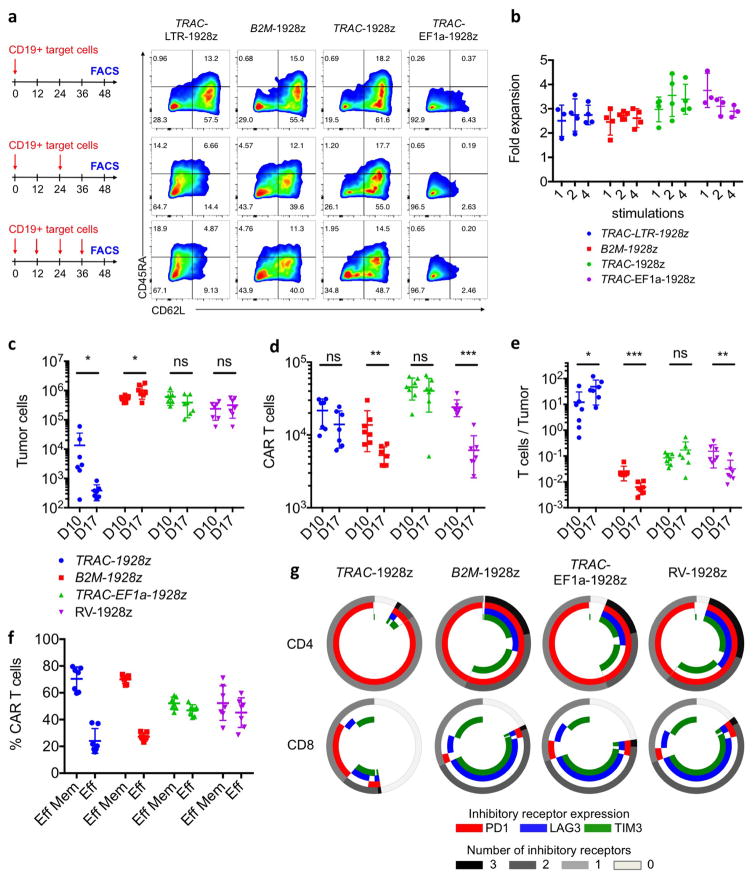
Extended Data Figure 9. CAR gene expression using different promoters at distinct loci influences antigen-induced differentiation and exhaustion in vivo.
a, Representative FACS analysis of the CAR T-cell differentiation markers after 1, 2 or 4 stimulations on CD19+ target cells. b, CAR T-cell expansion when stimulated 1, 2 or 4 times on CD19+ target cells over a 48 h period. No apparent difference in the proliferation was found between the four 1928z CAR T cells conditions. c–e, NALM-6-bearing mice were treated with 1 × 10⁵ CAR T cells. At 10 and 17 days after CAR T cell infusion, 7 mice per group were euthanized and bone marrow cells were collected. CAR T cells and NALM-6 cells were analysed and counted with flow cytometry. Each dot represents one mouse. f, Percentage of effector memory (‘Eff mem’, CD62L−CD45RA−) and effector (‘Eff ’, CD62L− CD45RA+) in the bone marrow CAR T cells at day 17 (n =7 mice). g, Exhaustion marker analysis from bone marrow T cells collected at day 17 and analysed by flow cytometry. Represented as the average percentage of cells expressing the indicated markers (n =7 mice).
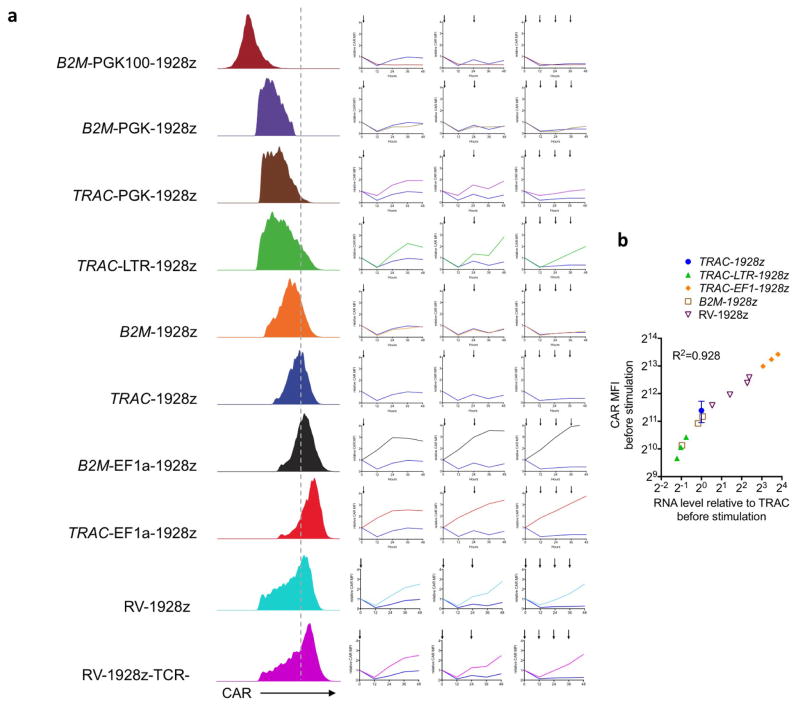
Extended Data Figure 10. Locus-promoter configuration controls CAR protein expression and transcriptional response upon CAR T cell activation.
a, Left, representative histogram of the CAR expression 5 days after its vectorization into T cells. Right, relative CAR MFI (1 =MFI at 0 h) after CAR T cells being activated 1, 2 or 4 times on CD19+ target cells over a 48 h period. b, Comparison between CAR MFI and CAR RNA relative level before stimulation (n = 3 independent experiment on 3 donors).
Acknowledgments
We thank I. Rivière (MSKCC) for helpful discussion and for reviewing the manuscript. We thank the SKI Flow Cytometry core facility and animal facility for excellent support. This work was in part supported by the Lake Road Foundation, the Mr. William H. and Mrs. Alice Goodwin and the Commonwealth Foundation for Cancer Research, Stand Up To Cancer/American Association for Cancer Research (a program of the Entertainment Industry Foundation administered by the American Association for Cancer Research), the Lymphoma and Leukemia Society, NYSTEM, NYSCF and the MSK Cancer Center Support Grant/Core Grant (P30 CA008748).
Footnotes
Supplementary Information is available in the online version of the paper.
Author Contributions J.E. and J.M.-S. designed the study, performed experiments, analysed and interpreted the data and wrote the manuscript. T.G. designed the antibody panels for the in vivo flow cytometry and performed experiments. K.M.C. and M.G. performed the statistical analysis. S.v.d.S. performed in vivo experiments. M.H. performed the cytokine panel. A.O. performed experiments. M.S. designed the study, analysed and interpreted the data and wrote the manuscript.
The authors declare competing financial interests: details are available in the online version of the paper.
Readers are welcome to comment on the online version of the paper.
Reviewer Information Nature thanks M. Maus, E. J. Wherry and the other anonymous reviewer(s) for their contribution to the peer review of this work.
Online Content Methods, along with any additional Extended Data display items and Source Data, are available in the online version of the paper; references unique to these sections appear only in the online paper.
References
- 1.Jensen MC, Riddell SR. Designing chimeric antigen receptors to effectively and safely target tumors. Curr Opin Immunol. 2015;33:9–15. doi: 10.1016/j.coi.2015.01.002. [DOI] [PMC free article] [PubMed] [Google Scholar]
- 2.Brentjens RJ, et al. Eradication of systemic B-cell tumors by genetically targeted human T lymphocytes co-stimulated by CD80 and interleukin-15. Nat Med. 2003;9:279–286. doi: 10.1038/nm827. [DOI] [PubMed] [Google Scholar]
- 3.Sadelain M. CAR therapy: the CD19 paradigm. J Clin Invest. 2015;125:3392–3400. doi: 10.1172/JCI80010. [DOI] [PMC free article] [PubMed] [Google Scholar]
- 4.Sadelain M, Mulligan RC. Efficient retroviral-mediated gene transfer into murine primary lymphocytes. Ninth International Immunology Congress; Budapest. 1992. p. 34. [Google Scholar]
- 5.Wang X, Rivière I. Clinical manufacturing of CAR T cells: foundation of a promising therapy. Mol Ther Oncolytics. 2016;3:16015. doi: 10.1038/mto.2016.15. [DOI] [PMC free article] [PubMed] [Google Scholar]
- 6.Ellis J. Silencing and variegation of gammaretrovirus and lentivirus vectors. Hum Gene Ther. 2005;16:1241–1246. doi: 10.1089/hum.2005.16.1241. [DOI] [PubMed] [Google Scholar]
- 7.Rivière I, Dunbar CE, Sadelain M. Hematopoietic stem cell engineering at a crossroads. Blood. 2012;119:1107–1116. doi: 10.1182/blood-2011-09-349993. [DOI] [PMC free article] [PubMed] [Google Scholar]
- 8.von Kalle C, Deichmann A, Schmidt M. Vector integration and tumorigenesis. Hum Gene Ther. 2014;25:475–481. doi: 10.1089/hum.2014.2525. [DOI] [PMC free article] [PubMed] [Google Scholar]
- 9.Wright AV, Nuñez JK, Doudna JA. Biology and applications of CRISPR systems: harnessing nature’s toolbox for genome engineering. Cell. 2016;164:29–44. doi: 10.1016/j.cell.2015.12.035. [DOI] [PubMed] [Google Scholar]
- 10.Tsai SQ, Joung JK. Defining and improving the genome-wide specificities of CRISPR-Cas9 nucleases. Nat Rev Genet. 2016;17:300–312. doi: 10.1038/nrg.2016.28. [DOI] [PMC free article] [PubMed] [Google Scholar]
- 11.Lombardo A, et al. Site-specific integration and tailoring of cassette design for sustainable gene transfer. Nat Methods. 2011;8:861–869. doi: 10.1038/nmeth.1674. [DOI] [PubMed] [Google Scholar]
- 12.Sather BD, et al. Efficient modification of CCR5 in primary human hematopoietic cells using a megaTAL nuclease and AAV donor template. Sci Transl Med. 2015;7:307ra156. doi: 10.1126/scitranslmed.aac5530. [DOI] [PMC free article] [PubMed] [Google Scholar]
- 13.Brentjens RJ, et al. CD19-targeted T cells rapidly induce molecular remissions in adults with chemotherapy-refractory acute lymphoblastic leukemia. Sci Transl Med. 2013;5:177ra38. doi: 10.1126/scitranslmed.3005930. [DOI] [PMC free article] [PubMed] [Google Scholar]
- 14.Wang J, et al. Highly efficient homology-driven genome editing in human T cells by combining zinc-finger nuclease mRNA and AAV6 donor delivery. Nucleic Acids Res. 2016;44:e30. doi: 10.1093/nar/gkv1121. [DOI] [PMC free article] [PubMed] [Google Scholar]
- 15.Hubbard N, et al. Targeted gene editing restores regulated CD40L function in X-linked hyper-IgM syndrome. Blood. 2016;127:2513–2522. doi: 10.1182/blood-2015-11-683235. [DOI] [PubMed] [Google Scholar]
- 16.Corthay A, Nandakumar KS, Holmdahl R. Evaluation of the percentage of peripheral T cells with two different T cell receptor alpha-chains and of their potential role in autoimmunity. J Autoimmun. 2001;16:423–429. doi: 10.1006/jaut.2001.0504. [DOI] [PubMed] [Google Scholar]
- 17.de Vree PJ, et al. Targeted sequencing by proximity ligation for comprehensive variant detection and local haplotyping. Nat Biotechnol. 2014;32:1019–1025. doi: 10.1038/nbt.2959. [DOI] [PubMed] [Google Scholar]
- 18.Zhao Z, et al. Structural design of engineered costimulation determines tumor rejection kinetics and persistence of CAR T cells. Cancer Cell. 2015;28:415–428. doi: 10.1016/j.ccell.2015.09.004. [DOI] [PMC free article] [PubMed] [Google Scholar]
- 19.Blackburn SD, et al. Coregulation of CD8+ T cell exhaustion by multiple inhibitory receptors during chronic viral infection. Nat Immunol. 2009;10:29–37. doi: 10.1038/ni.1679. [DOI] [PMC free article] [PubMed] [Google Scholar]
- 20.Gattinoni L, et al. A human memory T cell subset with stem cell-like properties. Nat Med. 2011;17:1290–1297. doi: 10.1038/nm.2446. [DOI] [PMC free article] [PubMed] [Google Scholar]
- 21.Gallardo HF, Tan C, Sadelain M. The internal ribosomal entry site of the encephalomyocarditis virus enables reliable coexpression of two transgenes in human primary T lymphocytes. Gene Ther. 1997;4:1115–1119. doi: 10.1038/sj.gt.3300506. [DOI] [PubMed] [Google Scholar]
- 22.Long AH, et al. 4-1BB costimulation ameliorates T cell exhaustion induced by tonic signaling of chimeric antigen receptors. Nat Med. 2015;21:581–590. doi: 10.1038/nm.3838. [DOI] [PMC free article] [PubMed] [Google Scholar]
- 23.Sommermeyer D, et al. Chimeric antigen receptor-modified T cells derived from defined CD8+ and CD4+ subsets confer superior antitumor reactivity in vivo. Leukemia. 2016;30:492–500. doi: 10.1038/leu.2015.247. [DOI] [PMC free article] [PubMed] [Google Scholar]
- 24.Frigault MJ, et al. Identification of chimeric antigen receptors that mediate constitutive or inducible proliferation of T cells. Cancer Immunol Res. 2015;3:356–367. doi: 10.1158/2326-6066.CIR-14-0186. [DOI] [PMC free article] [PubMed] [Google Scholar]
- 25.Schrum AG, Turka LA, Palmer E. Surface T-cell antigen receptor expression and availability for long-term antigenic signaling. Immunol Rev. 2003;196:7–24. doi: 10.1046/j.1600-065x.2003.00083.x. [DOI] [PubMed] [Google Scholar]
- 26.Liu H, Rhodes M, Wiest DL, Vignali DA. On the dynamics of TCR:CD3 complex cell surface expression and downmodulation. Immunity. 2000;13:665–675. doi: 10.1016/s1074-7613(00)00066-2. [DOI] [PubMed] [Google Scholar]
- 27.Call ME, Wucherpfennig KW. The T cell receptor: critical role of the membrane environment in receptor assembly and function. Annu Rev Immunol. 2005;23:101–125. doi: 10.1146/annurev.immunol.23.021704.115625. [DOI] [PubMed] [Google Scholar]
- 28.Allison KA, et al. Affinity and dose of TCR engagement yield proportional enhancer and gene activity in CD4+ T cells. eLife. 2016;5:e10134. doi: 10.7554/eLife.10134. [DOI] [PMC free article] [PubMed] [Google Scholar]
- 29.Schietinger A, Greenberg PD. Tolerance and exhaustion: defining mechanisms of T cell dysfunction. Trends Immunol. 2014;35:51–60. doi: 10.1016/j.it.2013.10.001. [DOI] [PMC free article] [PubMed] [Google Scholar]
- 30.Wherry EJ, Kurachi M. Molecular and cellular insights into T cell exhaustion. Nat Rev Immunol. 2015;15:486–499. doi: 10.1038/nri3862. [DOI] [PMC free article] [PubMed] [Google Scholar]
- 31.Rivière I, Brose K, Mulligan RC. Effects of retroviral vector design on expression of human adenosine deaminase in murine bone marrow transplant recipients engrafted with genetically modified cells. Proc Natl Acad Sci USA. 1995;92:6733–6737. doi: 10.1073/pnas.92.15.6733. [DOI] [PMC free article] [PubMed] [Google Scholar]
- 32.Maher J, Brentjens RJ, Gunset G, Rivière I, Sadelain M. Human T-lymphocyte cytotoxicity and proliferation directed by a single chimeric TCRζ/CD28 receptor. Nat Biotechnol. 2002;20:70–75. doi: 10.1038/nbt0102-70. [DOI] [PubMed] [Google Scholar]
- 33.Gong MC, et al. Cancer patient T cells genetically targeted to prostate-specific membrane antigen specifically lyse prostate cancer cells and release cytokines in response to prostate-specific membrane antigen. Neoplasia. 1999;1:123–127. doi: 10.1038/sj.neo.7900018. [DOI] [PMC free article] [PubMed] [Google Scholar]
- 34.Gade TP, et al. Targeted elimination of prostate cancer by genetically directed human T lymphocytes. Cancer Res. 2005;65:9080–9088. doi: 10.1158/0008-5472.CAN-05-0436. [DOI] [PubMed] [Google Scholar]
Associated Data
This section collects any data citations, data availability statements, or supplementary materials included in this article.
Data Availability Statement
All relevant data are available from the authors. Representative FACS profiles have been added to appropriate Extended Data Figures, and the statistical model used for the ANOVA F-tests are in the Supplementary Information.


