Abstract
Chloroquine has been widely used in the treatment of malaria since the 1950’s. CQ is also becoming an important therapeutic compound for the treatment of auto-immune disorders and has shown activity as an anti-cancer agent. The full extent of CQ pharmacology in humans is still unclear. Herein, we demonstrate that the lysosomal protein saposin B, critical for select lipid degradation, binds chloroquine with implications for both chloroquine function and toxicity.
Keywords: chloroquine, saposin B, Isothermal titration calorimetry, protein crystal structure, lysosome
Graphical abstract
The full extent of chloroquine (CQ) pharmacology in humans remains unclear. Herein, we demonstrate that the lysosomal protein saposin B, critical for select lipid degradation, binds CQ with implications for CQ function and toxicity.
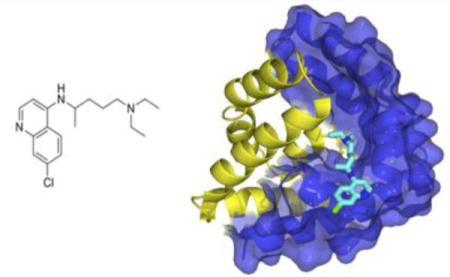
Chloroquine (CQ) was first synthesized in 1934 by the Bayer scientist Johann Anderstag and initially given the name resorchin (RESORcinate of 4-aminoCHINolin).1 Originally deemed too toxic for use in humans, it was rediscovered in the 1940s and has been widely used against malaria, with a high degree of success, since the 1950s.2 Several side effects can result from excessive use of CQ, such as gastro-intestinal distress, retinopathy, cardiac toxicity and even death.3,4 These contraindications are likely due to CQ being a noted negative ionotrope, vasodilator, and inhibitor of intraventricular conduction.2 Malaria treatment requires high doses of chloroquine (up to 1,500 mg) over several days.5,6 In meta-analysis it has been shown that 5 g of ingested CQ is almost invariably fatal if not treated (charcoal flushing, use of diazepam and adrenaline) and 2 g has been fatal, accounting for the relatively high morbidity associated with CQ treatment.7,8,9,10
CQ dosage is recommended based on weight, but most patients are simply given a set dose.7 In addition to acute toxicity upon ingestion, CQ has toxicity associated with prolonged use (a cumulative dose of >100 g and duration of treatment >1 year), particularly in the development of retinal maculopathy.8 Chronic CQ use has been shown to cause lysosomal dysfunction in retinal pigment epithelial cells with associated rise in lysosome pH and an increase in lysosome/phagosome accumulation of rod outer segments, a marker of degradation.
The emergence of CQ-resistant malarial strains coupled to its toxicity has limited CQ use in recent years, particularly in regions of Africa, Southeast Asia and large portions of South America. However, low doses of CQ are under investigation for different therapeutic applications, with CQ now used for the treatment of lupus,11 rheumatoid disease,12 sarcoidosis,13 and postulated for use in cancer therapy.14 In order to optimise the use of CQ as a therapeutic agent, the mechanisms of CQ transport, activity and toxicity need to be more fully elucidated.
To date, the full mechanism of action of CQ is unknown, but it is accepted that CQ is a lysosomotropic agent that interferes with cellular processes by raising lysosomal pH.15 It is likely that CQ toxicity mitigating processes exist in the human lysosome, however their mechanism of action is not known.
Saposin B (sapB) is a lysosomal protein and one of the most studied members of the saposin protein family.16 Li and co-workers have demonstrated that sapB is involved in the hydrolysis of glycolipids and glycerolipids.17 A deficiency in sapB results in the accumulation of lipids in the lysosome and results in the lysosomal storage disease metachromatic leukodystrophy.18 SapB is unique in the saposin family in that it facilitates degradation by interacting with the substrate, not the enzymes, with sapB having no direct effect on substrate hydrolysis.19 We,20,21 and others,22 have demonstrated that sapB can bind Coenzyme Q10 (CoQ10) with preferred binding at pH 5.5. Such binding is important in the removal of ‘damaged’ CoQ10 from membranes and possible subsequent transport for excretion. Most recently, Yamamoto et al., demonstrated that prosaposin and/or sapB can actually regulate CoQ10 levels in human cells (Liver HepG2).23 It occurred to us that, given the lysosomal accumulation of CQ and the structural similarities between CoQ10 and CQ, that sapB might bind CQ with relevant physiological conseqeunces.
Herein, we investigate the binding of sapB with CQ using isothermal titration calorimetry, fluorescence quenching experiments and X-ray crystallography. Our results indicate significant binding between sapB and CQ at both pH 5.5 and 7.4, akin to that of CoQ10. An X-ray crystal structure of the sapB-CQ complex is also reported and shows the presence of one CQ molecule per sapB dimer, in accordance with our binding studies. The data is discussed in terms of possible implications on the toxicity of CQ.
Results
Isothermal Titration Calorimetry (ITC) and Fluorescence Quenching Experiments of Saposin B with Chloroquine
The expression and purification of sapB is described elsewhere.21 The apparent thermodynamic parameters of CQ binding to sapB in buffered aqueous solution of 20 mM phosphate at pH 5.5 and pH 7.4 were obtained by isothermal titration calorimetry and fluorescence spectroscopy. The integrated heats (μJ) for each injection vs. the molar ratio of CQ to sapB dimer are shown in Figure 2, while the inset illustrates the raw ITC results for sapB titration with CQ. Control titrations of CQ into buffer were performed and used in the analysis. The ITC data were obtained on a nano-ITC (185 μL reaction volume) from TA Instruments whereby downward negative peaks correspond to an endothermic reaction. We note that all reported thermodynamic quantities in this study are apparent values (i.e. experimentally measured values under non-standard conditions), which may include possible contributions to the overall equilibrium from different processes such as structural rearrangements of protein-substrate complexes upon interaction and substrate and buffer species in different states of protonation. The heats at the end of these titrations were in excess of the heat of dilution from adding CQ into buffer suggesting the presence of additional weak binding to the protein or protein-protein association and/or oligomerization. SapB has been shown to form dimeric complexes in solution under most conditions, thus accounting for the observed results.24
Figure 2.
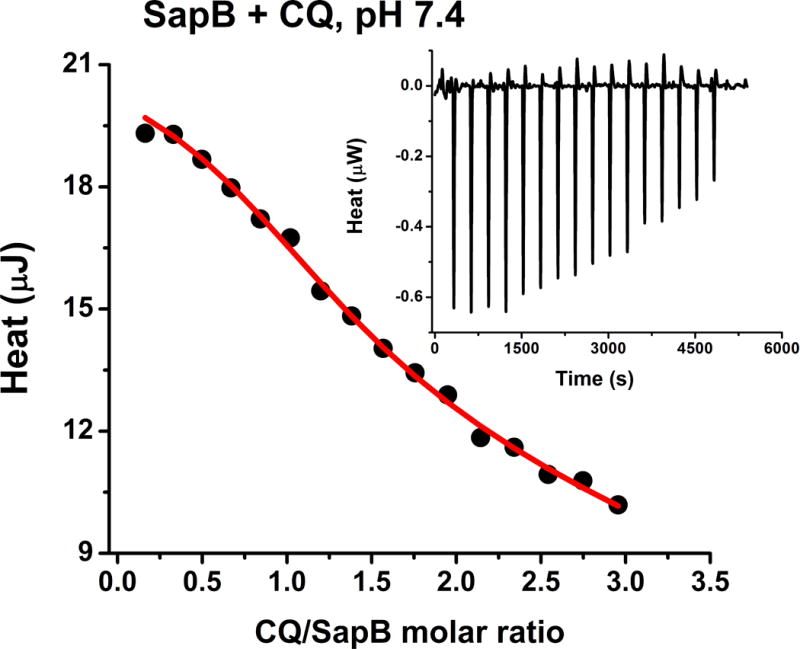
Calorimetric titration of sapB with CQ showing a plot of the integrated heat versus the CQ/sapB molar ratio (main panel) and the raw ITC data (inset). Conditions: 0.2–0.5 mM protein titrated with 3 μL injections of 2–4 mM CQ in 20 mM phosphate buffer, pH 7.4 and 25.00 °C.
Accordingly, a model of two sets of independent binding sites, one strong and one weak, was used to curve fit the data and the derived experimental thermodynamic parameters for the strong sites are summarized in Table 1. Due to the weak nature of the second set of sites, the individual thermodynamic parameters could not be determined and only the product of the three parameters, n2.K2.ΔH2 is reported. Similar ITC results were obtained at pH 5.5 as reported in Table 1.
Table 1.
Best fit parameters for ITC and fluorescence data of CQ binding to sapB at pH 5.54 and 7.4. The experimental conditions are those of Figures 2–3. The reported results represent the mean ± SD of at least four independent experiments.
| ITC of (SapB + CQ) | SapB (5.5) | SapB (7.4) |
|---|---|---|
| n1 (per sapB dimer) | 1.12 ± 0.07 | 1.01 ± 0.09 |
| KITC (M−1) | (3.14 ± 1.58) × 104 | (2.45 ± 0.81) × 104 |
| ΔGITC (KJ/mol) | −25.66 ± 1.25 | −25.05 ± 0.82 |
| ΔHITC (KJ/mol) | 2.55 ± 1.31 | 1.99 ± 0.71 |
| ΔSITC (J.K−1.mol−1) | 104.95 ± 24.11 | 90.70 ± 3.64 |
| n2.K2,ITC .ΔH2,ITC | (3.17 ± 1.86) × 104 | (1.63 ± 0.24) × 104 |
| Fluoresecence of (sapB +CQ) | SapB (5.5) | SapB (7.4) |
| n (per sapB dimer) | 1.14 ± 0.05 | 1.06 ± 0.11 |
| Ka (M−1) | (1.53 ± 0.18) × 104 | (2.03 ± 0.12) × 104 |
The ITC data indicate that 1 CQ molecule binds per sapB dimer with a binding affinity (K) on the order of ~3 × 10⁴ M−1 (Table 1). The binding is entropically driven whereby the observed large and positive change in the entropy (ΔS) of binding is ascribed to changes in the hydration state of the protein and the ligand (i.e. release of water molecules) upon ligand binding.
Fluorescence Quenching Studies of CQ Binding to SapB
To corroborate the ITC results, fluorescence-quenching studies were performed between sapB and chloroquine in 20 mM phosphate buffer, pH 5.5 and 7.4. The quenching of the emission intensity of tryptophan and tyrosine residues of sapB at 325 nm was monitored on a Varian Cary Eclipse spectrofluorimeter with increasing concentrations of CQ. The experimental conditions are reported in the caption of Figure 3.
Figure 3.
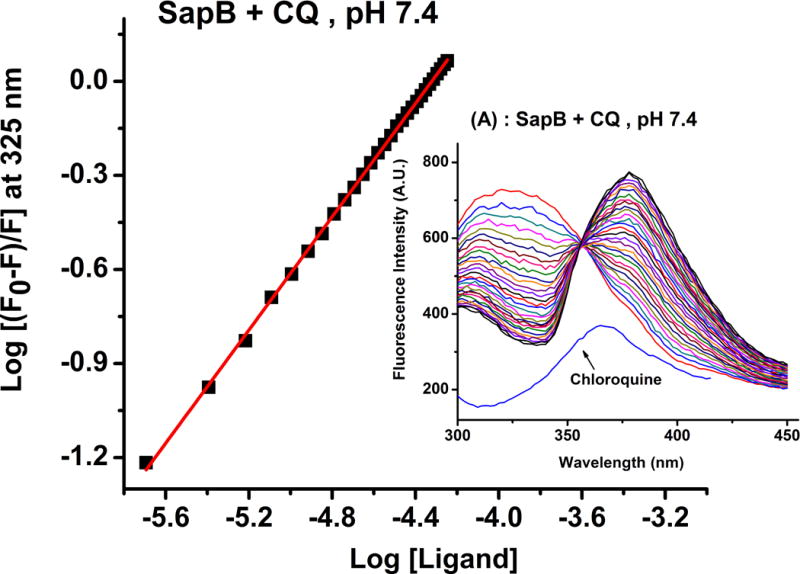
Representative fluorescence quenching experiments of CQ binding to sapB in 20 mM phosphate buffer, pH 7.4. Conditions: several 2 to 3 μL injections of [CQ] = 1.0 mM solution into the fluorescence cuvette containing [sapB] = 40 μM. λex = 280 nm and λem = 300 – 450 nm with excitation and emission slits opening of 10 nm each.
For a static quenching process, when small molecules bind independently to a set of equivalent sites on a macromolecule, the equilibrium between free and bound molecules is given by the following equation:
where Ka is the binding constant, n the number of binding sites on the protein, Q the quencher concentration (i.e. CQ) and F0 and F the steady-state fluorescence intensities in the absence and in the presence of the quencher, respectively. The values of n (slope) and the intercept (log Ka) can be obtained from the double logarithm plot shown in Figure 3 and are reported in Table 1. The data in Figure 3 reflects the effect of chloroquine on the fluorescence intensity of sapB and shows a binding stoichiometry of 1 CQ per sapB dimer and a binding affinity close to 1 × 10⁴ M−1, consistent with the ITC results. Note that the lowest fluorescence emission curve in Figure 3 (blue curve) is that of chloroquine alone in buffer showing minimal interference with the emission spectrum of the protein at 325 nm. Upon binding to sapB, a red-shift in the emission peaks of sapB and CQ is observed suggesting the formation of a protein-ligand complex and a change in the micro-environment of the protein binding site. Similar observations were noted at pH 5.5 (Table 1), which is the pH of the lysosome where sapB is found; however, a notable change in the peak shapes was observed and is likely due to the change in pH. Nonetheless, both ITC and fluorescence quenching studies showed similar binding stoichiometry and affinity between CQ and sapB at both pH values tested (see Table 1).
Crystal Structure of SapB with Bound CQ at pH 6
Initial attempts to crystallize and resolve a crystal structure from the expressed and purified sapB used in the ITC and fluorescence measurements with chloroquine were unsuccessful. Poor crystal quality and limited diffraction were likely due to the presence of a non-cleavable poly-histidine tag used in purification. This is not unexpected because the His6 tag is unstructured and likely impedes crystal packing. As a result, the protein was re-expressed with a TEV protease cleavage site introduced after the His6 tag. Once the protein was newly expressed and purified via IMAC, the affinity tag was cleaved with AcTEV protease and crystal screening was conducted. SapB in complex with CQ crystallized in the P3221 space group with additional crystallographic data provided in Table 2 (PDB 4V2O). The crystal structure of sapB with bound CQ is shown below (Figures 4 and 5).
Table 2.
Data collection and refinement statistics for sapB/CQ crystals.
| Data collection and refinement statistics
| |
|---|---|
| Saposin B | |
| Data collection | |
| Space group | P3221 |
| Cell dimensions | |
| a, b, c (Å) | 75.3, 75.3, 94.7 |
| α, β, γ (°) | 90, 90, 120 |
| Resolution (Å) | 60.−2.12 (2.20–2.13)* |
| Rsym | 7.4 (92.2)* |
| I / σ/ | 14.4(1.6)* |
| Completeness (%) | 98.9 (92.5)* |
| Redundancy | 6.9 (6.3)* |
| Refinement | |
| Resolution (Å) | 15.–2.13 |
| No. reflections | 17711 |
| Rwork/Rfree | 0.234/0.253 |
| No. atoms | 2206 |
| Protein | 1849 |
| Ligand/ion | 214 |
| Water | 143 |
| B-factors | |
| Protein | 64.5 |
| Ligand/ion | 85.6 |
| Water | 57.7 |
| R.m.s. deviations | |
| Bond lengths (Å) | 0.009 |
| Bond angles (°) | 1.05 |
refers to highest resolution shell
Figure 4.
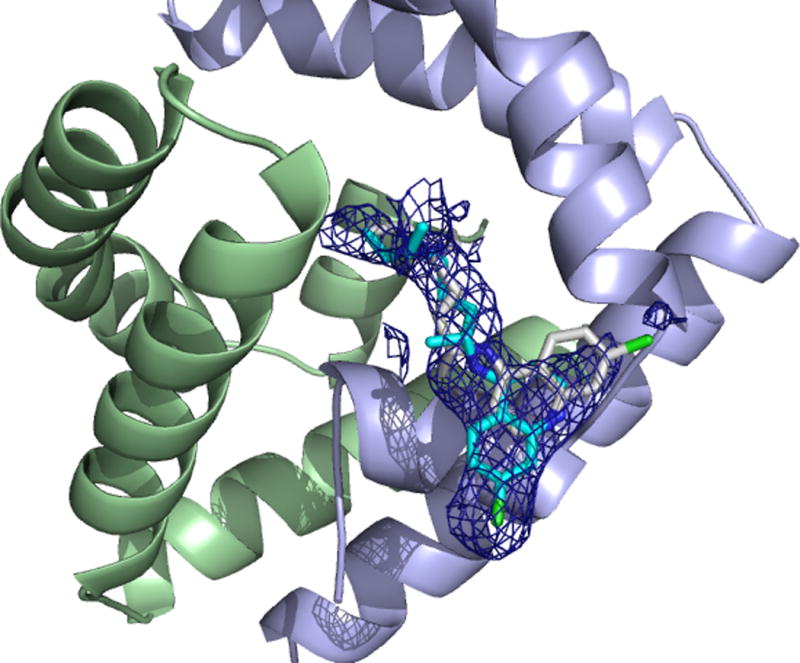
(Crystal structure of sapB bound to CQ at a resolution of 2.12 Å. Electron density around the CQ substrate contoured at 0.9 sigma. One monomer is in pale green, the other in pale blue. The two CQ molecules are displayed and coloured by atom with carbons in cyan and gray for the two conformations
Figure 5.
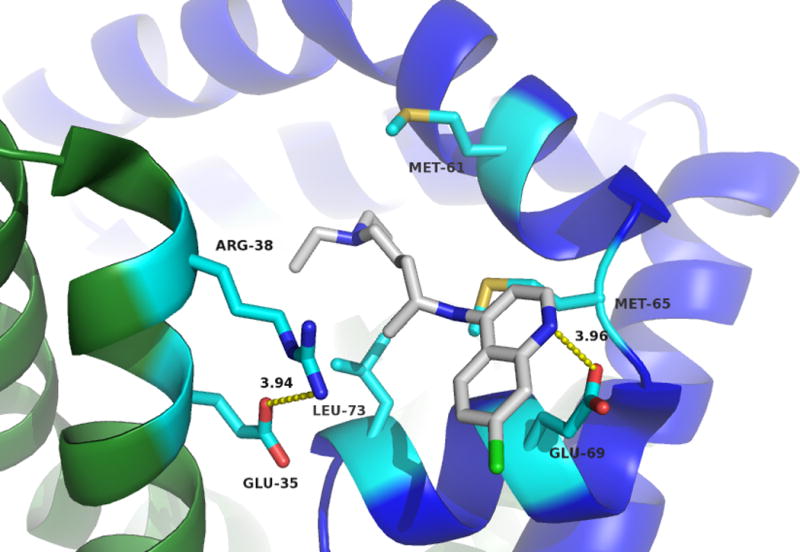
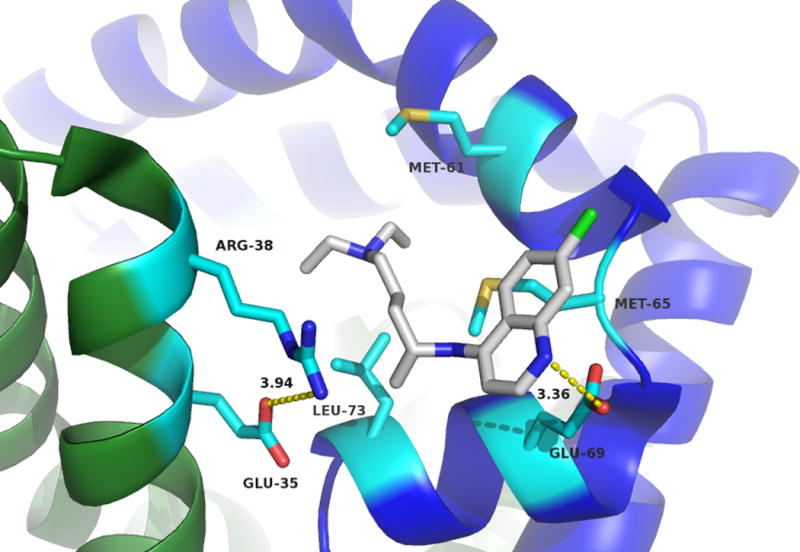
CQ bound inside the sapB dimer pocket. Monomers are shown in green and blue with side chains coloured by atom with carbons in cyan. CQ molecule is shown with carbons in gray and coloured by atom. Critical residues involved in CQ binding are indicated and labelled. The two conformations of the heterocyclic moiety of CQ are shown at top and bottom.
This crystal structure is in support of the ITC and fluorescence quenching data confirming that the binding of CQ to sapB does indeed occur and is dependent upon proper dimerization of sapB. A close-up view of the active site and the amino acid residues forming the binding pocket for CQ is shown in Figure 5. The CQ binding pocket is largely hydrophobic with contributions of Leu73, Met61 and Met65 residues from one monomer and Arg38 and Glu35 residues from the second partner monomer. Arg38 and Glu35 are involved in a salt bridge and the aliphatic portion of Arg38 additionally forms a wall of the active site pocket. Glu69 is involved in a potential hydrogen bonding interaction with the CQ substrate as indicated by the dotted yellow line in Figure 5.
There are two possible conformations (see Figure 5) of the CQ molecule within the binding pocket based on the electron density. While the CQ chain undergoes minor conformational changes, the heterocyclic moiety is shown to exhibit two conformations based on the crystal structure. Residue Glu69 of one sapB monomer appears to interact with CQ in either conformation through a hydrogen bonding interaction. Met65 and Leu73 appear to help sequester the hydrophobic tail of the CQ molecule.
Initial mutagenesis studies focused on Glu69 to explore whether this residue plays any major role in the binding of CQ to sapB. We prepared a sapB variant (E69A) and performed additional binding studies. Figure 6 shows an ITC titration and a fluorescence quenching experiment between CQ and sapB mutant E69A at pH 5.5 and 7.4, respectively. The results were similar to those observed with wild-type sapB (see Tables 2 and 3) suggesting a relatively minor role of residue Glu69 in the interaction of CQ with sapB. The binding reaction is still strongly entropically favoured as indicated by the large and positive value of ΔS. It is likely that the hydrophobic residues lining the substrate-binding site play a larger role in substrate specificity and binding.
Figure 6.
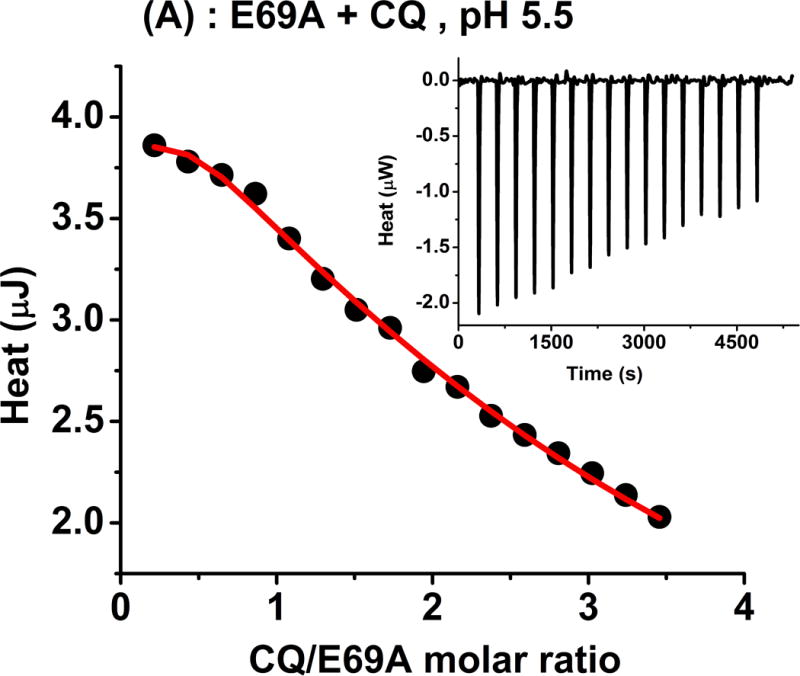
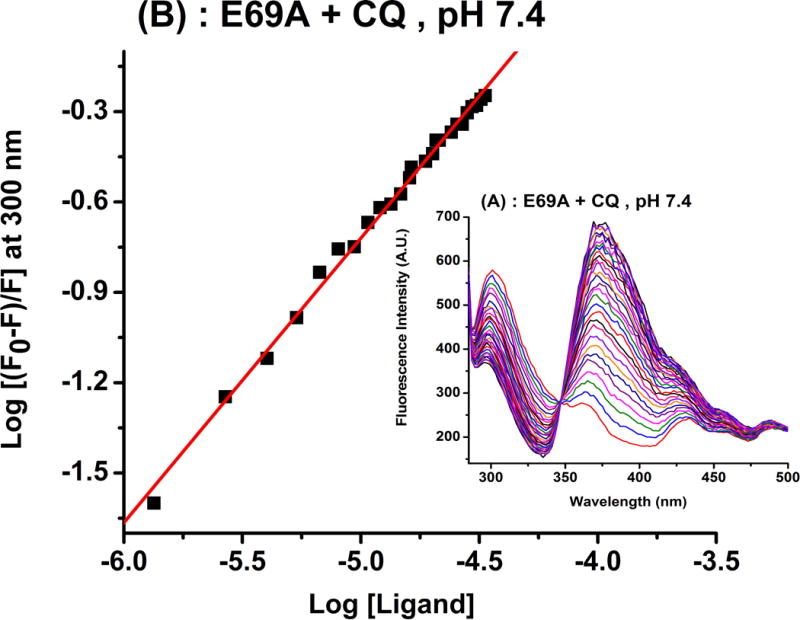
(A) Calorimetric titration of E69A with CQ showing a plot of the integrated heat versus the CQ/protein molar ratio (main panel) and the raw ITC data (inset). (B) Fluorescence quenching experiments of CQ binding to E69A. The experimental conditions are similar to those in Figures 2 and 3. The ITC experiment at pH 5.5 was performed in 20 mM phosphate buffer and 25.00 °C.
Table 3.
Best fit parameters for ITC and fluorescence data of CQ binding to E69A at pH 5.5 and 7.4. The experimental conditions are those of Figure 6. The reported results represent the mean ± SD of at least two independent experiments for ITC and four independent experiments for fluorescence. (n.d., not determined).
| ITC of (E69A + CQ) | E69A(5.5) | E69A(7.4) |
|---|---|---|
| n1 (per sapB dimer) | 0.98 ± 0.08 | n.d.* |
| K1 (M−1) | (4.33 ± 1.98) × 104 | n.d. |
| ΔGITC (KJ/mol) | −26.46 ± 0.46 | n.d. |
| ΔHITC (KJ/mol) | 2.46 ± 1.10 | n.d. |
| ΔSITC (J.K−1.mol−1) | 96.25 ± 0.99 | n.d. |
| n2.K2,ITC .ΔH2, ITC | (7.69 ± 3.04) × 104 | n.d. |
| Fluoresecence of (E69A + CQ) | E69A (5.5) | E69A(7.4) |
| n (per sapB dimer) | 0.85 ± 0.07 | 0.95 ± 0.06 |
| Ka (M−1) | (5.74 ± 2.43) × 103 | (1.02 ± 0.46) × 104 |
Overall, the sapB/CQ crystal structure supports the conclusion that two sapB monomers come together to bind to a single CQ molecule, at least under the conditions of the structure obtained in the solid state. This conclusion is supported by ITC data and fluorescence quenching experiments at pH 5.5 and pH 7.4.
As noted above, we recently reported the binding of sapB with CoQ10 (see Figure 7) using ITC and fluorescence spectroscopy.20
Figure 7.
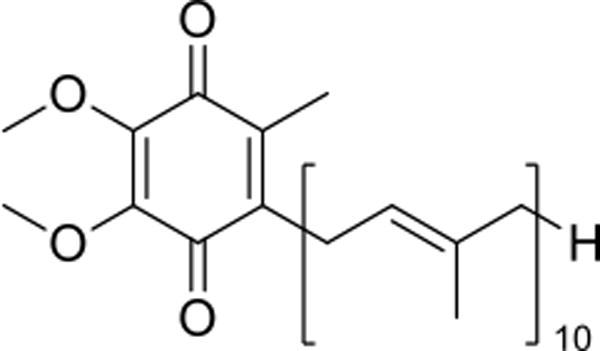
Chemical structure of coenzyme Q10 (CoQ10).
The ITC binding parameters of CoQ10 and CQ with sapB (see Table 4) at lysosomal pH 5.5 exhibit some degrees of similarities. In both cases, the binding stoichiometry is one molecule per sapB dimer and the reaction is strongly entropy favoured. The binding affinity of CoQ10 to sapB is ~ three orders of magnitude greater than of CQ, being ~ 107 M−1 for CoQ10 compared to ~ 104 M−1 for CQ), which may reflect the high hydrophobicity of the binding pocket of sapB and that of CoQ10.
Table 4.
Best-fit parameters for ITC data of sapB binding to CQ and CoQ10 at pH 5.5. The reported results represent the mean ± SD of at least four independent experiments.
| ITC of SapB and Substrates | CoQ10 (5.5)20 | CQ (5.5) |
|---|---|---|
| n1 (per sapB dimer) | 1.06 ± 0.05 | 1.12 ± 0.07 |
| K1 (M−1) | (1.7 ± 0.54) × 107 | (3.14 ± 1.58) × 104 |
| ΔGITC (KJ/mol) | −41.27 ± 0.78 | −25.66 ± 1.25 |
| ΔHITC (KJ/mol) | 90.48 ± 4.63 | 2.55 ± 1.31 |
| ΔSITC (J.K−1.mol−1) | 441.9 ± 4.69 | 104.95 ± 24.11 |
| n2.K2,ITC .ΔH2, ITC | (−3.82 ± 1.32) × 108 | (3.17 ± 1.86) × 104 |
Given it has been demonstrated that sapB with bound CoQ10 has been observed in human urine22 and that sapB can regulate CoQ10 levels in the cell,23 the fact that we have observed significant CQ binding by sapB, albeit weaker compared to CoQ10, is consistent with our hypothesis that sapB might play a role in removing CQ from the body and in controlling CQ levels in the cell.
In summary, our results demonstrate CQ is bound by sapB at pH 5.5 and 7.4 with an average binding affinity of Ka = 2.3 × 10⁴ M−1.
In addition to providing the first complete crystal structure of sapB with a bound substrate (a partial sapB:Lipid structure has been reported by Ahn et al.)24 our study provides further evidence of the substrate multispecificity of sapB, now having been shown to bind a range of substrates from lipid17 to CoQ1020 to drugs such as atovaquone20 and now CQ. The implications of the work are two-fold: (1) that sapB may play a role in mitigating CQ based toxicity and (2) that sapB may itself be ‘overwhelmed’ by CQ, especially over prolonged periods of time and depending on dose administered, with the consequence being impaired lipid degradation. CQ has already been show to impair autophagic protein degradation,25 so the questions of whether lipid build-up occurs (over prolonged use) is an intriguing one. Moving forward we will conduct extensive mutagenesis to explore the importance of select residues lining the active site and determine their roles in both binding and substrate selectivity. This work also suggests the possibility that sapB:CQ may be found in urine of patients taking CQ, and we are actively engaged in pursing this question. Finally, experiments to investigate whether sapB can actually change/control CQ levels and whether lipid build-up occurs in human cells will also be explored.
Supplementary Material
Figure 1.
Structure of chloroquine.
Acknowledgments
Funding was provided in part by the CNRS/INSERM ATIP-Avenir program to CZ.
Footnotes
Supporting information for this article is given via a link at the end of the document
Experimental Section
Supplementary Information (ESI) available: [Cloning, protein expression and purification, crystallization and structure determination details].
References
- 1.Krafts K, Hempelmann E, Skorska-Stania A. Parasitol Res. 2012;111:1. doi: 10.1007/s00436-012-2886-x. [DOI] [PubMed] [Google Scholar]
- 2.Meeran K, Jacobs MG. Brit Med J. 1993;307:49. doi: 10.1136/bmj.307.6895.49. [DOI] [PMC free article] [PubMed] [Google Scholar]
- 3.Bernstein HN. Survey of ophthalmology. 1967;12:415. [PubMed] [Google Scholar]
- 4.Bernstein HN. Am J of Med. 1983;75:25. doi: 10.1016/0002-9343(83)91267-6. [DOI] [PubMed] [Google Scholar]
- 5.de Carvalho AC, Schwarz M, Souza Gda S, Gomes BD, Rosa AA, Ventura AM, de Souza JM, Silveira LC, Kremers J. J Ophthal & Vis Res. 2013;8:193. [PMC free article] [PubMed] [Google Scholar]
- 6.Saude BMd SF. Manual de terapeutica da malaria. 6th. Brasil: Ministerio da Saude; 2001. [Google Scholar]
- 7.Queen HF, Tapfumaneyi C, Lewis RJ. Tropical doctor. 1999;29:139. doi: 10.1177/004947559902900305. [DOI] [PubMed] [Google Scholar]
- 8.Nhachi CF, Habane T, Satumba P, Kasilo OM. Human & experimental toxicology. 1992;11:329. doi: 10.1177/096032719201100505. [DOI] [PubMed] [Google Scholar]
- 9.Kiel FW. JAMA. 1964;190:398. doi: 10.1001/jama.1964.03070170139030. [DOI] [PubMed] [Google Scholar]
- 10.Wilkey IS. The Medical journal of Australia. 1973;1:396–397. doi: 10.5694/j.1326-5377.1973.tb118066.x. [DOI] [PubMed] [Google Scholar]
- 11.Bezerra ELM, Vilar MJP, da Trindade Neto PB. Arthritis & Rheumatism. 2005;52:3073. doi: 10.1002/art.21358. [DOI] [PubMed] [Google Scholar]
- 12.Thome R, Lopes SC, Costa FT, Verinaud L. Immun Lett. 2013;153:50. doi: 10.1016/j.imlet.2013.07.004. [DOI] [PubMed] [Google Scholar]
- 13.Taherian E, Rao A, Malemud CJ, Askari AD. Curr Rheumatol Rev. 2013;9:45. doi: 10.2174/1573397111309010010. [DOI] [PubMed] [Google Scholar]
- 14.Lv X, Liu F, Shang Y, Chen SZ. Oncol Rep. 2015;34:1289. doi: 10.3892/or.2015.4091. [DOI] [PubMed] [Google Scholar]
- 15.Homewood CA, Warhurst DC, Peters W, Baggaley VC. Nature. 1972;235:50. doi: 10.1038/235050a0. [DOI] [PubMed] [Google Scholar]
- 16.Kishimoto Y, Hiraiwa M, O’Brien JS. J of Lipid Res. 1992;33:1255. [PubMed] [Google Scholar]
- 17.Li SC, Sonnino S, Tettamanti G, Li YT. J of Biol Chem. 1988;263:6588. [PubMed] [Google Scholar]
- 18.Inui K, Emmett M, Wenger DA. Proc Natl Acad Sci (USA) 1983;80:3074. doi: 10.1073/pnas.80.10.3074. [DOI] [PMC free article] [PubMed] [Google Scholar]
- 19.Inui K, Wenger DA. Arch Biochem Biophys. 1984;233:556. doi: 10.1016/0003-9861(84)90479-x. [DOI] [PubMed] [Google Scholar]
- 20.Huta BP, Roberts AM, Waters ES, Yu VY, Mehlenbacher MR, Bou-Abdallah F, Doyle RP. Med Chem Commun. 2014;5:787. [Google Scholar]
- 21.Dixson DD, Yu VY, Doyle RP. Anal Biochem. 2011;419:145. doi: 10.1016/j.ab.2011.08.042. [DOI] [PubMed] [Google Scholar]
- 22.Jin G, Kubo H, Hashiba M, Horinouchi R, Hasegawa M, Suzuki M, Sagawa T, Oizumi M, Fujisawa A, Tsukamoto H, Oshimura S, Yamamoto Y. J Clin Biochem Nutr. 2008;42:167. doi: 10.3164/jcbn.2008024. [DOI] [PMC free article] [PubMed] [Google Scholar]
- 23.Kashibam M, Oizumi M, Suzuki M, Sawamura Y, Nagashima K, Yoshimura S, Yamamoto Y. J Clin Biochem Nutr. 2014;55:85. doi: 10.3164/jcbn.13-106. [DOI] [PMC free article] [PubMed] [Google Scholar]
- 24.Ahn VE, Leyko P, Alattia J-R, Chen L, Prive GG. Protein Sci. 2006;15:1849. doi: 10.1110/ps.062256606. [DOI] [PMC free article] [PubMed] [Google Scholar]
- 25.Glaumann H, Ahlberg J. Exp Mol Pathol. 1987;47:346. doi: 10.1016/0014-4800(87)90018-9. [DOI] [PubMed] [Google Scholar]
Associated Data
This section collects any data citations, data availability statements, or supplementary materials included in this article.


