Abstract
Cerenkov luminescence imaging (CLI) has been shown to have potential to image β+and β−emitting radioisotopes. This paper addresses the ability to use CLI to image 5 α-emitters that have therapeutic potential. While none of the α-particles have a sufficient velocity to directly produce Cerenkov light, all isotopes considered either have a second decay mode that produces Cerenkov or progeny that do. Monte Carlo studies show that 225Ac, 213Bi, and 212Bi can be easily imaged with CLI while 230U and 211At produce little light. Time effects are observed that must be taken into account when imaging these isotopes, which are not present with β±-emitters like 18F.
Keywords: Cerenkov, 225Ac, Radioimmunoimaging, Radionuclide Therapy, Radiopharmaceuticals
1. Introduction
Nuclear medicine uses radioisotopes for both imaging and therapy; however, these different tasks often require different isotopes. Imaging can be done with probes labeled with a positron (β+) emitter (through PET) or a γ-emitter (through SPECT). Many promising therapeutic agents are β−or α-emitters that cannot be directly imaged with PET or SPECT. When developing drugs for targeted radioimmunotherapy it is beneficial to image biodistribution and uptake, but this currently requires modification of the drug for imaging.
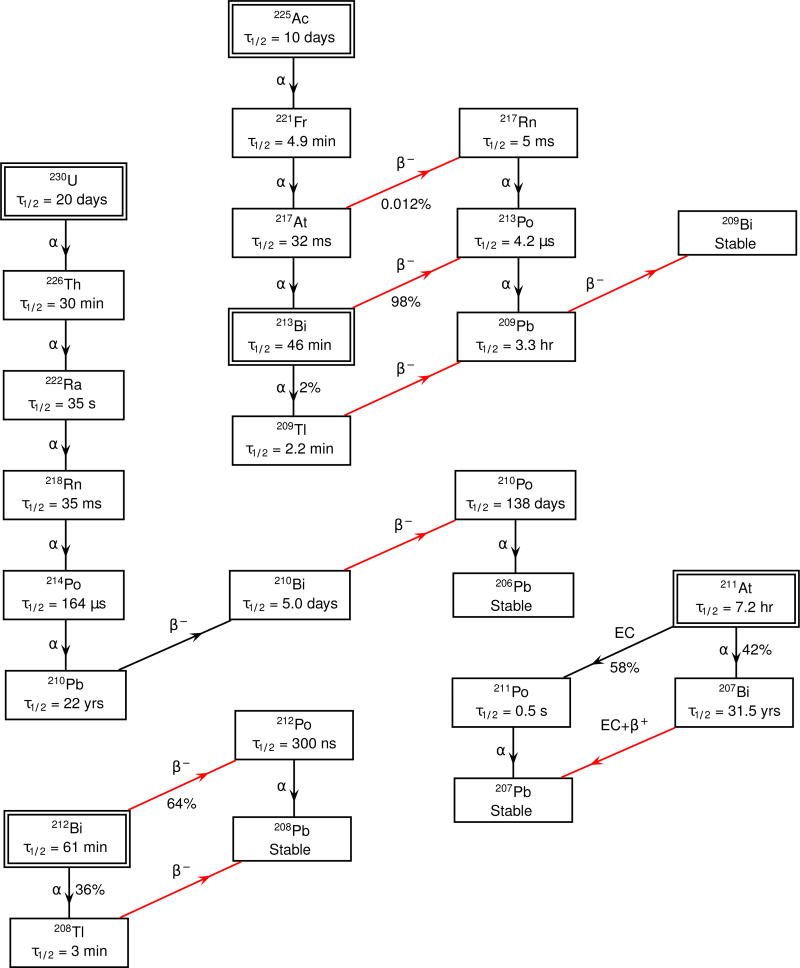
Targeted α-emitting isotopes have great therapeutic benefit due to the limited path length and high linear energy transfer of the α-particle, as compared to electrons (Mulford et al., 2005). Possible isotopes include 212Bi, 213Bi, 211At, 225Ac, and 230U (Holland et al., 2010). Part of the appeal of 230U and 225Ac are the multiple α-particles emitted from one initial decay (see the decay chains in figure 1). However, a limitation of alpha particle-based radiopharmaceuticals is that their emissions cannot be directly imaged using conventional nuclear medicine imaging methods.
Figure 1.
Decay chains of considered isotopes. Double boxed isotopes are the starting points. Red lines indicate pathways that directly produce Cerenkov light.
Optical imaging has gained popularity in pre-clinical models due to the versatility of fluorescent and bio-luminescent probes. Optical imaging equipment is more widely available than nuclear imaging equipment but typically cannot image therapeutic agents without modifying the drug to have an imaging label. Optical methods typically have shorter imaging times than nuclear imaging. However, the spatial resolution and fidelity of optical imaging is limited by the light scattering properties of tissue. In its simplest form, in vivo optical images are two-dimensional and have lower resolution than PET, but still produce useful quantitative information.
However, recently attention has been given to a mechanism by which radioactive decay can produce visible light suitable for optical imaging. Cerenkov radiation is a well-understood electromagnetic effect that occurs when a charged particle travels through a dielectric medium at a speed (υ) greater than the speed at which light can travel in that medium (c/n), where n is the index of refraction of the material. Many β+and β−emitters have been shown to produce Cerenkov light due to the emitted particles having an energy sufficient for υ > c/n. This threshold is 263 keV for electrons and positrons in water. The intensity of Cerenkov radiation follows a 1/λ spectrum in the visible portion of the electromagnetic spectrum, which gives it a characteristic blueness. The spectral shape does not vary with any property of the decay or particle, rendering it not possible to distinguish between sources of Cerenkov light.
Cerenkov Luminescence Imaging (CLI) is an imaging modality that uses existing optical imaging systems, such as the IVIS (Caliper Biosciences, Alameda, CA), to image light produced by the energetic charged particles produced in many nuclear decays (Robertson et al., 2009). Importantly, it has been shown that CLI provides quantitative data that correlates with PET (Ruggiero et al., 2010) and SPECT (Hu et al., 2010). While the measured optical data is two-dimensional, source depth can be inferred through spectral data (Spinelli et al., 2010) and techniques have been developed to perform tomographic 3D reconstruction using homogeneous models (Li et al., 2010) or heterogeneous models (Zhong et al., 2011). The blue-dominated Cerenkov spectrum is subject to significant scattering in tissue, but it possible to use the Cerenkov light to excitep fluorophores, such as quantum dots, that subsequently give off light in wavelengths less subject to scattering (Liu et al., 2010b). Recent work has shown that fluorophores can also be excitepd by Cerenkov light produced by external beam radiation (Axelsson et al., 2011). While applications of CLI have not yet been fully explored, one of the clear applications is in pre-clinical imaging of isotopes that were previously not detectable by common imaging methods (Liu et al., 2010a).
The only α-emitting isotope known to the authors that has been imaged via CLI is 225Ac, which was shown to have significant light output that matched the expected Cerenkov spectrum (Ruggiero et al., 2010). 225Ac has been shown to be effective at killing cancer cells (McDevitt et al., 2001) and clinical trials are ongoing with targeted 225Ac agents (Rosenblat et al., 2007). While 225Ac cannot be imaged via SPECT or PET, the daughters 221Fr and 213Bi have γ-ray lines at 218 keV and 440 keV (respectively). These lines allow for ex vivo γ-spectroscopy and SPECT imaging, although the 213Bi line is too energetic for some detectors (Woodward et al., 2011). CLI could provide increased accessibility and decreased scan times for this isotope, as well as for other alpha-emitters for which imaging strategies have not yet been developed..
For an α-particle to produce Cerenkov light it must have a kinetic energy far greater than typical decay energies due to its larger mass. This can be found from relativistic kinematics as shown in (1).
| (1) |
For water, with n = 1.33, the kinetic energy needed for an α-particle to have a high enough velocity is 1926 MeV and for tissue with n = 1.382 it is 1673 MeV. The energy available in α-decay is typically a few MeV, so α-particles produced from decay will not directly produce Cerenkov light. How else could Cerenkov light be produced? The α-particle ionizes electrons. However, the maximum energy of these electrons for elastic collisions with MeV-scale α-particles is not near the Cerenkov threshold of 263 keV. Additionally, γ-rays can Compton scatter, producing free electrons. Many decays of these α-emitting isotopes and their progeny produce γ-rays with many hundreds of keV of energy, so they are able to produce electrons above the Cerenkov threshold. This process produces only a small amount of Cerenkov light.
In this paper we demonstrate that the Cerenkov light detected from 225Ac is from daughter isotopes that decay through β-decay. We study the potential to image 4 other α-emitting isotopes with CLI. Monte Carlo methods will be used to predict Cerenkov light production during the decay processes. This approach allows us to predict the temporal de-coupling between the decay of the initial isotope and the Cerenkov production. We conclude that 3 of the α-emitting isotopes produce sufficient Cerenkov light to be imaged on time scales relevant to imaging studies.
2. Materials and Methods
2.1. Monte Carlo of Cerenkov Photon Yield
Cerenkov photon production was simulated using the Geant4 toolkit, version 4.09.03.p.02 (Agostinelli et al., 2003). Geant4 is a C++ based Monte Carlo simulation toolkit that was developed for high energy physics but has recently been used in the medical community (Allison et al., 2006). The toolkit offers great flexibility in geometry, data collection, and physics models. Generation of optical photons through the Cerenkov effect is a built in physics phenomenon, however, the user must define the optical properties of the materials used. The refractive index of water for the wavelengths 400 nm to 700 nm were taken from published tables (Hale and Querry, 1973).
Part of the advantage of Geant4 is the ability to choose physics models. The Penelope low energy electromagnetic models were used for Rayleigh scattering, photoelectric effect, Compton scattering, conversion, bremmstrahlung, and e±-ionization. The Cerenkov production process was enabled for all charged particles. α-particles also had elastic and inelastic hadronic processes enabled, multiple scattering via the hMultipleScattering process, and ionization through hLowEnergyIonisation. The default production cut for particles was 10 µm, with 10 nm for α-particles and ions. For electrons this corresponds to a production threshold of about 14 keV in water, well below the Cerenkov threshold. Adequate modeling of the low energy electromagnetic processes is important because the rate of production of Cerenkov photons is tied to the energy of the particle along its entire path (Mitchell et al., 2010). By using the low energy processes and a small step size the energy loss of the primary and secondary particles should be well modeled, including the point at which the energy is no longer above Cerenkov production.
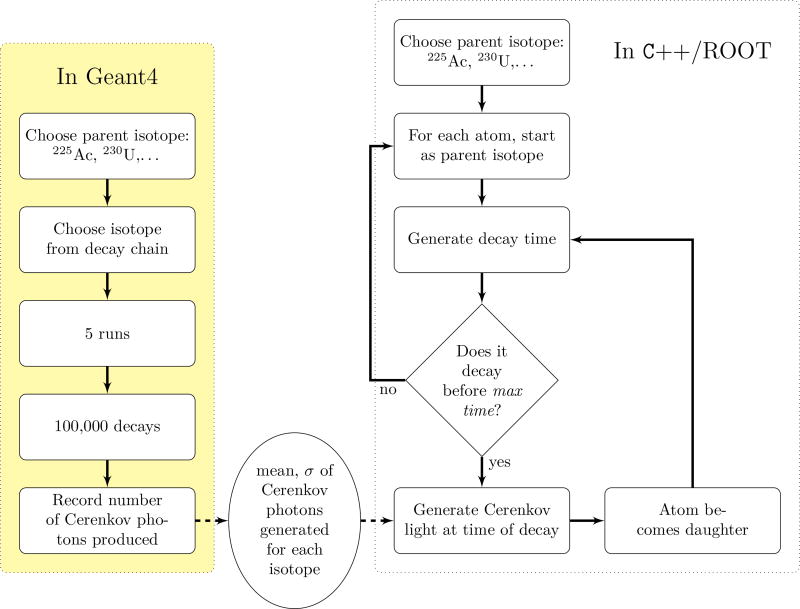
Decays were generated at the center of a cube of water 5 cm on each side. For each isotope in the decay chain, 5 runs of 100,000 events were performed. In order to quantify the light production of only one decay stage, no subsequent radioactive decays were allowed for each event. Geant4 generated the decays based on branching fraction and energy information from the ENSDF database, including decays to excitepd levels and the de-excitation γ-rays produced. The Cerenkov photons from the primary decay products and secondary products (such as electrons from ionization and Compton interactions) were recorded. The mean and standard deviation of this set were then used in the decay Monte Carlo. Note that the standard deviations are larger than Poisson errors due to the random variations in decay mode, decay energy, and subsequent interactions.
2.2. Monte Carlo Decay Studies
Monte Carlo studies were developed in C++ utilizing the ROOT toolkit, v 5.18/00b (Brun and Rademakers, 1997). Individual atoms were processed through the decay chain by randomly choosing a decay time according to the half-life of the element (Tuli, 1996). The chains used are shown in figure 1. If the isotope had two possible decays the path was randomly chosen according to the branching ratio. For every decay Cerenkov photons were generated. Using the mean and standard deviation from the Geant4 Monte Carlo simulation (as shown in figure 2) a Gaussian distribution was created representing the number of decays expected for 106decays of that isotope. A number was randomly chosen from this distribution and divided by 106to represent the number of photons for this given decay. There were two times recorded for these photons: the ‘global’ time from the start of the simulation and the time since the original isotope (ie, 225Ac) had decayed. The later will be referred to as the separation time. The Cerenkov production is normalized to the activity of the original isotope at the time, resulting in the units of Cerenkov photons per second per Becquerel. Because Becquerels are decays per second, this photon rate per decay rate is equivalent to photons per decay.
Figure 2.
The Monte Carlo simulation had two stages. We used Geant4 to establish the Cerenkov photon production for each isotope. Then we generated the time dependence of the Cerenkov production for the entire decay chain, using the information from the first step.
All reported rates are the production rate of Cerenkov photons between 400 nm and 700 nm. The surface radiance measured in an optical device will additionally depend on the geometry of the set up and the quantum efficiency of the camera. Such factors do not vary from one isotope to another. Hence, the ratio of Cerenkov photon production between two isotopes should be maintained when measuring surface radiance. 18F is used as a benchmark in this study since it is the most studied isotope with CLI.
3. Results
3.1. Photon Production of Individual Isotopes
Table 1 lists the mean and standard deviation of Cerenkov photons produced through 5 runs of 100,000 decays of the α-emitting isotopes and their progeny. Each entry represents the Cerenkov light produced by that isotope alone without subsequent decays. The greatest number of Cerenkov photons are produced by high energy β-decay processes, with an average of over 30 Cerenkov photons produced per decay of 207Tl and 209Tl. Note that while 210Pb decays through β−-emission, the maximum energy is far below the Cerenkov threshold. The isotopes that only decay through α-emission show very low Cerenkov photon production. Querying the Geant4 data shows that this is due to nuclear de-excitation γ-rays Compton scattering and periodically producing electrons above the Cerenkov threshold. 211Po exhibits the highest Cerenkov photon count of the α-emitting isotopes due to its 1% branching fraction to excitepd states of 207Pb which emit γ-rays with more than 500 keV of energy. The probability that these γ-rays will Compton scatter depends on the volume, that is, the greater the path the γ travels in water, the higher the probability it will produce an electron.
Table 1.
Number of Cerenkov Photons generated for 100,000 decays of the given isotope. Displayed values are mean and standard deviation taken from 5 simulations of 100,000 events.
| 225Ac Decay Chain | 230U Decay Chain | 211At Decay Chain | |||
|---|---|---|---|---|---|
| 225Ac | 57.4±20.6 | 230U | 3.2±7.2 | 211At | 125.8±19.3 |
| 221Fr | 13.2±5.6 | 226Th | 2.8±4.1 | 211Po | 870.2±85.5 |
| 217At | 28.0±23.5 | 222Ra | 17.6±19.9 | 207Bi | 583,482.0±6902.1 |
| 217Rn | 0±0 | 218Rn | 24.8±8.2 | 212Bi Decay Chain | |
| 213Bi* | 1,107,725.8±1889.3 | 214Po | 5.0±7.1 |
|
|
| 209Tl | 3,616,482.4±7763.8 | 210Pb | 0±0 | 212Bi | 2,430,437.2±7403.2 |
| 213Po | 0±0 | 210Bi | 816,719.4±6327.1 | 208Tl | 3,475,761.0±11,864.1 |
| 209Pb | 83,270.4±529.6 | 210Po | 0±0 | 212Po | 9.6±19.9 |
213Bi and below are also the 213Bi decay chain.
While it is not a progeny of one of the α-emitting isotopes under consideration, 18F was also simulated. The simulations resulted in 131,110.4 ± 676.5 Cerenkov photons per 100,000 decays. This is lower than some of the other β-emitting decays due to the low energy available in 18F decays, however, it is two orders of magnitude or more greater than the isotopes that only decay through α-emission.
3.2. Decay Chain Photon Production
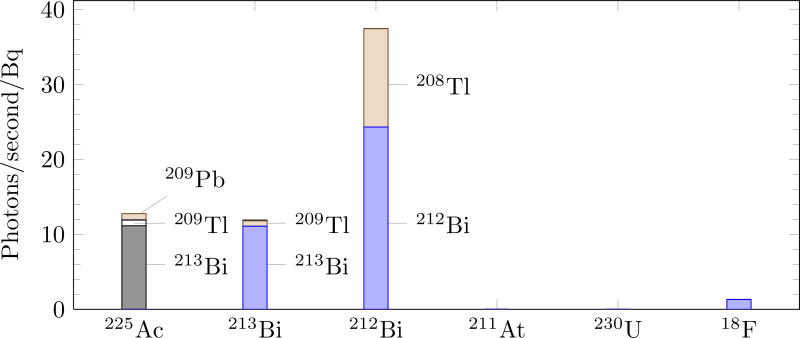
Figure 3 shows the number of Cerenkov photons per second emitted per Becquerel of parent isotope. The measurement was made during the first half of the α-emitting isotopes’ half-life, excluding any non-equilibrium time (discussed in section 3.3). Each isotope has been divided into the predominant sources of Cerenkov light. The contributions of some isotopes, such as 209Tl, is suppressed through the low branching fraction. Others, such as 207Bi, are limited by a long half-life. The rate of Cerenkov light production for both 230U and 211At is more 2 order of magnitude less than 18F.
Figure 3.
Average Cerenkov production for the six isotopes as predicted by Monte Carlo. Dominant sources of Cerenkov photons are annotated. Cerenkov production by 211At and 230U are 2 orders of magnitude less than 18F.
3.3. Cerenkov Production Equilibrium
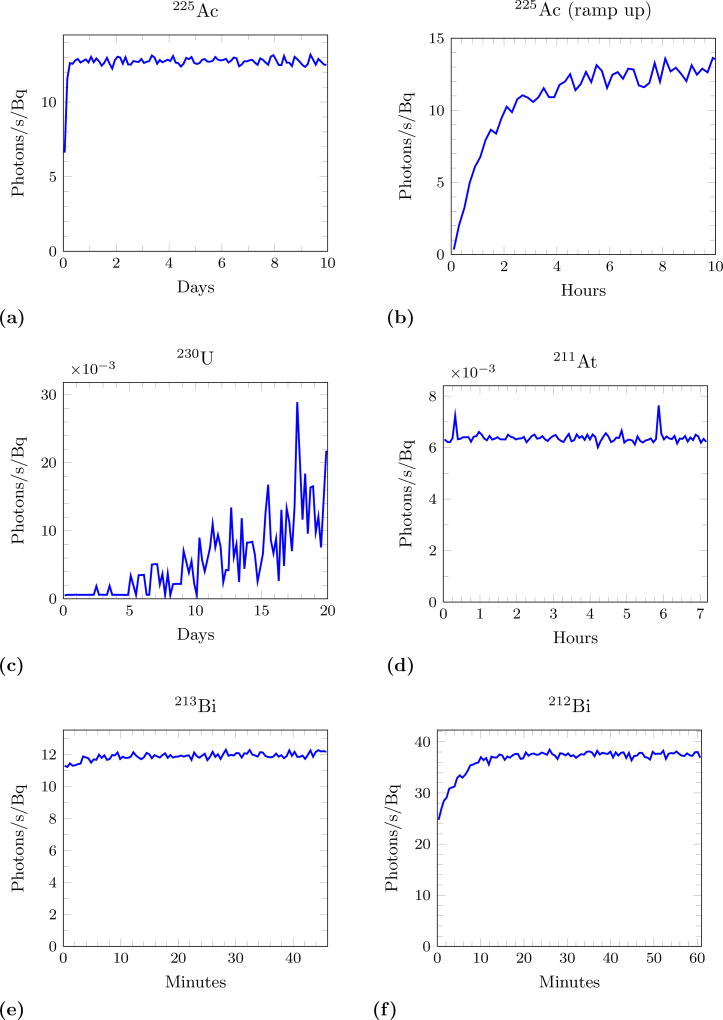
For Cerenkov Luminescence Imaging to be quantitatively useful for α-emitters the measured light output must be proportional to the activity contained in a volume as it is for signals detected by PET and SPECT. Some of the decay chains exhibit a period of time where Cerenkov production increases before it remains proportional to the activity of the original isotope. Figure 4 shows this behaviour in the isotopes of interest. This time represents a ‘global’ time, the measurement beginning with a pure sample of the parent α-emitter. For 225Ac there is a non-equilibrium period of about 10 hours, which is small compared to the half life of 10 days. 230U does not reach equilibrium within its half life of 20 days. 211At appears to be in equilibrium from the beginning, although it is populating the long-lived 207Bi state. Note that the spikes in photons are due to sporadic decays of 207Bi, which has a half life of 31.5 years. 213Bi has only a slight change in photon rate. For 212Bi the production begins at about 25 photons/second/Bq and reaches equilibrium of 38 photons/second/Bq within 12 minutes.
Figure 4.
Cerenkov photon production rate (normalized to activity) as a function of time from a pure sample. (a) and (b) shows two different time periods for 225Ac. Note the x-axis varies in scale to account for the different half-lives of the isotopes and that the y-axis of (c) and (d) has a factor of 10−3.
3.4. Time Separation Between Initial Decay and Cerenkov Production
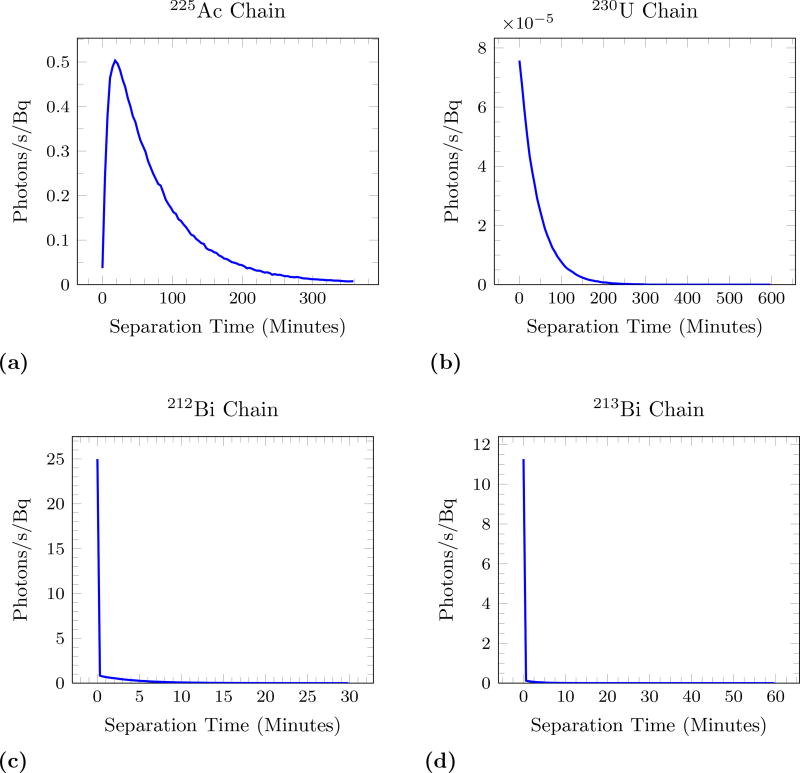
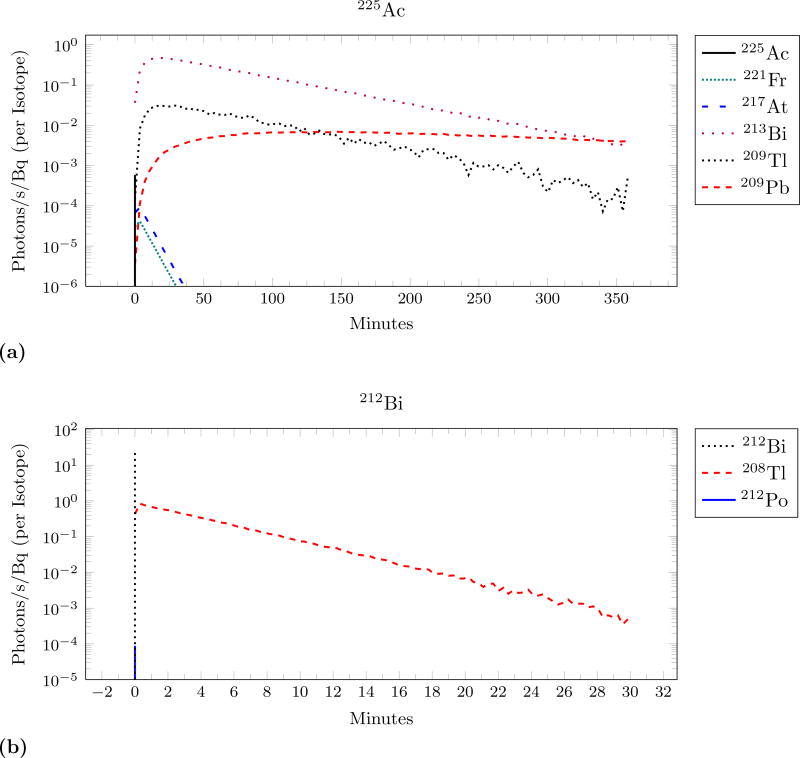
Because Cerenkov light is generated throughout the decay chain there can be a significant delay between the initial decay of the α-emitting parent (such as 225Ac) and the measured light. Figure 5 shows the distribution for 4 of the considered isotopes. Note that this time is different from the previously measured time: a time of zero now corresponds to when a particular α-emitting parent nucleus decayed. The isotopes either have a distribution dominated by prompt Cerenkov or an exponentially falling distribution. The mean time separation is small for the decay chains dominated by the prompt light: 213Bi is 17 seconds and 212Bi is 90 seconds. The other two isotopes have a high mean, with 230U at 40 minutes. Figure 6 shows the isotopic breakdown of two of the isotopes. 225Ac shows a small amount of prompt Cerenkov from the early α-decays but is dominated by the β-decays occurring later in the chain. The mean of this distribution is 76.3 minutes and the peak occurs at 18 minutes. The equivalent distribution for 18F is a delta-function at t=0.
Figure 5.
Separation time for the 4 isotopes that do not only produce prompt light. Separation time represents the time between the initial decay of the parent α-emitter and the subsequent production of Cerenkov light. Note that the y-axis of (b) has a factor of 10−5.
Figure 6.
The different isotopes in the decay chain are responsible for different portions of the time separation. This shows the sources of the distributions from figure 5 parts (a) and (c) on logarithmic y-axis. Vertical lines represent the delta-functions of prompt light occuring at t=0.
4. Discussion
This study demonstrates that Cerenkov luminescence imaging can be used to quantitatively image some α-emitting isotopes as long as certain considerations are minded. 212Bi and 213Bi are considered α-emitters for therapeutic applications but have a sizable branching fraction to β−-decay, allowing them to be imaged via Cerenkov light. 230U and 211At have β±-emitters in their decay chains, but the half-lives of these isotopes result in little Cerenkov light being produced on clinically relevant time scales. 225Ac can be imaged due to the β−-emitters in its decay chain, but the interpretation the imaging data must take into account complicating time effects.
212Bi and 213Bi are almost as simple to image with CLI as 18F. They are considered α-emitters for therapeutic reasons but they are also β−-emitters. These β−-decays lead to direct and prompt production of Cerenkov light when the parent isotope decays. Both prompt decays are highly energetic, producing an order of magnitude more Cerenkov light than 18F does. However, both also have a production mechanism farther down the decay chain that leads to a period of non-equilibrium. For 213Bi this is the population of the 209Tl daughter that only causes a small change in the Cerenkov production. Because the half-life of 213Bi is only 46 minutes, the 209Pb (t1/2=3.3 hours) never reaches equilibrium or contributes a significant amount of Cerenkov light while there is still a reasonable proportion of the parent isotope remaining. 212Bi has a larger contribution of Cerenkov light from its progeny, 208Tl. It takes only about 12 minutes for equilibrium to be reached, so selection of an appropriate imaging time is not difficult. Because the majority of the light is from the parental decay, the time separation is not a major concern. The average delay for 213Bi is about 17 seconds and for 212Bi it is 90 seconds.
This study indicates that 230U and 211At are unsuitable isotopes for CLI. The decay chains of both contain decays that would produce Cerenkov light, but they are blocked by half-lives of tens of years. Within the half-life of the parental isotope itself, Cerenkov light is produced via Compton scattering of nuclear de-excitation γ-rays. This leads to very low levels of light (2 order of magnitude below 18F) and is dependent on the volume of tissue or water present. Additionally, the source of Cerenkov light will then be the position of the Compton scattering and not the site of the original decay. This interaction length is much longer than the mm scale path of a positron before annihilation, so this greatly reduces the resolution of CLI. In addition to the low level of light produced, 230U is a poor choice due to wide time separation between light and original decay (mean of 40 minutes) and not being in a state of equilibrium where Cerenkov light can be used to quantify the activity.
While the decay chain of 225Ac is more similar to 230U than either 212Bi or 213Bi, it it suitable for CLI as long as studies take into account the time effects present. The Cerenkov light is produced by progeny a few steps down in the decay chain, resulting in two effects. There is both a period where Cerenkov light production is not proportional to the quantity of activity present and there is a time delay between the decay of 225Ac and the observation of the subsequent Cerenkov light. The non-equilibrium period will not just be after production of the isotope, but will also occur after filtration stages in radio-chemistry. While the non-equilibrium effect could be observed by making measurements in vitro, the time separation cannot be easily measured since the Cerenkov spectrum does not depend on the energy of the initial particle, rendering it impossible to distinguish the Cerenkov photons coming from early in the decay chain from those produced at the end.
Both of these time effects must be taken into account when designing and analyzing CLI data in vivo. The greatest value of CLI is in reporting the location of a radiolabeled compound in a subject. Since the Cerenkov light is coming from daughter isotopes and not from the initial decay, CLI data will be reporting on the location of the daughter isotopes. This is not necessarily the location of the compound that had been labeled with the α-emitter, which reduces the resolution already limited by optical scattering. Researchers must carefully consider the fate of the daughter isotopes through the entire chain to 209Bi. If the daughter isotopes remain in the same location (with respect to the spatial resolution of the study) as the radiolabeled compound this is less of a concern. A simple chelation of a targeting probe to 225Ac will result in the 221Fr daughter no longer being attached to the target of interest due to the high recoil energy of the 221Fr nucleus. This effect has already been explored with the intention of keeping the α-emitting daughters at the target location through cellular internalization (McDevitt et al., 2001), liposomal carriers(Sofou et al., 2004), and nanoparticle delivery methods (Woodward et al., 2011). If the β-emitting daughters are not conjugated to the target molecule after the initial α-decay they may circulate freely before decaying and producing Cerenkov light. The amount of time this circulation would occur is described by the distribution in figure 5, resulting in an average circulation time of 76 minutes for 225Ac. Consequently, the Cerenkov light being imaged describes the bio-distribution of these secondary isotopes and provides little information on the effectiveness of the targeting mechanism. This will decrease the signal from the location of interest, increase the background, and potentially hide binding sites outside the location of interest. Sequestration of the daughters would eliminate this effect (and have other benefits (Miederer et al., 2008)).
Conclusion
Monte Carlo studies show that 212Bi and 213Bi can be directly imaged and quantified via CLI, while 225Ac can be imaged indirectly through its daughters. This has the potential to accelerate the screening of targeted α-emitters in pre-clinical models, or to apply CLI clinically to monitor the distribution of radiopharmaceuticals. To our knowledge no in vivo Cerenkov imaging has been done of α-emitting isotopes. We have shown that the results of these studies must be interpreted carefully due to time delays between the initial decay and the subsequent Cerenkov production.
Acknowledgments
NLA is supported by the Weiland Family Fellowship administered through the Stanford Graduate Fellowships.
References
- Agostinelli S, Allison J, Amako K, Apostolakis J, Araujo H, Arce P, Asai M, Axen D, Banerjee S, Barrand G, et al. G4–a simulation toolkit. Nuclear Instruments and Methods in Physics Research Section A: Accelerators, Spectrometers, Detectors and Associated Equipment. 2003;506:250–303. [Google Scholar]
- Allison J, Amako K, Apostolakis J, Araujo H, Dubois P, Asai M, Barrand G, Capra R, Chauvie S, Chytracek R, et al. Geant4 developments and applications. Nuclear Science, IEEE Transactions on. 2006;53:270–278. [Google Scholar]
- Axelsson J, Davis SC, Gladstone DJ, Pogue BW. Cerenkov emission induced by external beam radiation stimulates molecular fluorescence. Medical Physics. 2011;38:4127. doi: 10.1118/1.3592646. [DOI] [PMC free article] [PubMed] [Google Scholar]
- Brun R, Rademakers F. ROOT: An object oriented data analysis framework. Nucl. Instrum. Meth. 1997;A389:81–86. [Google Scholar]
- Hale GM, Querry MR, et al. Optical constants of water in the 200-nm to 200-um wavelength region. Appl. Opt. 1973;12:555–563. doi: 10.1364/AO.12.000555. [DOI] [PubMed] [Google Scholar]
- Holland JP, Williamson MJ, Lewis JS. Unconventional nuclides for radiopharmaceuticals. Molecular Imaging. 2010;9:1–20. [PMC free article] [PubMed] [Google Scholar]
- Hu Z, Liang J, Yang W, Fan W, Li C, Ma X, Chen X, Ma X, Li X, Qu X, et al. Experimental cerenkov luminescence tomography of the mouse model with SPECT imaging validation. Optics Express. 2010;18:24441–24450. doi: 10.1364/OE.18.024441. [DOI] [PubMed] [Google Scholar]
- Li C, Mitchell GS, Cherry SR. Cerenkov luminescence tomography for small-animal imaging. Optics Letters. 2010;35:1109–1111. doi: 10.1364/OL.35.001109. [DOI] [PMC free article] [PubMed] [Google Scholar]
- Liu H, Ren G, Miao Z, Zhang X, Tang X, Han P, Gambhir SS, Cheng Z. Molecular optical imaging with radioactive probes. PLoS ONE. 2010a;5:e9470. doi: 10.1371/journal.pone.0009470. [DOI] [PMC free article] [PubMed] [Google Scholar]
- Liu H, Zhang X, Xing B, Han P, Gambhir SS, Cheng Z. Radiation-Luminescence-Excited quantum dots for in vivo multiplexed optical imaging. Small. 2010b;6:1087–1091. doi: 10.1002/smll.200902408. [DOI] [PubMed] [Google Scholar]
- McDevitt MR, Ma D, Lai LT, Simon J, Borchardt P, Frank RK, Wu K, Pellegrini V, Curcio MJ, Miederer M, et al. Tumor therapy with targeted atomic nanogenerators. Science. 2001;294:1537–1540. doi: 10.1126/science.1064126. [DOI] [PubMed] [Google Scholar]
- Miederer M, Scheinberg DA, McDevitt MR. Realizing the potential of the actinium-225 radionuclide generator in targeted alpha particle therapy applications. Advanced Drug Delivery Reviews. 2008;60:1371–1382. doi: 10.1016/j.addr.2008.04.009. [DOI] [PMC free article] [PubMed] [Google Scholar]
- Mitchell GS, Gill RK, Cherry SR. Comments on ’cerenkov radiation allows in vivo optical imaging of positron emitting radiotracers’. Physics in Medicine and Biology. 2010;55:L43. doi: 10.1088/0031-9155/55/18/L01. [DOI] [PubMed] [Google Scholar]
- Mulford DA, Scheinberg DA, Jurcic JG. The promise of targeted alpha-Particle therapy. J Nucl Med. 2005;46:199S–204. [PubMed] [Google Scholar]
- Robertson R, Germanos MS, Li C, Mitchell GS, Cherry SR, Silva MD. Optical imaging of cerenkov light generation from positron-emitting radiotracers. Physics in Medicine and Biology. 2009;54:N355–365. doi: 10.1088/0031-9155/54/16/N01. [DOI] [PMC free article] [PubMed] [Google Scholar]
- Rosenblat TL, McDevitt MR, Pandit-Taskar N, Carrasquillo JA, Chanel S, Frattini MG, Larson SM, Scheinberg DA, Jurcic JG. Phase i trial of the targeted alpha-particle nano-generator actinium-225 (225ac)-hum195 (anti-cd33) in acute myeloid leukemia (aml) ASH Annual Meeting Abstracts. 2007;110:910. [Google Scholar]
- Ruggiero A, Holland JP, Lewis JS, Grimm J. Cerenkov luminescence imaging of medical isotopes. Journal of Nuclear Medicine: Official Publication, Society of Nuclear Medicine. 2010;51:1123–1130. doi: 10.2967/jnumed.110.076521. [DOI] [PMC free article] [PubMed] [Google Scholar]
- Sofou S, Thomas JL, yin Lin H, McDevitt MR, Scheinberg DA, Sgouros G. Engineered liposomes for potential alpha-particle therapy of metastatic cancer. Journal of Nuclear Medicine: Official Publication, Society of Nuclear Medicine. 2004;45:253–260. [PubMed] [Google Scholar]
- Spinelli AE, D’Ambrosio D, Calderan L, Marengo M, Sbarbati A, Boschi F. Cerenkov radiation allows in vivo optical imaging of positron emitting radiotracers. Physics in Medicine and Biology. 2010;55:483–495. doi: 10.1088/0031-9155/55/2/010. [DOI] [PubMed] [Google Scholar]
- Tuli JK. Evaluated nuclear structure data file. Nuclear Instruments and Methods in Physics Research Section A: Accelerators, Spectrometers, Detectors and Associated Equipment. 1996;369:506–510. [Google Scholar]
- Woodward J, Kennel SJ, Stuckey A, Osborne D, Wall J, Rondinone AJ, Standaert RF, Mirzadeh S. LaPO(4) nanoparticles doped with actinium-225 that partially sequester daughter radionuclides. Bioconjugate Chemistry. 2011 doi: 10.1021/bc100574f. [DOI] [PubMed] [Google Scholar]
- Zhong J, Qin C, Yang X, Zhu S, Zhang X, Tian J. Cerenkov luminescence tomography for in vivo radiopharmaceutical imaging. International Journal of Biomedical Imaging. 2011;2011:1–6. doi: 10.1155/2011/641618. [DOI] [PMC free article] [PubMed] [Google Scholar]


