

Abstract
Zebrafish morphants of osm-3/kif17, a kinesin-2 family member and intraflagellar transport motor, have photoreceptor outer segments that are dramatically reduced in number and size. However, two genetic mutant lines, osm-3/kif17sa0119 and osm-3/kif17sa18340, reportedly lack any observable morphological outer segment defects. In this work, we use TALENs to generate an independent allele, osm-3/kif17mw405, and show that both osm-3/kif17sa0119 and osm-3/kif17mw405 have an outer segment developmental delay in both size and density that is fully recovered by 6 days post-fertilization. Additionally, we use CRISPRs to generate cos2/kif7mw406, a mutation in the kinesin-4 family member cos2/kif7 that has been implicated in controlling ciliary architecture and Hedgehog signaling to test whether it may be functioning redundantly with osm-3/kif17. We show that cos2/kif7mw406 has an outer segment developmental delay similar to the osm-3/kif17 mutants. Using a three-dimensional mathematical model of outer segments, we show that while cos2/kif7mw406 and osm-3/kif17mw405 outer segments are smaller throughout the first 6 days of development, the volumetric rates of outer segment morphogenesis are not different among wild-type, cos2/kif7mw406, and osm-3/kif17mw405 after 60hpf. Instead, our model suggests that cos2/kif7mw406 and osm-3/kif17mw405 impact outer segment morphogenesis through upstream events that that are different for each motor. In the case of cos2/kif7mw406 mutants, we show that early defects in Hedgehog signaling lead to a general, non-photoreceptor-specific delay of retinal neurogenesis, which in turn causes the secondary phenotype of delayed outer segment morphogenesis. In contrast, the osm-3/kif17mw405 outer segment morphogenesis delays are linked specifically to initial disc morphogenesis of photoreceptors rather than an upstream event. Further, we show that osm-3/kif17 mutant mice also exhibit a similarly delayed outer segment development, suggesting a role for osm-3/kif17 in early outer segment development that is conserved across species. In conclusion, we show that both osm-3/kif17 and cos2/kif7 have comparable outer segment developmental delays, although through independent mechanisms.
Keywords: Outer Segment, Kinesin, Intraflagellar Transport, Hedgehog signaling
1. Introduction
Photoreceptor outer segments (OS) are modified sensory cilia containing membranous discs concentrated in phototransductive opsins (Rohlich, 1975). Approximately 10% of the mouse rod OS is shed and phagocytized by the opposing retinal pigment epithelium (RPE) daily (Young, 1967), generating a heavy demand on new protein synthesis and translocation to the OS. Bi-directional intraflagellar transport (IFT) has been implicated in not only delivering cargoes to accommodate this high turnover rate of the OS, but also in initial OS morphogenesis (Pazour et al., 2002). The multisubunit IFT-A and IFT-B complexes are proposed to function as scaffolds between these cargoes and the motors that traffic along microtubules (Cole et al., 1998) (Baker et al., 2003). Retrograde IFT is driven by the minus-end cytoplasmic dynein-2, while two members of the kinesin-2 family, heterotrimeric kinesin-II and homodimeric OSM-3/Kif17, are the plus-end motors that drive anterograde IFT (Cole et al., 1998) (Pazour et al., 1998) (Snow et al., 2004).
With two kinesin motors participating in IFT, there has been recent investigation into the functions of each within the cilia. In Caenorhabditis elegans, kinesin-II and OSM-3/Kif17 function redundantly to transport IFT particles along doublet microtubules in the proximal cilia, while OSM-3/Kif17 alone traffics along the distal singlet microtubules (Snow et al., 2004). While not all cilia contain an axoneme with distal singlet microtubules, the axoneme of the zebrafish OS has been shown to contain singlets (Insinna et al., 2008) suggesting a potential function of OSM-3/Kif17 in OS development. Indeed, OSM-3/Kif17 both localizes (Insinna et al., 2008) and traffics (Bader et al., 2012) along the zebrafish OS axoneme.
However, the specific functions of each kinesin motor within the vertebrate photoreceptor remain confounded. In zebrafish, morpholino-mediated knockdown of osm-3/kif17 led to an apparent ablation of OS (Insinna et al., 2008) indicating dysfunctional morphogenesis, whereas expression of dominant-negative OSM-3/Kif17 led to short OS (Insinna et al., 2009), indicating impairment of OS elongation and disc formation. This appeared to be an OS specific phenomenon, as kidney epithelial cilia developed normally in morphant embryos. In contrast, a line of zebrafish reported to be null for OSM-3/Kif17, osm-3/kif17sa0119, showed no defects in either opsin trafficking or OS morphology in the adult retina (Zhao et al., 2012), and another mutant line, osm-3/kif17sa18340, was found to have no effects on OS morphology at either 3 or 5 days post-fertilization (dpf) (Pooranachandran and Malicki, 2016). Furthermore, adult mice deficient in KIF17 did not exhibit ciliary or photoreceptor related defects (Jiang et al., 2015). These genetic data seemingly demonstrate that OSM-3/Kif17 is not required for the formation of proper cilia or OS in either zebrafish or mice and cast doubt on the original morphant data. Similar discrepancies between morphants and genetic mutants are relatively common in the recent literature (Kok et al., 2015) and could reflect off-target, non-specific effects of morpholinos. More interesting, however, are findings in which morpholinos exhibit specific knockdown effects that are not phenocopied by genetic mutations. For example, genetic mutations in an endothelial extracellular matrix gene, egfl7, were shown to trigger upregulation of a compensatory network that was not seen in morphants, resulting in a recovery of the severe vascular defects observed in egfl7 morphants (Rossi et al., 2015).
Intrigued by the apparent contradiction of morphant and genetic data regarding osm-3/kif17, we set out to quantitatively analyze early photoreceptor morphogenesis in osm-3/kif17 morphants and mutants. We find that morphant knockdown of osm-3/kif17 indeed results in a robust delay of early OS formation, which is also observed in both osm-3/kif17sa0119 and a newly created mutant line, osm-3/kif17mw405. These data indicate that two genetic mutants quantitatively phenocopy the morpholino knockdown, indicating that the OS morphogenesis delays associated loss of osm-3/kif17 are highly specific. Despite this effect on initial development, photoreceptors recover and exhibit morphology indistinguishable from controls by 6 dpf.
To address a potential functional redundancy by another kinesin motor, we used the CRISPR/Cas9 system to create a mutation in cos2/kif7, which has been implicated in regulating ciliary structure (He et al., 2014). Interestingly, cos2/kif7mw406 OS have a remarkably comparable developmental delay in both size and number to osm-3/kif17 mutant OS. We show that after 60hpf, volumetric rates of OS morphogenesis are identical between control, osm-3/kif17mw405, and cos2/kif7mw406 until OS reach an adult, steady-state size, suggesting a role for cos2/kif7 and osm-3/kif17 in either initial ciliogenesis or an event further upstream. Our analysis indicates that cos2/kif7mw406 presumptive photoreceptors, as well as other retinal neurons, are delayed in cell cycle progression, which indirectly leads to delayed OS morphogenesis. This delayed retinal neurogenesis appears to be the result of misregulated Hh signaling much earlier in development. However, in stark contrast, osm-3/kif17mw405 photoreceptors appear to differentiate normally, with no defects in basal body trafficking or initial axonemal elongation. Yet, osm-3/kif17mw405 OS have delayed disc morphogenesis, suggesting a direct role of osm-3/kif17 in initial OS disc formation. Ultimately, we show that although loss of either cos2/kif7 or osm-3/kif17 leads to comparable morphological phenotype, the mechanism underlying those phenotypes are different between the two genes, implying that these two genes are not functionally redundant. Lastly, we show that mice containing a genetic mutation in osm-3/kif17 exhibit a developmental delay in OS formation, suggesting a role of osm-3/kif17 in early OS morphogenesis that is conserved across species.
2. Materials and methods
2.1. Morpholino injection
9.2 nL of a working solution containing 14 ng of an antisense morpholino oligonucleotide (GeneTools) targeting a osm-3/kif17 splice site junction (Insinna et al., 2008) and 0.05% phenol red were injected into ZDR embryos at the 1-cell stage. For controls, an inverted sequence of the osm-3/kif17 splice morpholino was used.
2.2. TALEN generation and injection
Plasmids encoding osm-3/kif17-targeting TALEN arms were designed and ordered from Transposagen. Plasmids were linearized with XmaI and purified with PureLink Quick PCR Purification Kit (Invitrogen). TALEN mRNAs were transcribed from purified, linear plasmids with Ambion mMESSAGE mMACHINE T7 kit (ThermoFisher). Resultant reactions were then treated with DNase and then tailed with the Ambion Poly(A) Tailing Kit (ThermoFisher). The poly(A) tailed mRNAs were purified with Ambion MEGAclear Kit (ThermoFisher). For injection, 9.2 nL of a working solution containing 10 ng/μL of each TALEN arm and 0.05% phenol red was injected into ZDR embryos at the 1-cell stage. Injected fish and their offspring were screened for insertions or deletions in genomic DNA using a restriction digest-based genotyping assay. A 383-bp sequence was amplified with the following genotyping primers:
|
| |
| Primer | Sequence |
|
| |
| osm–3/kif17 genotyping (F) | GCTATAGTCTTCATAGGATGACCATGACAC |
| osm–3/kif17 genotyping (R) | GAGACTCTTACAGTCATGCTAAATCATAC |
|
| |
Within this amplicon, there is a DraI restriction digest site located between the two TALEN arms. Amplicons of wild-type, or unedited DNA, lacked disruption of the DraI digest site and generated bands of 144 bp and 239 bp following digestions. Amplicons of TALEN-edited DNA had disrupted DraI digestion, leading to a single product following digestion of approximately 383-bp (with variation based on the specific insertion or deletion). osm-3/kif17 amplicons positive for TALEN-editing were cloned with the pCR4-TOPO TA Cloning Kit (ThermoFisher) and sequenced (Retrogen).
2.3. CRISPR generation and injection
Two CRISPR target sites were identified in cos2/kif7 by ZiFiT Targeter, and custom oligonucleotides were ligated into pDR274 for CRISPR gRNA expression. Plasmids were then linearized with DraI and purified with PureLink Quick PCR Purification Kit (Invitrogen). gRNA synthesis was performed with the Ambion MEGAshortscript T7 Transcription kit (ThermoFisher) and subsequently purified with Ambion mirVana miRNA Isolation Kit (ThermoFisher). For Cas9 RNA synthesis, pT3TS-nCas9n was linearized with XbaI and purified with PureLink Quick PCR Purification Kit (Invitrogen). Cas9 mRNA was then transcribed from purified, linear plasmid with Ambion mMESSAGE mMACHINE T3 kit (ThermoFisher). The resultant reaction was then treated with DNase and then tailed with the Ambion Poly(A) Tailing Kit (ThermoFisher). For injection, 4.6nL of a working solution containing 12.5 ng/μL of each gRNA and 50 ng/μL of Cas9 mRNA with 0.05% phenol red was injected into ZDR embryos at the 1-cell stage. Injected fish and their offspring were screened for insertions or deletions in genomic DNA using an amplicon size-based genotyping assay. A 201-bp sequence surrounding the two cos2/kif7 CRIPSR target sites was amplified with the following genotyping primers:
|
| |
| Primer | Sequence |
|
| |
| cos2/kif7 genotyping (F) | CCGCTTTTAGGGATGATG |
| cos2/kif7 genotyping (R) | CTACATTCCCTCTTTCGTCC |
|
| |
CRISPR-edited DNA resulted in large insertions or deletions within this amplicon, leading to amplicons significantly different in size than 201-bp. cos2/kif7 amplicons with positive CRISPR-editing were cloned with the pCR4-TOPO TA Cloning Kit (ThermoFisher) and sequenced (Retrogen).
2.4. Osm-3/Kif17 mouse generation and husbandry
The Osm-3/Kif17 mutant mice were generated using targeted C57BL/6N stem cells obtained through EUCOMM. The targeting construct was based on the knockout-first targeting strategy widely used for many genes at EUCOMM (Testa et al., 2004) (Skarnes et al., 2011). In short, the L1L2_Bact_P targeting cassette contains a floxed exon 4 of mouse Osm-3/Kif17 along with an upstream lacZ reporter. Targeted cells purchased from EUCOMM were used to make germ line mice in the Medical College of Wisconsin Transgenic Core. Germ-line mice were mated to C57/BL6J mice and offspring were subsequently crossed to EIIa-Cre mice (Jackson Labs) to generate mice with a heterozygous deletion of exon 4, hereafter termed Osm-3/Kif17t1mb(Bjc). To properly control for age variations, heterozygote matings were performed so that littermate wild-type and Osm-3/Kif17tm1b(Bjc) homozygous mutant mice could be used for all experiments. Mice were genotyped for presence of the targeting cassette using the LAR3 primer or the targeted exon using the Osm-3/Kif17 3′ arm primer as follows:
|
| |
| Primer | Sequence |
|
| |
| Osm–3/Kif17 5′ arm | CCCATAATTCTGCTCTCCCTTCCC |
| Osm–3/Kif17 3′ arm | ATGCAACACTTATTTCATGAGCATGG |
| LAR3 | CAACGGGTTCTTCTGTTAGTCC |
|
| |
A 528-bp sequence is amplified in wild-type mice lacking the targeting cassette, while a 424-bp sequence is amplified in Osm-3/Kif17tm1b(Bjc) mice lacking exon 4. All mice were additionally genotyped and bred to remove the rd8 mutation found in all C57BL/6N mice (Mattapallil et al., 2012). Mice were maintained under 12-hr:12-hr light: dark cycle. All experiments were approved and conducted in accordance with the Institutional Animal Care and Use Committee of the Medical College of Wisconsin.
2.5. Zebrafish husbandry
Adult zebrafish were housed at 28.5 °C on a 14-hr:10-hr light: dark cycle. Embryos were raised at 28.5 °C on a 14-hr:10-hr light: dark cycle. The osm-3/kif17sa0119 mutant line was obtained from the Zebrafish Mutation Resource (Wellcome Trust Sanger Institute). All experiments were approved and conducted in accordance with the Institutional Animal Care and Use Committee of the Medical College of Wisconsin. To ensure no significant effects of background mutations on our analysis, the isolated osm-3/kif17mw405 and cos2/kif7mw406 lines were bred together to generate double heterozygotes. Double heterozygotes were then incrossed to generate wild-type controls, osm-3/kif17mw405 homozygotes, and cos2/kif7mw406 homozygotes. These fish were then bred as the parents of all embryos used for analysis to eliminate maternal contribution as well as reduce background differences between genotypes.
2.6. RNA isolation and qPCR
Zebrafish embryos were collected at specific time points and placed in RNAlater (Ambion) overnight at 4 °C, at which point the RNAlater was removed and five pooled embryos were placed in TRIzol Reagent (Ambion). Following homogenization with a Pellet Pestle (Kontes) for 30 s, RNA was isolated following the TRIzol protocol. Isolated RNA was treated with RNase-free DNase (ThermoFisher). Total RNA was measured using an ND-1000 Nanodrop. cDNA was synthesized using iScript cDNA synthesis kit (Bio-Rad) with 1 μg of total RNA. 1 μL of cDNA was used per reaction with iQ SYBR Green Supermix (Bio-Rad) on a CFX Connect Real-Time System (Bio-Rad). For each sample, five biological replicates consisting of five pooled embryos were run in triplicate. Negative controls lacking cDNA were run in triplicate for each gene. The housekeeping gene ef1α was used for normalization. Primers and efficiencies are depicted below.
|
| ||
| Target gene | Sequence | Efficiency |
|
| ||
| opn1sw1 (F) | GTATACGTTGTGTGCGATGG | 91.6% |
| opn1sw1 (R) | CTCTGAGTTGTACTCCTCGC | |
| opn1sw2 (F) | CTTGGTGTATGGCATTGG | 95.3% |
| opn1sw2 (R) | CAGTCAGGTCCACAAGAG | |
| opn1mw2 (F) | CACGCATGGTCATCCTAATG | 98.9% |
| opn1mw2 (R) | CTGGAGACACAGAGGACAC | |
| opn1lw1 (F) | GAAGGCTACACTGTGTCAG | 93.8% |
| opn1lw1 (R) | CAGGAGAAGATAATGCCAG | |
| rho (F) | GACTACTACACCCGCACTC | 92.6% |
| rho (R) | GGATGAAGAAGTGCACGATG | |
| cos2/kif 7 (F) | CCTGGAAGGAGAGCTGACC | 100.8% |
| cos2/kif 7 (R) | GGAATCCTGAGCACTGCC | |
| ef1α (F) | TCTCTCAATCTTGAAACTTATCAATCA | 102.7% |
| ef1α (R) | AACACCCAGGCGTACTTGAA | |
|
| ||
The mean Cq of the technical triplicate values for samples was used to calculated the 2−dCt between target gene and reference gene ef1α. The 2−dCt values were then averaged for each genotype, and standardized so the wild-type expression level was 1. Samples were not used for analysis if there was any amplification in the negative controls.
2.7. Western blots
3dpf zebrafish embryos or adult mouse testes were homogenized in lysis buffer (50 mM Tris HCl, pH 8.0; 150 mM NaCl, 1% NP-40) supplemented with a protease inhibitor cocktail (Roche). Homogenates were sonicated briefly, centrifuged at 16,000×g for 15 min at 4 °C, and the resulting supernatants were used for biochemical analysis. Protein concentration was determined by standard Bradford assay using Bio-Rad Protein Assay (Bio-Rad). Lysates were fractionated by SDS-PAGE (7.5% Mini-Protean TGX; Bio-Rad) and transferred to Immobilon PVDF membranes (Millipore). Membranes were incubated for 1 h at RT in blocking buffer (Odyssey; Li-Cor). Rabbit anti-mouse KIF17 (Sigma-Aldrich) or Mouse anti-γ-tubulin (GTU-88; Abcam) were diluted in blocking buffer and incubated with membranes at 4 °C overnight. Membranes were incubated with fluorescent secondary antibodies for 1 h at RT. Proteins were detected with an infrared imager (Odyssey; Li-Cor).
2.8. Histology and microscopy
Embryos or enucleated mouse eyes were fixed overnight in either 0.08 M (fish) or 0.10 M (mouse) cacodylate buffer containing 2% glutaraldehyde and 2% paraformaldehyde. Embryos were post-fixed in 1% osmium tetroxide followed by dehydration in a graded methanol series and infusion with epon (Embed 812; Electron Microscopy Systems). 0.5-μm sections were cut on a microtome (Ultracut E, Reichert-Jung) and stained with toluidine blue for light microscopy. Images were acquired on a Nikon Eclipse TE300 microscope operating NIS-Elements (Nikon Instruments) and a CCD camera (CoolSNAP HQ; Roper Scientific). Cryosection analysis was performed as previously described (Insinna et al., 2008). Nuclei were stained with TO-PRO-3 (Invitrogen). Images were acquired on a Nikon C1 Plus-EX3 AOM Confocal System using the Nikon EZ-C1 software with a 60x, 1.4-NA objective (Nikon Instruments). For TEM, 70 nm sections were cut on a microtome (RMC PowerTome MT-XL). Sections were collected on 200 Mesh hexagonal grids (EMS), and subsequently stained with uranyl acetate and lead citrate. Imaging was performed on a Hitachi H-600 transmission electron microscope.
2.9. Zebrafish OS histological analysis
Zebrafish OS measurements were quantified blinded in ImageJ. For average OS area, twenty individual OS were measured on each of five different histological sections to generate a value for OS area for a single biological replicate. This analysis was performed for five different embryos of each genotype at each time point to generate an average OS area measurement. For retinas lacking a total of twenty individual OS, all OS imaged were included in the area analysis. For average OS number, the number of OS was counted along a random length of 50 μm for each of five different histological sections for a single biological replicate. These values were then averaged for five different embryos to generate the average OS number.
2.10. Zebrafish height-to-radius ratio and diameter measurement
For the volumetric analysis, the OS height and radius was measured from the histological images for 10 different OS for each of 5 different embryos of each genotype for time-points at 72hpf and beyond. For the 55hpf and 60hpf time-points, the height-to-radius ratio was calculated for every observed OS. The total number of OS quantified for each biological replicate was averaged for a single value. The final ratio is expressed as an average of the biological replicates with SEM.
2.11. Disc packing quantification
For zebrafish, high-magnification (> 35k) TEM images of wild-type retinas at 7dpf were used to determine disc-packing of zebrafish OS. For 12 individual OS, the number of discs was counted along a 1 μm height. The disc packing (discs/μm) were calculated as an average of these 12 measurements. For mice, high-magnification (> 30k) TEM images of P13 wild-type retinas were used to determine disc-packing of mouse OS. For 20 individual OS, the number of discs was counted along a 1 μm height. The disc packing (discs/μm) were calculated as an average of these 20 measurements.
2.12. Zebrafish EdU incorporation and analysis
EdU incorporation was performed by treating embryos with 10 mM EdU with 15% DMSO in fish water. Five pooled embryos were incubated for 15 min with the analog at each specific timepoint, which was then washed out with fish water for 5 min. Embryos were then processed for cryosections as described above. For detection of EdU incorporation in cryosections, the Click-iT EdU Alexa Fluor 488 Imaging Kit (ThermoFisher) was used. For detection of EdU+ cells, the analysis was limited to presumptive photoreceptors in the ONL of the central retina, excluding the extreme periphery. A confocal z-series of five steps of 2 μm each was collected to span the entire cryosection. Each of the images was then blinded for analysis. For each step of the z-series, the number of EdU+ nuclei were counted and the total length of ONL was measured. Edu+ nuclei were summed among each step in the z-series and the total number of EdU+ nuclei were divided by the total length of ONL to generate a value of the average EdU+ nuclei per length. This analysis was performed on five different cryosections for each of five different embryos per genotype to generate final values.
2.13. Zebrafish phagosome analysis
Phagosome measurements were quantified from blinded EM images using ImageJ software. Thirteen EM images were analyzed for each 7dpf embryo. In each image, the number of phagosomes was counted and the length of RPE (measured parallel to Bruch’s membrane) in the image was measured. For the thirteen images, the total number of phagosomes was summed and divided by the total length of RPE analyzed to generate the number of phagosomes per unit length of RPE for an individual embryo. This was performed for each of four embryos per genotype. For phagosome area, each of the phagosomes observed was measured and averaged for each embryo to generate an individual phagosome area value per embryo. These were averaged among four embryos per genotype.
2.14. Histological analysis of nuclei in the zebrafish outer nuclear layer
For quantification of nuclei, we used blinded images and ImageJ software. For ONL width five different measurements of the thickness of the ONL were taken for each of five different histological sections of a single biological replicate. This analysis was performed for five different embryos of each genotype to generate an average ONL thickness. For nuclei per length or retinal expanse, the number of nuclei in the ONL was counted along a random retinal length of 50 μm for each of five different histological sections for a single biological replicate. These values were then averaged for five different embryos to generate the average number of nuclei per length. For nuclear area, twenty individual nuclei were measured on each of five different histological sections to generate a value for nuclear area for a single biological replicate. This analysis was performed for five different embryos of each genotype at each time point to generate an average nuclear area.
2.15. Zebrafish Hedgehog drug treatment
For the duration of drug treatment, five individual embryos of each genotype were dechorionated and each placed in a single well of a 96-well plate with 100 μL of either 20 μM SAG (with a final concentration of 0.02% EtOH), 20 μM cyclopamine (with a final concentration of 0.02% EtOH), or 0.02% EtOH alone. Following the time course of drug treatment, embryos were removed and placed together in a dish of regular fish water for recovery. Embryos were then terminally fixed and processed for OS measurement at 72hpf.
2.16. Zebrafish basal body analysis
TEM was performed on three embryos of each genotype at five time points between 50hpf and 60hpf. All centrioles observed were imaged across the central retinas of two different sections per biological replicate. The average number of basal bodies imaged was 22 ± 1 centrioles per biological replicate. Individual basal bodies were then categorized into one of three distinct categories: no cilia, cilia, and OS for analysis as described in the text. For cilia length, the length from proximal end of the basal body to distal tip of cilia was measured for each example of a ciliated basal body.
2.17. Mouse OS histological analysis
To control for slight variations in age as best as possible, paired littermates from a heterozygous incross were used for all OS analyses for each of five time points between P9 and P17. For average OS area, 100 OS were measured on TEM images for each single biological replicate. This analysis was performed for at least three different mice for both WT and Osm-3/Kif17tm1b(Bjc) at each time point to generate an average OS area measurement. To quantify the diameter of the mouse OS, 100 OS were measured for three biological replicates at each timepoint (P9, P11, P13, P15, and P17) for both wild-type and Osm-3/Kif17tm1b(Bjc) mice.
2.18. Statistical analysis
For osm-3/kif17 zebrafish OS area and density analyses, a one-way ANOVA was performed to determine statistical significance in differences between control, osm-3/kif17mw405, and osm-3/kif17sa0119 embryos. For cos2/kif7 OS area and density analyses, an unpaired t-test was performed to determine significance between control and cos2/kif7mw406 embryos. For volumetric analysis between control, osm-3/kif17mw405, and cos2/kif7mw406 embryos, a one-way ANOVA was performed. For EdU incorporation experiments, phagosome analysis, photoreceptor nuclei and opsin qPCR analysis one-way ANOVA was performed. For experiments resulting in significance with a one-way ANOVA, a Bonferroni post-hoc test was performed to determine significance between groups. For drug treatment and basal body TEM experiments, two-way ANOVA was performed. For experiments resulting in significance with a two-way ANOVA, a Bonferroni multiple-comparisons post-hoc test was performed to determine significance between groups. For ciliary length analysis, an unpaired t-test was performed. For all experiments, significance is labeled as *: p≤.05, **: p≤.01, ***: p≤.001, ****: p≤.0001. Non-significant values are unlabeled.
3. Results
3.1. osm-3/kif17 morphants and mutants have a developmental delay in OS morphogenesis
With an apparent discrepancy in the impact on OS morphogenesis between the osm-3/kif17 morphant (Insinna et al., 2008), osm-3/kif17sa0119 mutant (Zhao et al., 2012), and osm-3/kif17sa18340 mutant (Pooranachandran and Malicki, 2016), we took two different experimental approaches. The first was to re-evaluate photoreceptor development at 3dpf in osm-3/kif17 morphants. We found that morphants injected with a splice site morpholino exhibited a ~50% reduction in both size and number of OS in the central retina at 3dpf compared to control morpholino-injected embryos (Fig. S1). The second approach was to evaluate the earliest stages OS morphogenesis in mutant fish. We began by using transcription activator-like effector nucleases (TALENs) to generate an independent osm-3/kif17 allele. RNA encoding two different TALEN arms were injected into embryos to target a double-stranded break in exon 1 of osm-3/kif17 (Fig. 1A). The first exon was targeted for two reasons. First, nonsense mutations earlier in the coding sequence of osm-3/kif17 should result in earlier premature stop codons, decreasing the risk of truncated protein translation. Second, exon 1 encodes part of the motor domain of OSM-3/Kif17, an essential component of a microtubule-based motor. Specifically, deletions generated with the TALENs would target R13, a residue homologous in kinesin-2 motors and important for ATP binding (Gulick et al., 1998). We established a line of zebrafish, osm-3/kif17mw405, containing an 11 bp deletion in osm-3/kif17, resulting in a premature stop codon in exon 1 (Fig. 1B). No protein was detected via Western blot (Fig. 1C), suggesting that osm-3/kif17mw405 is a null allele.
Fig. 1.
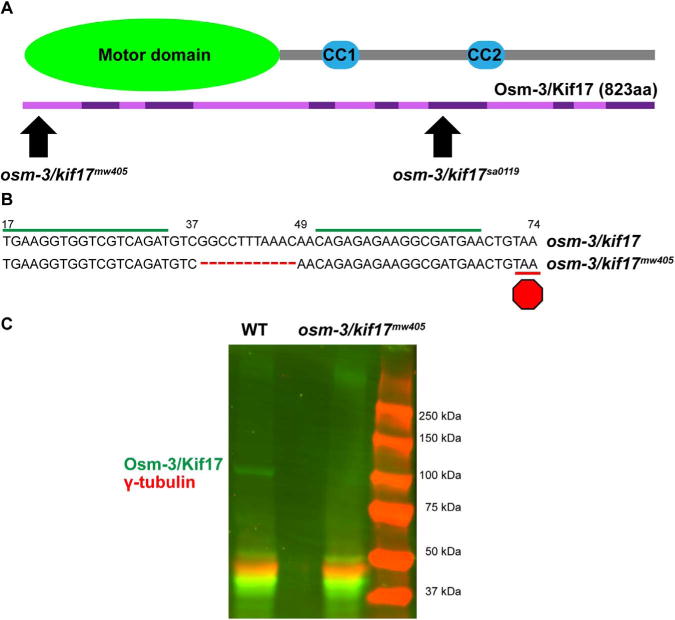
TALEN-mediated genetic editing generates osm-3/kif17mw405, a null allele. A. osm-3/kif17 is a gene with 14 exons (alternating light and dark purple), encoding a kinesin with 823 amino acids. The N-terminus of OSM-3/Kif17 contains the motor domain, as well as several residues shown to be important for ATP binding (Gulick et al., 1998). Coiled-coiled domains are important for homo-dimerization. The new osm-3/kif17mw405 allele is a deletion in exon 1, targeting the motor domain, while the osm-3/kif17sa0119 allele is a single base pair change that introduces a stop codon downstream of both the motor domain and the first coiled-coiled domain. B. Two TALEN arms (green line) were co-injected to target a double-stranded break ~40bases into exon 1 of osm-3/kif17. The isolated osm-3/kif17mw405 allele is an 11-bp deletion resulting in a premature stop codon (red octagon) in exon 1. C. Western blot of 5dpf embryo lysate. A ~100 kDa band is detected in wild-type for OSM-3/Kif17 (green) that is absent in osm-3/kif17mw405. γ-tubulin (red) is used as a loading control.
To clarify the role of osm-3/kif17 in OS morphogenesis, we used plastic histology to quantify the area of individual OS as well as the number of OS in the central retina in wild-type, osm-3/kif17mw405 and osm-3/kif17sa0119 fish between 55 hpf and 96 hpf (Fig. 2). At 60hpf (Fig. 2 A), the OS of both osm-3/kif17mw405 and osm-3/kif17sa0119 were significantly reduced in number to ~15% of wild-type, and the OS that had formed were smaller, with an area fraction of ~20% of wild-type (Fig. 2D). At 72hpf (Fig. 2B), both the size and number of OS of the two mutants were reduced to ~50% of wild-types (Fig. 2D). At 96hpf (Fig. 2C), numbers of osm-3/kif17mw405 and osm-3/kif17sa0119 OS had recovered to wild-type levels, but were still smaller in size at ~75% of wild-type (Fig. 2D). osm-3/kif17mw405 and osm-3/kif17sa0119 OS were completely recovered in both number and size at 6dpf (data not shown). Overall, we show that two independent alleles of osm-3/kif17 both result in a developmental delay of OS morphogenesis. Interestingly, at 3dpf we see a striking phenocopy between not only both osm-3/kif17 mutants, but between the mutants and the morphant (Fig. S1), where there is a ~50% reduction in both size and number of OS. This suggests that the morphant phenotype is osm-3/kif17-specific and that osm-3/kif17 plays a role in early OS development.
Fig. 2.
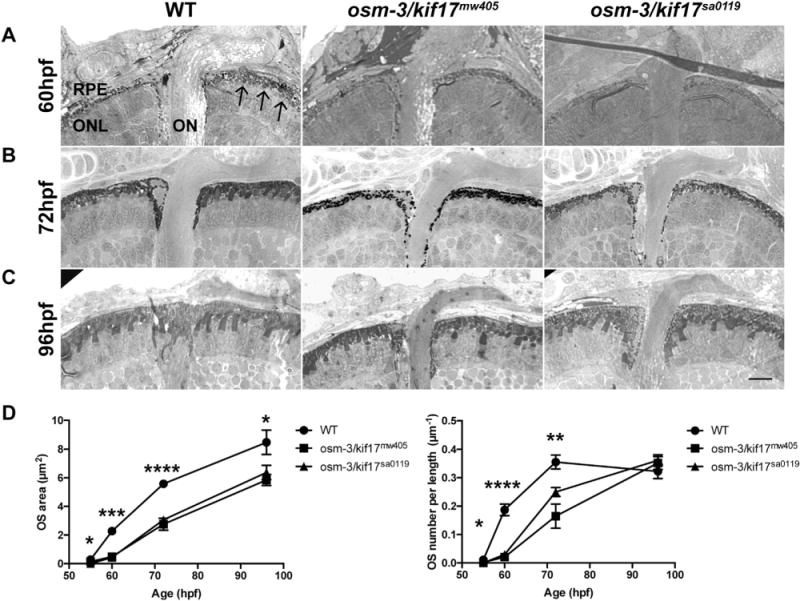
osm-3/kif17mw405 and osm-3/kif17sa0119 both result in a OS developmental delay. A. Plastic histology at 60hpf reveals several small OS (arrow) in the central retina of wild-type embryos, but OS are virtually absent in osm-3/kif17mw405 and osm-3/kif17sa0119 retinas. B. At 72hpf, wild-type OS begin to elongate and are more numerous, while osm-3/kif17mw405 and osm-3/kif17sa0119 retinas have few and small OS. C. At 96hpf, osm-3/kif17mw405 and osm-3/kif17sa0119 retinas appear to have comparable OS densities, although the size still appears smaller. Scale bar is 10 μm. D. (Left) Quantification of the average area of an individual OS during the first 4dpf. At all time-points measured, the decrease in size of both osm-3/kif17 mutants is statistically significant. For all genotypes, 100 total OS were measured for each of five biological replicates at each timepoint. (Right) Quantification of the average density of OS in number of OS per length of RPE. During the initial 72hpf, the decrease in numbers of both osm-3/kif17 mutants is statistically significant. For all genotypes, a total length of 250 μm of RPE was measured for each of five biological replicates at each timepoint.
3.2. cos2/kif7mw406 mutants have a developmental delay in OS morphogenesis
Because cos2/kif7, the homologue of Drosophila costal2, has been implicated in regulating ciliary architecture (He et al., 2014), we were interested in a potential redundant function of cos2/kif7 with osm-3/kif17 in controlling photoreceptor OS development. We used clustered regularly interspaced short palindromic repeats (CRISPRs) to target exon 2, containing the motor domain, of cos2/kif7 for mutagenesis (Fig. 3A). While the motor domain of Cos2/Kif7 does not exhibit processive movement, it is still required for microtubule-binding and Cos2/Kif7 activity (He et al., 2014). Additionally, targeting early in a gene’s sequence further reduces the chance of translation of a functional truncated protein. Two gRNA targeting sequences on cos2/kif7 ~75 bp apart were co-injected with mRNA encoding Cas9 (Fig. 3B). We established a line of zebrafish, cos2/kif7mw406, that is a complex allele ultimately leading to insertion of 32 bp, causing a premature stop codon in exon 2. As expected, cos2/kif7mw406 results in decreased mRNA expression of cos2/kif7 by over two-fold (Fig. 3C). However, an antibody to detect zebrafish Cos2/Kif7 to verify its status at the protein level is not available.
Fig. 3.
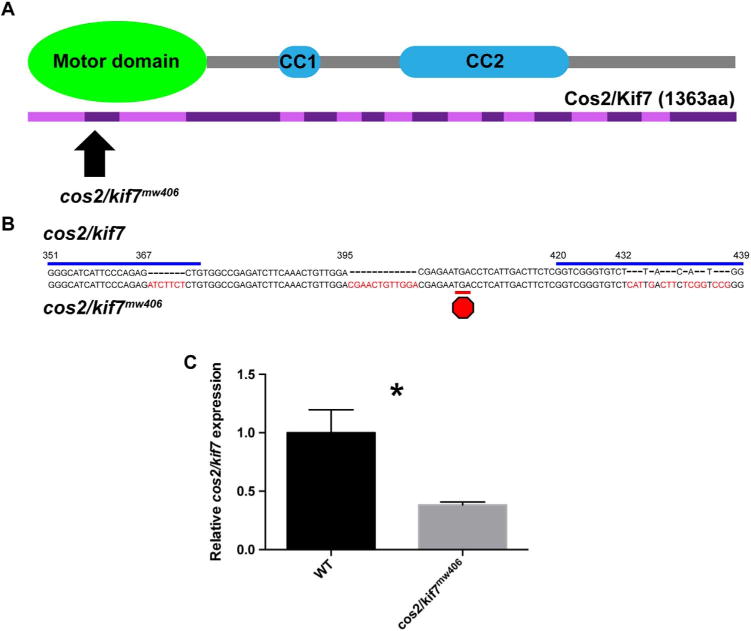
CRISPR-mediated genetic editing generates cos2/kif7mw406. A. cos2/kif7 is a gene with 18 exons (purple), encoding a kinesin with 1363 amino acids. The N-terminus of Cos2/Kif7 contains the motor domain, which has been shown to be important for Cos2/Kif7 function (He et al., 2014). Coiled-coiled domains are important for homo-dimerization. cos2/kif7mw406 is an allele in exon 2, targeting the motor domain. B. Two CRISPR gRNAs (blue line) were co-injected with mRNA encoding Cas9 to target double-stranded breaks within exon 2 of cos2/kif7. The isolated cos2/kif7mw406 allele is a complex allele with a total of 32-bp insertions scattered at several locations (indicated in red) in exon 2. This allele results in a premature stop codon (red octagon) in exon 2. C. qPCR data of relative levels of cos2/kif7 expression at 3dpf normalized to control. For each genotype, five biological replicates consisting of five pooled embryos were run in triplicate. cos2/kif7 is downregulated more than two-fold in the mutant. An antibody to Cos2/Kif7 protein is not currently available.
We performed the same quantitative analysis of cos2/kif7mw406 OS morphogenesis that we did on the osm-3/kif17 mutants (Fig. 4). At 55hpf OS were not observed in cos2/kif7mw406 retinas (Fig. 4D), although a few were observed in wild-type. At 60hpf (Fig. 4 A) the number of OS in cos2/kif7mw406 was < 5% of that in wild-type, and those that had formed were ~10% of the size of wild-type (Fig. 4D). At 72hpf (Fig. 4B), cos2/kif7mw406 OS number was up to ~65% of wild-type and their size was ~60% of wild-type (Fig. 4D). Although the OS density recovers by 96hpf (Fig. 4C,D), cos2/kif7mw406 OS were still small, at only ~50% of wild-type (Fig. 4D). cos2/kif7mw406 OS are completely recovered in both number and size at 6dpf (data not shown). Overall, we show that cos2/kif7mw406 embryos have a developmental delay of OS morphogenesis similar to that observed in osm-3/kif17mw405 embryos.
Fig. 4.
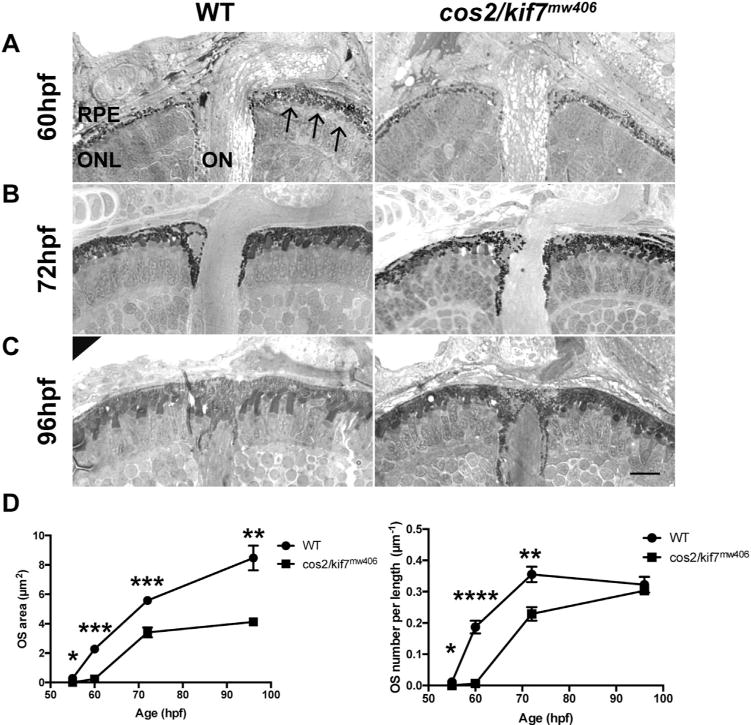
cos2/kif7mw406 results in a OS developmental delay. A. Plastic histology at 60hpf reveals OS are virtually absent in cos2/kif7mw406 retinas compared to the presence of numerous OS in controls (arrows). B. At 72hpf, cos2/kif7mw406 have few and small OS compared to controls. C. At 96hpf, cos2/kif7mw406 retinas have comparable OS densities, although the size still appears smaller. Scale bar is 10 μm. D. (Top) Quantification of the average area of an individual OS during the first 4dpf. At all time-points measured, the decrease in size of cos2/kif7mw406 OS is statistically significant. For both genotypes, 100 total OS were measured for each of five biological replicates at each timepoint. (Bottom) Quantification of the average number of OS per length of RPE. During the initial 72hpf, the decrease in numbers of both cos2/kif7 mutants is statistically significant. For all genotypes, a total length of 250 μm of RPE was measured for each of five biological replicates at each timepoint.
3.3. After an initial delay, osm-3/kif17mw405 and cos2/kif7mw406 mutants achieve normal rates of OS morphogenesis
Both osm-3/kif17mw405 and cos2/kif7mw406 result in remarkably comparable OS morphogenesis delays that appear to completely recover. While mutant OS appear morphologically normal at 6dpf, we were interested in whether mutant OS could reach full-length, steady-state size. Indeed, both osm-3/kif17mw405 and cos2/kif7mw406 mutant OS are indistinguishable from wild-type in terms of size at 21dpf, and OS in the central retina reach a normal steady-state size by 14dpf (Fig. S2), suggesting that the developmental delay associated with loss of cos2/kif7 or osm-3/kif17 has no ultimate impact on OS size. However, normal OS size could be achieved with slower rates of disc assembly in mutants coupled with decreased turnover through disc shedding.
To analyze rates of OS morphogenesis during initial development, we used our histological data to generate a three-dimensional model of OS morphogenesis. We used a cylindrical model because this best fit our observations of OS shape during the times considered in this study. It also enabled us to relate the cross-sectional area, measured histologically (Eq. 1) to the cylindrical volume (Eq. 2) as shown in Eq. 3.
| (1) |
| (2) |
| (3) |
Because the zebrafish OS grows in diameter as well as length during these very early stages of development (Fig. S3) we needed to determine the ratio of the height to radius of the OS throughout development to calculate volume solely in terms of cross-sectional area. This ratio, n, could then allow us to estimate volume from our histological data (Eq. 4).
| (4) |
We calculated the height to radius ratio, n, empirically from the histological images for each genotype and time-point (Table 1). We then estimated the OS volume and volumetric rates of OS morphogenesis (Table 2). We also used TEM to calculate the disc packing of an early zebrafish OS (30.9 ± 0.8 discs/μm of OS height), which we then used to estimate rates of OS disc production (in terms of disc surface area) from our volumetric rates (Table 3).
Table 1.
Empirically measured OS height to radius ratios (no units).
| WT | cos2/kif 7 (mw406) | osm-3/kif17 (mw405) | |
|---|---|---|---|
| 55hpf | 2.09 ± 0.11 | N/A | N/A |
| 60hpf | 2.93 ± 0.29 | 2.31 ± 0.32 | 2.76 ± 0.32 |
| 72hpf | 5.11 ± 0.57 | 2.95 ± 0.03 | 3.49 ± 0.34 |
| 144hpf | 4.19 ± 0.12 | 4.69 ± 0.65 | 3.94 ± 0.11 |
| 336hpf | 5.40 ± 0.19 | 5.13 ± 0.19 | 5.24 ± 0.27 |
Table 2.
Volumetric rate of OS growth (μm3/h).
| WT | cos2/kif 7 (mw406) | osm-3/kif17 (mw405) | |
|---|---|---|---|
| 55–60hpf | 0.42 ± 0.05 | 0.02 ± 0.00 | 0.04 ± 0.01 |
| 60–72hpf | 0.36 ± 0.07 | 0.33 ± 0.03 | 0.21 ± 0.04 |
| 72–144hpf | 0.47 ± 0.05 | 0.44 ± 0.07 | 0.45 ± 0.02 |
| 144–336hpf | 0.35 ± 0.03 | 0.37 ± 0.02 | 0.31 ± 0.03 |
Table 3.
Volumetric rate of OS growth (μm2 of disc surface area/min).
| WT | cos2/kif 7 (mw406) | osm-3/kif17 (mw405) | |
|---|---|---|---|
| 55–60hpf | 0.44 ± 0.05 | 0.02 ± 0.00 | 0.04 ± 0.01 |
| 60–72hpf | 0.37 ± 0.07 | 0.34 ± 0.04 | 0.21 ± 0.04 |
| 72–144hpf | 0.48 ± 0.05 | 0.45 ± 0.08 | 0.46 ± 0.02 |
| 144–336hpf | 0.36 ± 0.03 | 0.38 ± 0.03 | 0.32 ± 0.04 |
From the volumetric analysis, wild-type OS morphogenesis occurs at a constant rate of 0.40 ± 0.09 μm2 of disc surface area per minute during the first 14dpf (Fig. 5). Although both osm-3/kif17mw405 and cos2/kif7mw406 mutant OS morphogenesis is severely hindered between 55hpf and 60hpf, after 60hpf there is no significant impact on rates, with osm-3/kif17mw405 at 0.33 ± 0.06 μm2 of disc surface area per minute and cos2/kif7mw406 at 0.39 ± 0.09 μm2 of disc surface area per minute (Fig. 5). Overall, both osm-3/kif17mw405 and cos2/kif7mw406 mutants have delayed rates of OS morphogenesis between 55–60hpf, but after this, rates of OS morphogenesis are not distinguishable from wild-type.
Fig. 5.
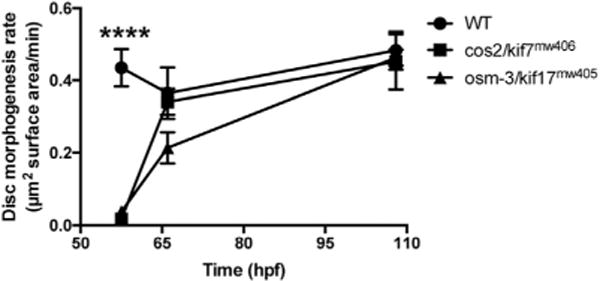
osm-3/kif17mw405 and cos2/kif7mw406 do not affect volumetric rates of OS morphogenesis. The rate of OS morphogenesis (in terms of surface area of disc material per minute) is calculated for three different time-periods: from 55 to 60hpf (shown as 57.5hpf), 60–72hpf (shown as 66hpf), and 72hpf-144hpf (shown as 108hpf). After the initial delay in OS morphogenesis from 55 to 60hpf, there is no difference in rates between control, osm-3/kif17mw405, and cos2/kif7mw406 OS.
However, our volumetric analysis of OS morphogenesis was obtained by pooling measurements of rod and cone OS that are not morphological distinguishable in early development. This raised the question of whether more subtle differences involving individual photoreceptor sub-types might be obscured in the analysis. We reasoned that changes in the level of opsin mRNA expression might occur if OS morphogenesis was disrupted in one or more individual photoreceptor sub-types. To that end, we used qPCR to quantify expression of the various opsins for each specific photoreceptor sub-type in zebrafish (UV cone, blue cone, green cone, red cone, and rod). There were no stark differences in expression of any specific opsin in wild-type compared to either osm-3/kif17mw405 or cos2/kif7mw406 at either 82 or 154hpf (Fig. S4). Blue cone opsin in cos2/kif7mw406 fish at 82hpf was the only statistically significant difference observed, but that difference was not repeated in the 154hpf data set. Ultimately, these data on opsin mRNA expression are consistent with our general conclusion that OS morphogenesis occurs normally among both rod and cone populations following an early delay. Also consistent with the finding that OS achieve a normal steady-state size with similar rates of OS morphogenesis, we found that wild-type, osm-3/kif17mw405, and cos2/kif7mw406 mutants exhibited similar levels of OS turnover through disc shedding (Fig. S5). Using transmission electron microscopy, we observed disc shedding as early as 7dpf in zebrafish, despite this being a time when OS have yet to achieve a steady-state size. However, there was no significant difference in either phagosome number or size between wild-type and either osm-3/kif17mw405 or cos2/kif7mw406 at 7dpf. Taken together, the experimental data shows no notable differences in phagosome count or opsin expression, supporting the conclusion from our volumetric analysis that there are no effects on rates of OS morphogenesis in either osm-3/kif17mw405 or cos2/kif7mw406 mutants.
3.4. osm-3/kif17mw405 and cos2/kif7mw406 mutants delay OS morphogenesis through different mechanisms
As both osm-3/kif17mw405 and cos2/kif7mw406 have similar OS morphogenesis delays, we hypothesized that the two kinesins could be functioning in a single pathway. cos2/kif7 has been shown to regulate Hh signaling (He et al., 2014), and Hh signaling has been implicated in photoreceptor differentiation (Stenkamp et al., 2000). Therefore, we sought to investigate the cell cycle in osm-3/kif17mw405 and cos2/kif7mw406 photoreceptor progenitors at a time period just prior to the initial OS morphogenesis delay. We performed acute EdU treatments between 48hpf and 55hpf. The majority of presumptive photoreceptors (cells in the outer nuclear layer, or ONL) incorporated EdU at 48hpf in controls as well as osm-3/kif17mw405 and cos2/kif7mw406 mutants (Fig. 6A,D). However, with an acute EdU treatment at 50hpf (Fig. 6B), both wild-type and osm-3/kif17mw405 retina had a severe reduction in the number of EdU labeled cells in the ONL, indicating presumptive photoreceptors in these embryos had already progressed through S-phase of the cell cycle. In contrast, cos2/kif7mw406 retina still had significant EdU incorporation in presumptive photoreceptors (Fig. 6D). Additionally, at 55hpf, the number of nuclei in the ONL with EdU incorporation remained elevated in cos2/kif7mw406 (Fig. 6C,D), indicating delayed progression of cos2/kif7mw406 presumptive photoreceptors through S-phase, which in turn resulted in the OS morphogenesis delays. While there is an apparent delay in completion of the terminal cell cycle of cos2/kif7mw406 mutant photoreceptor progenitors, this did not result in fewer terminally differentiated photoreceptors, as measures of the ONL were not different between wild-type and either cos2/kif7mw406 or osm-3/kif17mw405 mutants at 60hpf (Fig. S6), a time when there are large differences in numbers of OS. Apart from the presumptive photoreceptors, increased EdU incorporation was also found in the cos2/kif7mw406 mutant presumptive inner retinal neurons (both those in the inner nuclear layer and ganglion cell layer) at all time-points between 48hpf and 55hpf (Fig. 6D), indicating that there is a widespread delay in retinal neurogenesis that ultimately leads to a secondary effect of delayed OS morphogenesis. These data clearly distinguish the cos2/kif7mw406 mutant from the osm-3/kif17mw405, which is indistinguishable from wild-type fish in Edu incorporation.
Fig. 6.
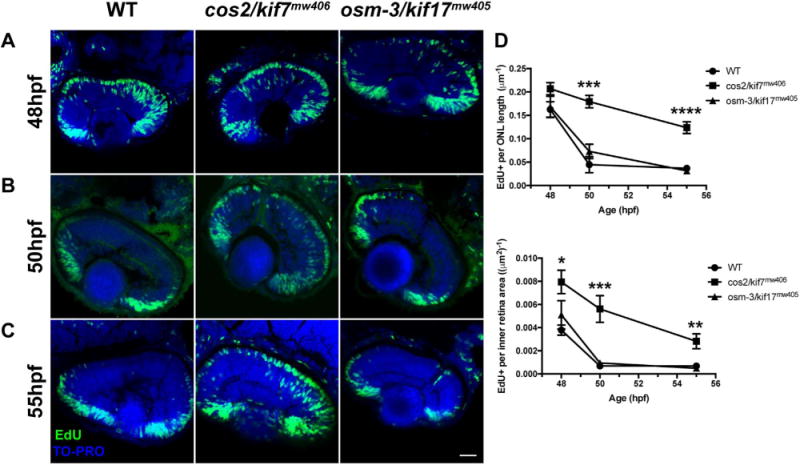
cos2/kif7mw406 exhibit delayed retinal neurogenesis. A. At 48hpf, embryos were incubated with EdU for 15-min to label cells in S-phase of the cell cycle. Nearly every presumptive photoreceptor in the ONL is labeled with the EdU (green). All nuclei were labeled with TO-PRO (blue). B. 50hpf embryos were given an identical EdU treatment. cos2/kif7mw406 presumptive photoreceptors remained strongly labeled by the EdU, while control and osm-3/kif17mw405 presumptive photoreceptors do not. C. EdU treatment of 55hpf embryos shows that although decreased from previous time-points, cos2/kif7mw406 presumptive photoreceptors remained labeled by the EdU. Scale bar is 25 μm. D. (Top) Quantification of the number of presumptive photoreceptor nuclei labeled by the EdU treatment as a measure of the total length of ONL. The number of EdU positive nuclei were counted among several images along a total average ONL length of 408 ± 26 μm for five biological replicates at each timepoint for each genotype. At 48hpf, presumptive photoreceptors of each genotype are strongly labeled by EdU, while cos2/kif7mw406 labeling remains significantly increased through 55hpf. (Bottom) Quantification of the number of inner retinal cells (including INL and GCL) labeled by the EdU treatment as a measure of the total inner retinal area. The number of EdU Positive nuclei were counted among several images within a total average inner retina area of 14000 ± 500 μm2 for five biological replicates at each timepoint for each genotype. Inner retinal cells have increased EdU incorporation between 48hpf and 55hpf.
Published work has shown that inhibiting Hh activity between 13 and 25hpf leads to delayed expression of ath5, an activator of retinal neurogenesis (Kay et al., 2005). Therefore, we sought to determine whether modulating Hh activity either positively or negatively during this time period would recapitulate the cos2/kif7mw406 delayed OS morphogenesis phenotype. We treated embryos with 20 μM of either Smoothened agonist (SAG) or antagonist (cyclopamine) between 13–25hpf. Interestingly, both activation and inhibition of Hh signaling led to reduced OS size at 72hpf in wild-type embryos that was comparable to the cos2/kif7mw406 mutant phenotype (Fig. 7A). Further, there was no effect of drug treatment on cos2/kif7mw406 embryos, implying the cos2/kif7mw40 OS morphogenesis phenotype is a result of modulated Hh activity.
Fig. 7.
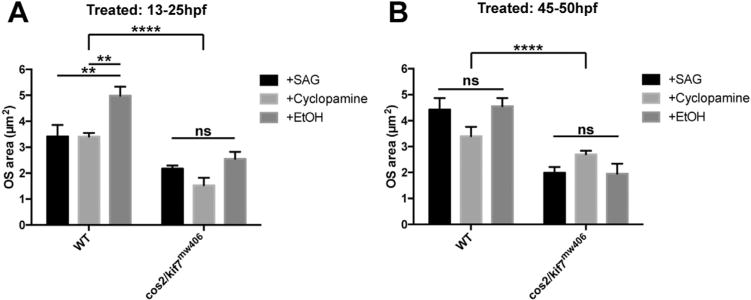
Activation or inhibition of early Hedgehog signaling results in reduced OS development at 72hpf. Five wild-type and cos2/kif7mw406 embryos were treated with either 20 μM SAG, 20 μM cyclopamine, or 0.02% EtOH (vehicle control) at either early (13–25hpf) (A) or late (45–50hpf) (B) in development. OS size was then measured at 72hpf as described above.
We further sought to determine whether modulating Hh activity just prior to photoreceptor neurogenesis would recapitulate the phenotype observed with the early 13–25hpf treatments. In stark contrast to treatment during this early period of development, SAG or cyclopamine treatment between 45–50hpf had no significant effect on OS size at 72hpf in either wild-type or cos2/kif7mw406 embryos (Fig. 7B). This suggests that Hh signaling during the time of terminal photoreceptor differentiation is not critical for normal timing of OS morphogenesis. Additionally, in these experiments we repeat our overall observation that cos2/kif7mw406 OS were smaller than in wild-type at 72hpf.
Contrary to our hypothesis that cos2/kif7 and osm-3/kif17 could have functionally redundant mechanisms in controlling OS morphogenesis, the EdU incorporation in osm-3/kif17mw405 retinas is indistinguishable from wild-type (Fig. 6D), suggesting that the delay in osm-3/kif17mw405 OS morphogenesis occurs through a distinct mechanism following the terminal division of presumptive photoreceptors. Consistent with this finding, we have found that cos2/kif7mw406; osm-3/kif17mw405 double mutants also exhibit a delay in retinal neurogenesis similar to cos2/kif7mw406 single mutants as measured by the EdU incorporation assay (Fig. S7A). However, the cos2/kif7mw406; osm-3/kif17mw405 double mutants are similar to both of the single mutants in terms of OS size during early development (Fig. S7B), suggesting that there is no compound or additive effect on later OS morphogenesis with loss of both cos2/kif7 and osm-3/kif17.
3.5. The delay in OS morphogenesis in osm-3/kif17mw405 mutants occurs at the stage of OS disc formation
To better understand the defects in OS morphogenesis in osm-3/kif17mw405 embryos, we performed TEM on embryos between 50–60hpf, the time when OS morphogenesis occurs in wild-type controls, but not osm-3/kif17mw405. We imaged centrioles in each retina and categorized them in three distinct categories: ‘free basal body’, or those that have not docked to the apical membrane and do not show any evidence of axonemal elongation (Fig. 8A); ‘cilia without discs’, which have docked to the apical membrane and begun elongating an axoneme (Fig. 8B); and ‘cilia with discs’, which are cilia that have begun to form discs (Fig. 8C). While there appear to be no noticeable defects in basal body trafficking to the apical membrane, docking, and initial axonemal elongation, there appears to be delay of several hours in initial disc formation, suggesting that the delay in OS morphogenesis of osm-3/kif17mw405 mutants is specifically related to disc morphogenesis. In addition, at either of these time-points, there is no effect of osm-3/kif17mw405 on ciliary length (Fig. S8), further suggesting a more direct involvement of osm-3/kif17 in early OS disc formation.
Fig. 8.
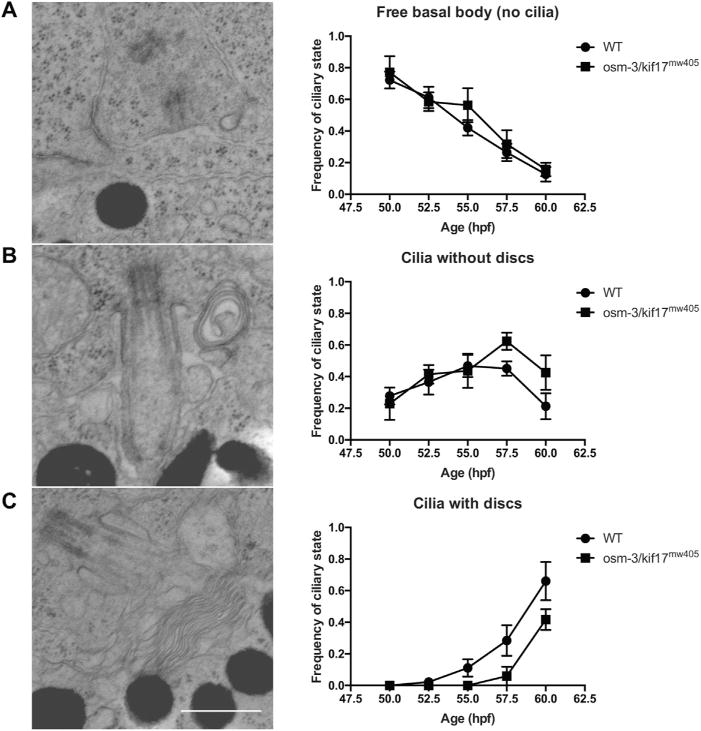
osm-3/kif17mw405 cilia appear to form normally, although disc formation is delayed. A-C. TEM was performed on three wild-type and osm-3/kif17mw405 embryos at each of five timepoints during the early stages of OS morphogenesis between 50hpf and 60hpf. An average of 22 ± 1 basal bodies were imaged for each sample and categorized into one of three ciliary states: no cilia (A), cilia without discs (B), or cilia with discs (C). Scale bar is 0.5 μm. While there does not appear to be a delay in initial ciliogenesis, disc morphogenesis specifically appears to be delayed in osm-3/kif17mw405 embryos.
3.6. The delay in OS morphogenesis in osm-3/kif17mw405 mutants is temperature-dependent
While our data support a dispensable role for osm-3/kif17 directly on early disc formation, we sought to investigate whether other contributing forces are compensating for loss of osm-3/kif17. We proposed that by altering temperature upward (32 °C) or downward (25 °C) from normal rearing temperature (28.5 °C), wild-type and osm-3/kif17mw405 embryos would develop either more quickly (at the increased temperature) or more slowly (at the decreased temperature). We reasoned that faster development would increase demand on the OS assembly pathway, while slower development would reduce demand. Subsequently, the requirement for a compensatory process for disc morphogenesis in osm-3/kif17mw405 embryos would exacerbate the phenotype when demand on OS assembly increased at the high temperature, while slower development would provide additional time for a compensatory process to rescue the phenotype at the low temperature. Wild-type embryos attained an OS size equivalent to those at 72hpf at standard rearing temperature 12 h earlier (60hpf) at the higher temperature and 20 h later (92hpf) at the lower temperature (Fig. 9). Interestingly, under these conditions, osm-3/kif17mw405 embryos exhibited an exacerbated OS defect at the higher temperature, while it was completely rescued at the lower temperature. These data support our model that, while osm-3/kif17 has a direct role in early disc morphogenesis, there are other compensating factors in the photoreceptor that allow OS morphogenesis to occur in osm-3/kif17 mutants.
Fig. 9.
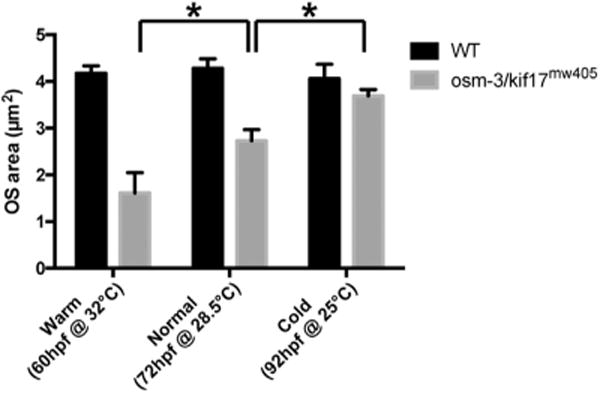
osm-3/kif17mw405 delay in OS morphogenesis is temperature-sensitive. Five wild-type and osm-3/kif17mw405 embryos were raised in either cold (25 °C), normal (28.5 °C), or warm (32 °C) conditions and developmentally staged at a “normal” 72hpf stage (60hpf at 32 °C for the “warm” condition; 92hpf at 25 °C for the “cold” condition). OS size was then measured at 72hpf as described above.
3.7. Osm-3/Kif17 mutant mice have OS morphogenesis delays
After resolving the apparent discrepancy in the literature surrounding the osm-3/kif17 morphant and mutant zebrafish, there still exists the discrepancy between the phenotype associated with loss of osm-3/kif17 between zebrafish and mice (Jiang et al., 2015). To this end, we sought to identify whether a similar OS morphogenesis delay exists in Osm-3/Kif17 mutant mice or whether this OS delay is a zebrafish-specific phenomenon. Using C57BL/6N stem cells from EUCOMM with a knockout-first targeted gene trap (Testa et al., 2004) (Skarnes et al., 2011), we generated Osm-3/Kif17tm1b(Bjc), a line of mice where exon 4 of Osm-3/Kif17 has been conditionally deleted and a lacZ reporter has been knocked-in (Fig. S9A). No protein was detected via Western blot (Fig. S9B), suggesting that Osm-3/Kif17tm1b(Bjc) is a null allele. To properly control for potential differences in age amongst separate litters, heterozygous mice were incrossed, leading to both wild-type and Osm-3/Kif17tm1b(Bjc) homozygous mutant littermates. Paired genotypes were then used to analyze OS development between P9 and P17. Interestingly, we observed an OS developmental delay of ~2days during initial OS morphogenesis (Fig. 10A).
Fig. 10.
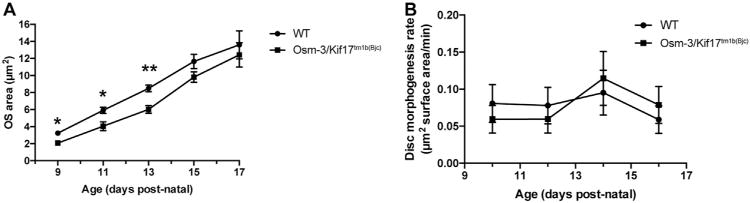
Osm-3/Kif17tm1b(Bjc) mutant mice exhibit a delay in OS morphogenesis. A. TEM was performed on three paired sibling wild-type and Osm-3/Kif17tm1b(Bjc) mutant mice at each timepoint between P9 and P17. OS area was measured at each stage as described above. Osm-3/Kif17tm1b(Bjc) mice have smaller OS during initial development. B. The average rate of OS morphogenesis (in terms of surface area of disc material per minute) from is calculated from our volumetric modeling for four time points: between P9-P11 (shown as P10), P11-P13 (shown as P12), P13-P15 (shown as P14), P15-P17 (shown as P16). There are no differences between rates of OS morphogenesis between wild-type and Osm-3/Kif17tm1b(Bjc) mice at any of these time points following initial OS development.
To investigate volumetric rates of mouse OS morphogenesis, we used a simplified version of our three-dimensional cylindrical model. As opposed to the cone-dominant zebrafish retina, where OS grow in both diameter as well as height through development (Fig. S3), we measured the diameter of the mouse OS at several stages between P9 and P17, and found that it is constant throughout development as well as between genotypes, at 1.16 ± 0.04 μm for wild-type and 1.13 ± 0.03 μm for Osm-3/Kif17tm1b(Bjc) mutants (Fig. S10). Because the diameter is constant, we can directly calculate the volume of the mouse OS from our cross-sectional area measurements (Eq. 3).
Similar to our zebrafish analysis, we can quantify rates of OS morphogenesis throughout mouse development using this volumetric model combined with our measurement of mouse disc packing (24.3 ± 0.3 discs/μm of OS height). We find that, following the initial delay in mouse OS development of Osm-3/Kif17tm1b(Bjc) mutant mice, there is no subsequent difference in rates of mouse OS morphogenesis between P9 and P17 among wild-type (0.08 ± 0.02 μm2 of disc surface area per minute) or Osm-3/Kif17tm1b(Bjc) mice (0.07 ± 0.02 μm2 of disc surface area per minute) (Fig. 10B), further defining a role for Osm-3/Kif17 in initial OS development that appears conserved across species.
4. Discussion
4.1. Loss of osm-3/kif17 delays OS development at the stage of initial disc formation
The role of osm-3/kif17 in zebrafish photoreceptor OS development has been clouded by discrepancies between the early osm-3/kif17 morphant work, which showed that OS were either missing or severely reduced in number and size at 3dpf (Insinna et al., 2008) and subsequent work on two different genetic mutant lines of zebrafish, osm-3/kif17sa0119 (Zhao et al., 2012) and osm-3/kif17sa18340 (Pooranachandran and Malicki, 2016) showing that normal photoreceptors were formed. For osm-3/kif17sa0119, immunostaining for cone and rods in adult retina showed that osm-3/kif17 is not essential for OS development and that embryonic opsin trafficking was normal (Zhao et al., 2012). In the case of the osm-3/kif17sa18340 mutant, OS were shown to be present at both 3dpf and 5dpf (Pooranachandran and Malicki, 2016). In this work, we use a quantitative analysis of OS area and density on histological images to resolve the apparent discrepancy in the literature surrounding OS development between osm-3/kif17 morphants and mutants. We show that, although OS morphogenesis is not completely ablated in osm-3/kif17 morphants, OS are reduced in both number and size by ~50% at 3dpf, suggesting that osm-3/kif17 morphant retinas only contain approximately a quarter of the OS material as control retinas. Additionally, we used TALENs to generate osm-3/kif17mw405, a null allele of osm-3/kif17, and compare it to osm-3/kif17sa0119. Using our quantitative analysis, we show that both osm-3/kif17mw405 and osm-3/kif17sa0119 OS are reduced in size and number until 6dpf, phenocopying the osm-3/kif17 morphant. Ultimately, we resolve the discrepancy between the published data on the osm-3/kif17 morphant (Insinna et al., 2008) and mutant (Zhao et al., 2012), (Pooranachandran and Malicki, 2016), and show that loss of osm-3/kif17, whether through knockdown or genetic mutation, leads to a quantifiable delay in early OS development.
Although the area of osm-3/kif17mw405 and osm-3/kif17sa0119 OS remains reduced through 6dpf, we sought to analyze volumetric rates of OS morphogenesis to determine whether loss of osm-3/kif17 results in either a delay in initial ciliogenesis or instead decreased OS morphogenesis rates following the initiation of ciliogenesis. To calculate these OS morphogenesis rates, we developed a three-dimensional model for early OS as a cylinder. Although fully-developed cone OS take on a conical shape, we believe a cylinder to be a suitable model for this early, mixed population of rod and cone OS that have yet to take on their fully-developed shape. In the wild-type, we show that zebrafish OS morphogenesis occurs at a near constant rate of 0.40 ± 0.09 μm2 of disc surface area per minute until OS reach an adult, steady-state size. Compared to wild-type, osm-3/kif17mw405 have severely impacted rates of OS morphogenesis from 55hpf to 60hpf, the time period of initial ciliogenesis. However, after 60hpf, the volumetric rates of OS morphogenesis are not significantly different from wild-type, at 0.33 ± 0.06 μm2 of disc surface area per minute. Although osm-3/kif17mw405 OS are smaller than controls until 6dpf, they are growing at comparable rates following an initial developmental delay of several hours. Because of this initial delay and subsequent normal rates of OS morphogenesis, we propose that osm-3/kif17mw405 OS do not actually recover fully in size to control levels prior to reaching steady-state, but instead, the difference in size between wild-type and osm-3/kif17mw405 OS becomes undetectable with our ability to measure the OS.
There are two implications of these data: the first is that osm-3/kif17 as an IFT motor is completely dispensable to maintain normal rates of OS morphogenesis. Presumably, a combination of active transport with kinesin-II (the other anterograde IFT motor) and passive transport via diffusion can fully accommodate the rates of trafficking needed to maintain these relatively fast rates of OS morphogenesis. The second implication of our data is that osm-3/kif17 is involved, but not essential, for some event in the initial ciliogenesis of the OS. Recent published work has implicated kinesin-II in basal body positioning (Pooranachandran and Malicki, 2016), so it is possible that osm-3/kif17 could be involved in this process as well. However, our TEM analysis between 50–60hpf, the time when photoreceptors terminally differentiate and OS begin forming, shows that there are no defects in basal body trafficking (or docking) to the apical membrane. In fact, there are no differences in axonemal elongation in initial ciliogenesis. Interestingly, the only observed defect in osm-3/kif17mw405 photoreceptor cilia in our TEM analysis is a specific delay in disc formation. However, OS discs in osm-3/kif17mw405 mutants, although delayed in formation, do not appear to be disorganized. Previous work shows that cones expressing dominant-negative OSM-3/Kif17 have smaller OS and disorganized discs at 5dpf, suggesting a role of osm-3/kif17 in OS elongation and disc morphogenesis (Insinna et al., 2009). Although this is more severe than the phenotype that we observe in osm-3/kif17mw405, we propose that osm-3/kif17 is specifically involved in disc morphogenesis, ultimately resulting in the observed developmental delay of OS morphogenesis.
As osm-3/kif17 appears to have a role in initial disc formation, we altered developmental speed of wild-type and osm-3/kif17mw405 embryos by either increasing or decreasing rearing temperature. Under these conditions, osm-3/kif17mw405 embryos exhibited an exacerbated OS defect at the high temperature and a rescue at the lower temperature. While these temperature changes are likely to impact many pathways, it could be argued that cooling embryos allows greater time for non-directional diffusion or compensatory trafficking pathways to transport OS cargo. In contrast, speeding development up by warming embryos should inhibit the ability of these compensatory processes by reducing the amount of time available for transport of OS cargo to the newly forming OS. This work is supported by our findings that the cos2/kif7mw406; osm-3/kif17mw405 double mutants, while exhibiting an early retinal neurogenesis delay comparable to the single cos2/kif7mw406 mutant, do not further exhibit OS morphogenesis delays.
Recent work in the literature has investigated the relative contributions of simple diffusion and IFT towards transport of various ciliary proteins (Ye et al., 2013), (Calvert et al., 2010), (Craft et al., 2015). In Chlamydomonas, it appears as if IFT is important for trafficking cargo such as tubulin under conditions of rapid growth, whereas diffusion can fully accommodate the movement of cargo under conditions of slow turnover or under steady-state conditions (Craft et al., 2015), (Harris et al., 2016). We propose that while osm-3/kif17 functions in initial OS morphogenesis, presumably through early disc assembly, both active transport via kinesin-II and passive transport via diffusion can compensate for loss of osm-3/kif17 (Fig. 11), ultimately allowing for dispensability of the OSM-3/Kif17 motor in OS development.
Fig. 11.
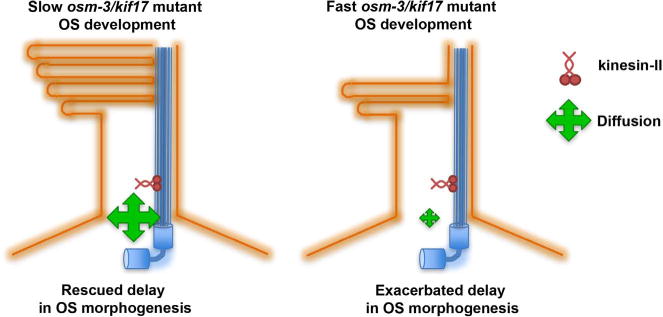
Proposed model of osm-3/kif17 function in initial OS morphogenesis. While osm-3/kif17 appears largely dispensable for ultimately forming the OS, it does appear to have a role in initial disc formation redundant with other factors, presumably including passive transport such as diffusion and other active transport forces. (Left) osm-3/kif17 mutant embryos that are cooled have slower rates of development, allowing greater time for non-directional diffusion or other factors to compensate for loss of osm-3/kif17, ultimately resulting in a rescue of the OS morphogenesis delays in osm-3/kif17mw405 embryos. (Right) In osm-3/kif17 mutant embryos under stressed conditions, such as increasing the rate of development by warming embryos, these alternate forces are unable to fully compensate for loss of osm-3/kif17, leading to an exacerbated phenotype.
While we believe that we have resolved the discrepancy in the literature surrounding the phenotype associated with loss of osm-3/kif17 for zebrafish OS development, other published work has shown that Osm-3/Kif17 deficient mice develop normal OS. However, with regards to early development, this work is limited in scope to unquantified, immunohistochemical staining of rhodopsin between P10 and P21 (Jiang et al., 2015). Therefore, we used a quantitative histological analysis to determine whether the mouse also exhibits an OS developmental delay with genetic loss of Osm-3/Kif17. Indeed, we observed a similar OS developmental delay of ~2 days between wild-type and Osm-3/Kif17tm1b(Bjc) mutant mice from P9 to P17. After applying our three-dimensional model to calculate volumetric rates, we show that wild-type and Osm-3/Kif17tm1b(Bjc) mutant mice do not differ in rates of OS morphogenesis. Ultimately, the mouse data supports our zebrafish data, suggesting a conserved role for Osm-3/Kif17 in the initial development of the OS, presumably through disc formation, and the dispensability of Osm-3/Kif17 to achieve normal rates of OS morphogenesis following this initial developmental delay.
4.2. Loss of cos2/kif7 delays retinal neurogenesis upstream of initial OS development
Hh signaling has been shown to be important in photoreceptor development in the zebrafish retina. Both shh and twhh ligand are expressed in the retinal pigmented epithelium (RPE) of zebrafish embryos. Expression begins in a ventral patch initially that then expands throughout the retina in a pattern that precedes photoreceptor differentiation. Morpholino-mediated knockdown of both these ligands together leads to a developmental delay of rod and red cone differentiation (Stenkamp et al., 2000). Additionally, rod and red cone differentiation is only slightly inhibited by a gli2 mutation, with significantly more severe defects in a shh mutation (Stenkamp et al., 2000). Thus, it appears as if Hh signaling is a positive regulator of photoreceptor differentiation in zebrafish. Cos2/Kif7, has been implicated in negatively regulating Hh signaling. A member of the kinesin-4 family, Cos2/Kif7 has recently been shown to control microtubule stability of the distal axoneme, allowing for organization of the ciliary tip where Gli proteins accumulate. While genetic loss of mouse Cos2/Kif7 does not affect IFT, it does lead to ectopic activation of Hh signaling through mislocalization of Gli proteins throughout the cilia (He et al., 2014). Interestingly, loss of cos2/kif7 in zebrafish appears to have few consequences outside of mesodermal derivatives (Maurya et al., 2013), although no work has investigated the role zebrafish cos2/kif7 may play in retinal development. Given that Hh signaling appears important for photoreceptor differentiation in zebrafish, we sought to investigate the effect that loss of cos2/kif7 may play in OS development in comparison to the effect that loss of osm-3/kif17 may have.
We generated a line of zebrafish, cos2/kif7mw406, containing a 32 bp insertion in the motor domain. This mutation generates a premature stop codon within exon 2 and leads to decreased cos2/kif7 mRNA as would be expected via nonsense-mediated decay. Interestingly, in our quantitative analysis of OS morphogenesis, we see a remarkably comparable developmental delay between cos2/kif7mw406 and osm-3/kif17mw405. Neither mutant has significant OS development until after 60hpf, compared to 55hpf for wild-type. Yet, in the time period after 60hpf until OS reach full-length size, cos2/kif7mw406 OS are growing at rates of 0.38 ± 0.08 μm2 of disc surface area per minute, compared to 0.39 ± 0.09 μm2/min for wild-type and 0.33 ± 0.06 μm2/min for osm-3/kif17mw405. Because of the role that Hh signaling plays in photoreceptor differentiation, we tested delayed cell cycle progression as the underlying mechanism for the OS developmental delay by EdU incorporation. Indeed, cos2/kif7mw406 presumptive photoreceptors have delayed S-phase progression, ultimately leading to delayed photoreceptor differentiation and therefore delayed OS morphogenesis as a secondary consequence. However, this does not appear to be a photoreceptor-specific phenomenon. Neurons in the inner retina (including those in both the inner nuclear layer and ganglion cell layer) appear to have delayed S-phase progression as well, suggesting that cos2/kif7mw406 has broadly delayed retinal neurogenesis.
These findings led us to ask whether drugs activating or inhibiting Hh signaling have an impact on OS morphogenesis. At the time of terminal photoreceptor differentiation (45–50hpf), SAG and cyclopamine have no effect on OS formation. However, published work has shown that Hh inhibition between 13–25hpf leads to delayed expression of ath5, an activator of retinal neurogenesis (Kay et al., 2005). Although loss of cos2/kif7 leads to increased Hh activity, we proposed that the observed delayed retinal neurogenesis and subsequently delayed OS morphogenesis in cos2/kif7mw406 mutants was due to modulated Hh activity during this same early time point of development. Treatment with either Hh activator or inhibitor between 13–25hpf delayed OS morphogenesis in a manner comparable to that in cos2/kif7mw406 mutant fish, suggesting that both ectopic activation and inhibition of Hh signaling between 13–25hpf leads to delayed retinal neurogenesis and ultimately delayed OS morphogenesis. Additionally, treatment of cos2/kif7mw406 embryos with the Hh drugs had no additional effect beyond the mutation alone on OS morphogenesis, supporting the conclusion that the OS morphogenesis delays observed in cos2/kif7mw406 mutants are downstream effects of aberrant early Hh signaling.
Published work in zebrafish has shown that compound shh and twhh morphants, which would decrease Hh activity, have delayed photoreceptor differentiation. Additionally, a shh mutant as well as gli2 mutant, which also should decrease Hh activity, both result in delayed photoreceptor differentiation as well (Stenkamp et al., 2000). Further, ath5 expression, a marker of retinal neurogenesis, was delayed in embryos treated with cyclopamine (Kay et al., 2005). Combined, this published work supports the idea that inhibition of Hh signaling leads to delayed retinal neurogenesis. However, the effects of ectopic Hh activation, as would be seen with loss of cos2/kif7 (He et al., 2014) or SAG treatment, has never been studied in the context of retinal neurogenesis. To our knowledge, our data is the first to suggest that ectopic activation of Hh signaling also leads to delayed retinal neurogenesis. Ultimately, misregulation of Hh signaling, either positively or negatively, is implicated in delaying photoreceptor development. We propose that the absolute level of Hh activity, whether ectopically high or low, is not important for regulating downstream retinal neurogenesis, but rather changes in the level of Hh activity are ultimately responsible for this regulation. With either ectopic activation or inhibition of Hh signaling, the cell is unable to detect the relatively small temporal changes in Hh signaling that would normally occur during retinal development, subsequently affecting neurogenesis.
4.3. Comparing rates of disc assembly and opsin trafficking among species
Our quantitative analysis of OS segment assembly during early development is the first to be conducted on a mixed rod-cone population in teleosts and has allowed us to estimate a rate of disc assembly of about 0.4 μm2/min during the early phase of OS growth in zebrafish; the comparable number in mice is much lower at 0.08 μm2/min. While our general conclusion is that the cos2/kif7mw406 and osm-3/kif17mw405 mutations delay onset of OS morphogenesis without impacting the rate at which it occurs, it is of interest to compare these estimates to rates obtained in other studies. Rod OS assembly and opsin trafficking has been studied quantitatively in both Xenopus laevis tadpoles (Besharse et al., 1977) and adult mice (LaVail, 1973) and, based on estimates of disc packing and size, those estimates can be converted to units of μm2 of disc membrane per minute as in this study. For example, Xenopus tadpoles produced about 64 new discs per day with a diameter of 6.0 μm corresponding to ~2.5 μm2/min (Besharse and Pfenninger, 1980). In contrast, in adult mice the rate is ~0.08 μm2/min based on an assembly rate of 2.3 μm of OS length per day (LaVail, 1973) and our estimate of disc diameter and packing. While our estimates in developing OS are virtually indistinguishable from historical data for adult mice, the estimated rates for the developing zebrafish OS (from our data) and Xenopus tadpole rods (Besharse and Pfenninger, 1980) are 5-fold and 30-fold higher respectively than in mice. These estimates are all remarkable in that they illustrate the large flow of opsin-containing membrane into the OS.
Using a published value for opsin packing in the disc of ~25,000 opsins/μm2 of disc surface area (Pugh and Lamb, 1993), our data suggest that in zebrafish opsin trafficking to the OS may be as high ~10,000 opsins per minute during OS development. This is much faster than the ~2000 opsin per minute trafficked in developing mice (Fig. 10B), which is identical to the value calculated for the opsin trafficking required to maintain daily rates of disc shedding in adults (Besharse and Horst, 1990). However, both mice and zebrafish are slower than published values for frog OS renewal at ~60,000 opsin per minute (Besharse et al., 1977), (Papermaster et al., 1985). Of note, these calculations of opsin trafficking are all on an individual cell basis. However, there are stark differences in OS diameter between each of these species. Here we show that the OS diameter to be ~1.2 μm in the mouse and ~3.8 μm in the zebrafish, while the diameter of the Xenopus tadpole OS was estimated at ~6 μm (Besharse and Pfenninger, 1980). Using these values, we can determine that about 10 mouse OS would fit in the same overall retinal area that a single fish OS would occupy. In contrast, about 2.5 zebrafish OS would occupy the retinal area that a single frog OS would. By standardizing the rates of opsin trafficking to retinal area occupied instead of on an individual cellular basis, we calculate that mouse opsin trafficking occurs at ~2000 opsins per minute per μm2 of retinal area, compared to zebrafish trafficking at ~1000 opsins per minute per μm2 of retinal area and frog trafficking at ~2000 opsins per minute per μm2 of retinal area. Ultimately, opsin trafficking rates appear widely consistent across species when considered in terms of opsin trafficking as a function of retinal area.
5. Conclusion
In this work, we used volumetric analysis of histological images to resolve the apparent discrepancy in the literature surrounding the phenotype associated with loss of osm-3/kif17 in photoreceptor OS development. We show that loss of osm-3/kif17 in either zebrafish or mice leads to a developmental delay in OS formation. While loss of the Hh signaling gene cos2/kif7 also leads to delayed OS morphogenesis, we show that these two genes have completely distinct mechanisms underlying this phenotype. Loss of cos2/kif7 leads to broad delays in retinal neurogenesis via aberrant Hh signaling early in development, while loss of osm-3/kif17 specifically results in a delay of disc morphogenesis. We further provide evidence that compensatory mechanisms for OS morphogenesis function in the absence of osm-3/kif17 and that these can be modulated by altering developmental speed. Lastly, we more generally use our data to compare rates of opsin trafficking across zebrafish, mice and frogs and show that, when analyzed in terms of opsin trafficking as a function of retinal area, rates are quite comparable between species.
Supplementary Material
Acknowledgments
Funding
This work was supported by the National Eye Institute Research Grant R01 EY03222 (JCB) and R01 EY014167 (BAL), as well as by a Core Grant for Vision Research (P30 EY001931). TRL was supported by a Training Program in Vision Science (T32 EY014537).
Appendix A. Supplementary material
Supplementary data associated with this article can be found in the online version at doi:10.1016/j.ydbio.2017.03.019.
References
- Bader JR, Kusik BW, Besharse JC. Analysis of KIF17 distal tip trafficking in zebrafish cone photoreceptors. Vis Res. 2012;75:37–43. doi: 10.1016/j.visres.2012.10.009. [DOI] [PMC free article] [PubMed] [Google Scholar]
- Baker SA, Freeman K, Luby-Phelps K, Pazour GJ, Besharse JC. IFT20 links kinesin II with a mammalian intraflagellar transport complex that is conserved in motile flagella and sensory cilia. J Biol Chem. 2003;278(36):34211–34218. doi: 10.1074/jbc.M300156200. [DOI] [PubMed] [Google Scholar]
- Besharse JC, Hollyfield JG, Rayborn ME. Turnover of rod photoreceptor outer segments. II. Membrane addition and loss in relationship to light. J Cell Biol. 1977;75(2 Pt 1):507–527. doi: 10.1083/jcb.75.2.507. [DOI] [PMC free article] [PubMed] [Google Scholar]
- Besharse JC, Horst CJ. The photoreceptor connecting cilium. A model for the transition zone. Ciliary and Flagellar Membranes. 1990:389–417. [Google Scholar]
- Besharse JC, Pfenninger KH. Membrane assembly in retinal photoreceptors I. Freeze-fracture analysis of cytoplasmic vesicles in relationship to disc assembly. J Cell Biol. 1980;87(2 Pt 1):451–463. doi: 10.1083/jcb.87.2.451. [DOI] [PMC free article] [PubMed] [Google Scholar]
- Calvert PD, Schiesser WE, Pugh EN., Jr Diffusion of a soluble protein, photoactivatable GFP, through a sensory cilium. J Gen Physiol. 2010;135(3):173–196. doi: 10.1085/jgp.200910322. [DOI] [PMC free article] [PubMed] [Google Scholar]
- Cole DG, Diener DR, Himelblau AL, Beech PL, Fuster JC, Rosenbaum JL. Chlamydomonas kinesin-II-dependent intraflagellar transport (IFT): IFT particles contain proteins required for ciliary assembly in Caenorhabditis elegans sensory neurons. J Cell Biol. 1998;141(4):993–1008. doi: 10.1083/jcb.141.4.993. [DOI] [PMC free article] [PubMed] [Google Scholar]
- Craft JM, Harris JA, Hyman S, Kner P, Lechtreck KF. Tubulin transport by IFT is upregulated during ciliary growth by a cilium-autonomous mechanism. J Cell Biol. 2015;208(2):223–237. doi: 10.1083/jcb.201409036. [DOI] [PMC free article] [PubMed] [Google Scholar]
- Gulick AM, Song H, Endow SA, Rayment I. X-ray crystal structure of the yeast Kar3 motor domain complexed with Mg.ADP to 2.3 A resolution. Biochemistry. 1998;37(7):1769–1776. doi: 10.1021/bi972504o. [DOI] [PubMed] [Google Scholar]
- Harris JA, Liu Y, Yang P, Kner P, Lechtreck KF. Single-particle imaging reveals intraflagellar transport-independent transport and accumulation of EB1 in Chlamydomonas flagella. Mol Biol Cell. 2016;27(2):295–307. doi: 10.1091/mbc.E15-08-0608. [DOI] [PMC free article] [PubMed] [Google Scholar]
- He M, Subramanian R, Bangs F, Omelchenko T, Liem KF, Jr, Kapoor TM, et al. The kinesin-4 protein Kif7 regulates mammalian Hedgehog signalling by organizing the cilium tip compartment. Nat Cell Biol. 2014;16(7):663–672. doi: 10.1038/ncb2988. [DOI] [PMC free article] [PubMed] [Google Scholar]
- Insinna C, Pathak N, Perkins B, Drummond I, Besharse JC. The homodimeric kinesin, Kif17, is essential for vertebrate photoreceptor sensory outer segment development. Dev Biol. 2008;316(1):160–170. doi: 10.1016/j.ydbio.2008.01.025. [DOI] [PMC free article] [PubMed] [Google Scholar]
- Insinna C, Humby M, Sedmak T, Wolfrum U, Besharse JC. Different roles for KIF17 and kinesin II in photoreceptor development and maintenance. Dev Dyn. 2009;238(9):2211–2222. doi: 10.1002/dvdy.21956. [DOI] [PMC free article] [PubMed] [Google Scholar]
- Jiang L, Tam BM, Ying G, Wu S, Hauswirth WW, Frederick JM, et al. Kinesin family 17 (osmotic avoidance abnormal-3) is dispensable for photoreceptor morphology and function. FASEB J. 2015;29(12):4866–4880. doi: 10.1096/fj.15-275677. [DOI] [PMC free article] [PubMed] [Google Scholar]
- Kay JN, Link BA, Baier H. Staggered cell-intrinsic timing of ath5 expression underlies the wave of ganglion cell neurogenesis in the zebrafish retina. Development. 2005;132(11):2573–2585. doi: 10.1242/dev.01831. [DOI] [PubMed] [Google Scholar]
- Kok FO, Shin M, Ni CW, Gupta A, Grosse AS, van Impel A, et al. 12. Reverse genetic screening reveals poor correlation between morpholino-induced and mutant phenotypes in zebrafish. Dev Cell. 2015;32(1):97–108. doi: 10.1016/j.devcel.2014.11.018. [DOI] [PMC free article] [PubMed] [Google Scholar]
- LaVail MM. Kinetics of rod outer segment renewal in the developing mouse retina. J Cell Biol. 1973;58(3):650–661. doi: 10.1083/jcb.58.3.650. [DOI] [PMC free article] [PubMed] [Google Scholar]
- Mattapallil MJ, Wawrousek EF, Chan CC, Zhao H, Roychoudhury J, Ferguson TA, et al. The Rd8 mutation of the Crb1 gene is present in vendor lines of C57BL/6N mice and embryonic stem cells, and confounds ocular induced mutant phenotypes. Invest Ophthalmol Vis Sci. 2012;53(6):2921–2927. doi: 10.1167/iovs.12-9662. [DOI] [PMC free article] [PubMed] [Google Scholar]
- Maurya AK, Ben J, Zhao Z, Lee RT, Niah W, Ng AS, et al. Positive and negative regulation of Gli activity by Kif7 in the zebrafish embryo. PLoS Genet. 2013;9(12):e1003955. doi: 10.1371/journal.pgen.1003955. [DOI] [PMC free article] [PubMed] [Google Scholar]
- Papermaster DS, Schneider BG, Besharse JC. Vesicular transport of newly synthesized opsin from the Golgi apparatus toward the rod outer segment. Ultrastructural immunocytochemical and autoradiographic evidence in Xenopus retinas. Invest Ophthalmol Vis Sci. 1985;26(10):1386–1404. [PubMed] [Google Scholar]
- Pazour GJ, Wilkerson CG, Witman GB. A dynein light chain is essential for the retrograde particle movement of intraflagellar transport (IFT) J Cell Biol. 1998;141(4):979–992. doi: 10.1083/jcb.141.4.979. [DOI] [PMC free article] [PubMed] [Google Scholar]
- Pazour GJ, Baker SA, Deane JA, Cole DG, Dickert BL, Rosenbaum JL, et al. The intraflagellar transport protein, IFT88, is essential for vertebrate photoreceptor assembly and maintenance. J Cell Biol. 2002;157(1):103–114. doi: 10.1083/jcb.200107108. [DOI] [PMC free article] [PubMed] [Google Scholar]
- Pooranachandran N, Malicki JJ. Unexpected Roles for Ciliary Kinesins and Intraflagellar Transport Proteins. Genetics. 2016;203(2):771–785. doi: 10.1534/genetics.115.180943. [DOI] [PMC free article] [PubMed] [Google Scholar]
- Pugh EN, Jr, Lamb TD. Amplification and kinetics of the activation steps in phototransduction. Biochim Biophys. Acta. 1993;1141(2–3):111–149. doi: 10.1016/0005-2728(93)90038-h. [DOI] [PubMed] [Google Scholar]
- Rohlich P. The sensory cilium of retinal rods is analogous to the transitional zone of motile cilia. Cell Tissue Res. 1975;161(3):421–430. doi: 10.1007/BF00220009. [DOI] [PubMed] [Google Scholar]
- Rossi A, Kontarakis Z, Gerri C, Nolte H, Holper S, Kruger M, et al. Genetic compensation induced by deleterious mutations but not gene knockdowns. Nature. 2015;524(7564):230–233. doi: 10.1038/nature14580. [DOI] [PubMed] [Google Scholar]
- Skarnes WC, Rosen B, West AP, Koutsourakis M, Bushell W, Iyer V, et al. A conditional knockout resource for the genome-wide study of mouse gene function. Nature. 2011;474(7351):337–342. doi: 10.1038/nature10163. [DOI] [PMC free article] [PubMed] [Google Scholar]
- Snow JJ, Ou G, Gunnarson AL, Walker MR, Zhou HM, Brust-Mascher I, et al. Two anterograde intraflagellar transport motors cooperate to build sensory cilia on C. elegans neurons. Nat Cell Biol. 2004;6(11):1109–1113. doi: 10.1038/ncb1186. [DOI] [PubMed] [Google Scholar]
- Stenkamp DL, Frey RA, Prabhudesai SN, Raymond PA. Function for Hedgehog genes in zebrafish retinal development. Dev Biol. 2000;220(2):238–252. doi: 10.1006/dbio.2000.9629. [DOI] [PubMed] [Google Scholar]
- Testa G, Schaft J, van der Hoeven F, Glaser S, Anastassiadis K, Zhang Y, et al. A reliable lacZ expression reporter cassette for multipurpose, knockout-first alleles. Genesis. 2004;38(3):151–158. doi: 10.1002/gene.20012. [DOI] [PubMed] [Google Scholar]
- Ye F, Breslow DK, Koslover EF, Spakowitz AJ, Nelson WJ, Nachury MV. Single molecule imaging reveals a major role for diffusion in the exploration of ciliary space by signaling receptors. Elife. 2013;2:e00654. doi: 10.7554/eLife.00654. [DOI] [PMC free article] [PubMed] [Google Scholar]
- Young RW. The renewal of photoreceptor cell outer segments. J Cell Biol. 1967;33(1):61–72. doi: 10.1083/jcb.33.1.61. [DOI] [PMC free article] [PubMed] [Google Scholar]
- Zhao C, Omori Y, Brodowska K, Kovach P, Malicki J. Kinesin-2 family in vertebrate ciliogenesis. Proc Natl Acad Sci USA. 2012;109(7):2388–2393. doi: 10.1073/pnas.1116035109. [DOI] [PMC free article] [PubMed] [Google Scholar]
Associated Data
This section collects any data citations, data availability statements, or supplementary materials included in this article.