Abstract
The essential role of thyroid hormone (TH) signaling in mammalian development warrants the examination of man-made chemicals for its disruption. Among vertebrate species, the molecular components of TH signaling are highly conserved, including the thyroid hormone receptors (TRs), their heterodimer binding partners the retinoid-X receptors (RXRs), and their DNA recognition sequences (TREs). This molecular conservation allows examination of potential TH disruption in the tractable, in vivo model system of amphibian metamorphosis. Metamorphosis requires TH signaling for both instigation and progression, and it provides dramatic and well-characterized phenotypes involving different cell fates. Here we describe a quantitative, precocious-metamorphosis assay suite we developed using one-week post-fertilization (PF) Xenopus laevis tadpoles in order to assess disruption of TH signaling. Tadpoles at this developmental stage (Nieuwkoop-Faber (NF)-48) are competent to respond to TH hormone, although not yet producing TH, along many metamorphic pathways, and they are uniform in size. This allowed us to quantify changes in morphology associated with natural metamorphosis (e.g. gill and tail resorption, brain expansion, and craniofacial remodeling) after five days of treatment. Using the same tadpoles from morphological measurements, we quantified a 20-fold increase in TH-induced cellular proliferation in the rostral head region by whole-mount immunocytochemistry. At the molecular level, we used F3-generation tadpoles from a transgenic X. laevis line, which expresses luciferase under the control of a native TRE, to assess the ability of compounds to disrupt TR function. The luciferase reporter showed over 10-fold activation by physiologic concentrations of TH. We used the synthetic TR antagonist NH-3 to demonstrate the feasibility of our assay suite to measure inhibition of TH activity at the level of the receptor. Finally, we assessed the capabilities of suspected TH-disrupting chemicals tetrabrominated diphenyl ether 47 (BDE-47) and tetrabromobisphenol A (TBBPA). We found that BDE-47 displays general toxicity rather than TH disruption, as it did not increase brain width nor affect the TRE-luciferase reporter. However, TBBPA, a suspected TR antagonist, although not effective in antagonizing cell proliferation, significantly inhibited the TRE-luciferase reporter, suggesting that it bears closer scrutiny as a TH disruptor. Overall the assay suite has important advantages over the classical tadpole metamorphosis assays with respect to the uniformity of animal size, small test volume, reproducibility, and short test period. The assays are performed before endogenous TH production and free feeding start, which further reduces complexity and variability.
Keywords: endocrine disruption, thyroid hormone, Xenopus laevis, amphibian metamorphosis, flame retardants
1. Introduction
In vertebrates, appropriately timed and dosed signaling by thyroid hormone (TH) is essential to proper development; therefore, the potential for man-made chemicals prevalent in the environment to affect TH signaling needs to be addressed (1). The best understood mechanism by which TH affects development is through binding to the thyroid hormone receptors (TRs), which are transcription factors that regulate gene expression differentially depending upon whether or not TH is present, and therefore bound, at sufficient levels. However, screening chemicals for in vivo disruption of TH signaling in mammals is hampered by both maternal effects and intrauterine development.
Amphibian metamorphosis provides an accessible and dramatic developmental model to circumvent the problems inherent in studying TH signaling during development in mammals (2–4). Metamorphosis requires TH for induction and progression to completion, and it involves tissue remodeling, resorption and growth; therefore, on the cellular level, it entails multiple cell fates. Furthermore, THs are identical across the vertebrate classes, and the TRs are very highly conserved between human and frog (2). Both frogs and mammals express TRs from two distinct genetic loci, TRα and TRβ (5). Given the conservation of the TH-signaling pathway from frog to humans and the exquisite specificity of metamorphosis for TH, the EPA (US Environmental Protection Agency) and OECD (Organisation for Economic Co-operation and Development) proposed the development of the Amphibian Metamorphosis Assay (AMA) as a Tier 1 battery component for endocrine disrupting chemicals (6). However, the assay is time consuming, and the speed of development differs among tadpoles (7). Therefore, that assay requires a large number of animals, large water volumes, and large amounts of the compounds of interest, thereby creating considerable chemical waste. It also recommends a specialized flow-through water supply not available in many laboratories. The assay relies heavily on limb development as a primary endpoint for developmental staging along with thyroid histology, yet it does not provide direct mode of action information. Recently, an extension of the AMA was proposed that includes embryonic exposures through spontaneous metamorphosis to juveniles, termed the Larval Amphibian Growth and Development assay (LAGDA)(8,9). We set out to develop a quantitative, accelerated, in vivo assay suite, specifically geared for disruption of TH signaling, that functions at several levels of specificity, has ease-of-use, and is low cost.
1.1 Assay Suite
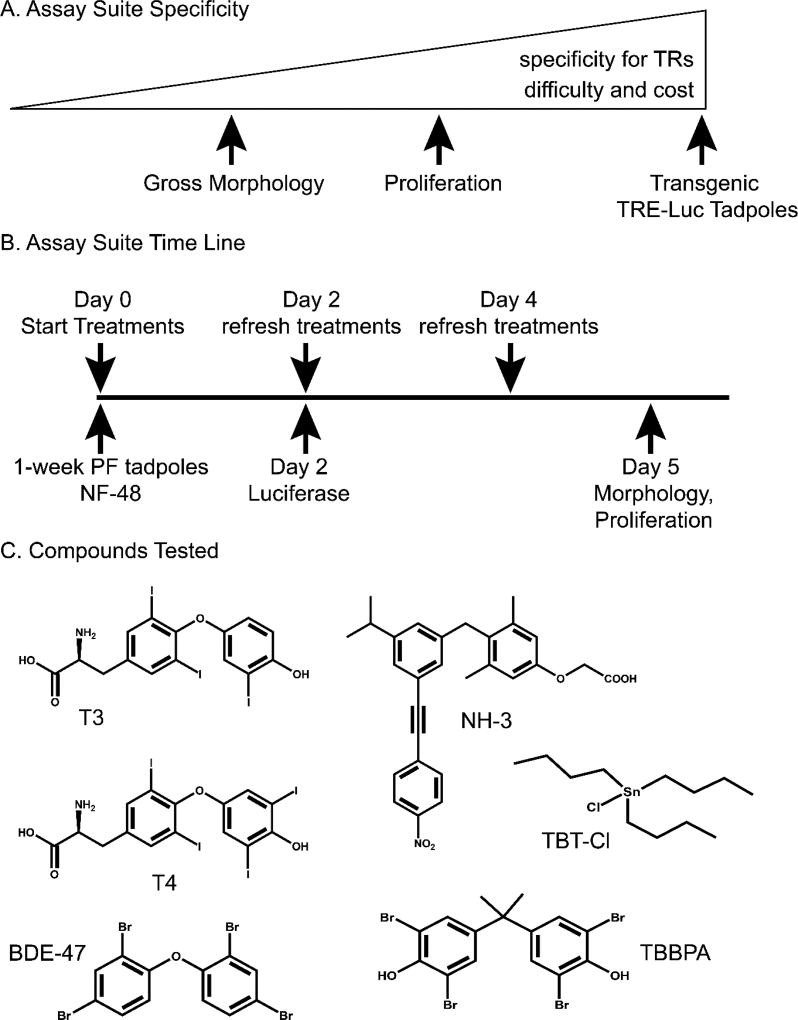
The assay suite we devised comprises three assays of increasing specificity: 1) morphological changes, 2) cellular proliferation in the rostral head region (RHR), and 3) activation of a thyroid-hormone-response-element-driven luciferase reporter (TRE-luc) in transgenic tadpoles (Figure 1A). These three assays provide data on TH-signaling perturbations at the physiological, cellular, and molecular level.
Figure 1.
A. Specificity for TR activity increases with technical difficulty and cost of the assays. B. One-week post-fertilization (PF) tadpoles are treated for 2–5 days, depending upon the assay, before assessing outcomes. TRE-luc: thyroid hormone response element driven luciferase reporter construct. NF-48: Nieuwkoop-Faber X. laevis developmental stage 48. C. Compounds used in this study: T3, 3,3’,5-triiodol-thyronine; T4, thyroxine; BDE-47, tetrabrominated diphenyl ether 47; TBBPA, tetrabromobisphenol A; TBT-Cl, tributyltin chloride; NH-3, synthetic TR antagonist.
We chose to use a precocious, induced metamorphosis assay using tadpoles one-week post fertilization (PF) (Nieuwkoop-Faber (NF) stage 48) for several reasons. First, under regular laboratory conditions, tadpoles remain very synchronized at one-week PF in terms of developmental stage and size. Second, there are no feeding complications, and the compounds to be assayed can simply be added to the rearing water, given sufficient water solubility. Finally, the NF-48 tadpoles are competent to respond to TH in many tissues, including the brain, even though they are not yet producing their own TH. These characteristics allow for a very clean and simple in vivo assay system (Figure 1B).
TH-induced changes in head morphology and tail length are potentially the least specific, as general toxicity can inhibit growth, but they comprise the technically easiest and least expensive assay. We will show that using NF-48 tadpoles allows for quantitative analysis of 1) gill resorption by decreasing head area, 2) rostral head remodeling by shortening of the distance between the olfactory organ and the brain, 3) brain remodeling by increasing width at the optic tectum, and 4) tail resorption by decreasing length. Animals that were used for morphological measurements can also be assayed by whole mount immunocytochemistry. Proliferation can be measured and counted as cells positive for phosphorylation of serine 10 of histone 3, a known marker for cells going through mitosis (10). We will show that TH-induced proliferation in the rostral head region is quantifiable in a concentration dependent manner.
In X. laevis, we developed a transgenic reporter line for TH signaling that bears an integrated luciferase gene under the direction of tandem TREs from X. laevis thibz (TH/bZIP) in a background of the minimal mouse mammary tumor virus promoter (11). The TRE-luc construct cosegregates with GFP expression driven by the γ-crystallin promoter, allowing screening of luciferase-positive animals by monitoring GFP expression in the eye, which becomes readily visible by NF-48 (12). Mating F2 transgenic males with wild-type females results in 50% GFP+/Luc+ progeny (consistent with a single integration) for TRE-luc activation analysis. Non-transgenic siblings (GFP−/Luc−) can be used for morphology and whole mount immunocytochemistry experiments.
1.2 Compounds
To validate our assays, we used T3, the active form of TH, and T4, the more prevalent, circulating form of TH, which requires the activity of cellular deiodinase 2 to convert it to active T3. We used the TR antagonist NH-3 from a new synthesis that eliminates an agonistic co-purifying compound (13) to validate the assays for antagonism. We also tested three persistent organic pollutants that are ubiquitous in the environment and have been suggested to disrupt TH signaling: the flame retardants tetrabromobisphenol A (TBBPA) (14–16) and tetrabrominated diphenyl ether 47 (BDE-47) (17,18) and the biocide tributyltin (TBT) (19). All compound structures are shown in Figure 1C.
2. Materials and Methods
2.1 Chemicals
All chemicals, except NH-3, were purchased from Sigma-Aldrich (St. Louis, MO) and dissolved as 1 mM (T3, T4) or 10 mM (all other compounds) stocks in DMSO. Stocks were stored at −20 C. T3 and T4 stock concentrations were verified by spectroscopy (20). NH-3 was synthesized by the Wulff laboratory at UC Davis (13). oLH (ovine luteinizing hormone) was purchased through the National Hormone and Peptide Program (Los Angeles, CA), pregnant mare serum gonadoptropin (PMSG) was purchased from Sigma-Aldrich, and tricaine methansulfonate was purchased from Western Medical Supply (Arcadia, CA).
2.2 Animal Husbandry, Exposure and Handling
All experiments and animal husbandry were performed using an approved UC Davis Institutional Animal Care and Use Protocol covering transgenic and wild-type Xenopus laevis. Wild-type females were primed with 50 IU PMSG 48–96 hours prior to mating, and ovulation was induced using 200 µg of oLH immediately prior to being paired overnight with a wild-type or transgenic male frog. Embryos were collected, jelly coats were removed with 2% L-cysteine incubation, and healthy embryos were sorted into 0.1× MMR (Mark’s Modified Ringer’s solution, 10 mM NaCl, 0.2 mM KCl, 0.1 mM MgCl2, 0.2 mM CaCl2, 0.5 mM HEPES, pH 7.5) containing 50 µg/ml gentamycin and incubated at 20 °C for two days before being maintained at room temperature. Viable embryos/animals were sorted for the first three days into fresh 0.1× MMR. Days 4–7 the tadpoles were grown in 3-liter aquaria in 0.1× MMR with approximately 300 tadpoles each. One-week post-fertilization (PF) tadpoles (NF-48) were treated in groups of 5 tadpoles per 40 ml of 0.1× MMR in glass beakers (8 ml/tadpole) containing vehicle (DMSO) or compounds. DMSO was kept at 0.2% in all cases. Treatments lasted five days unless otherwise indicated; rearing water and compound treatments were refreshed every two days. At the end of the treatment period, tadpoles were euthanized with 0.1% tricaine methanesulfonate/0.1% sodium bicarbonate in 0.1× MMR, fixed in 4% formaldehyde/0.7× PBS, and stored at 4 °C. Unless mentioned specifically in the results (e.g. 500 nM BDE-47 or 2 µM TBBPA), treatment conditions did not result in animal mortality.
2.3 Morphological Measurements
Dorsal-head and whole-animal photos were taken and measured as described (19). Head area, olfactory organ to brain distance, and brain width at the optic tectum were measured using ImageJ64 (http://imagej.nih.gov/ij/). Box and whisker plots and statistics were computed using GraphPad Prism 7. Whiskers illustrate the maximum and minimum values. For statistics, each outbred tadpole was treated as an individual (n = 15), and three clutches (each of 5 tadpoles per treatment) were independently assayed to control for clutch-to-clutch variation. 1-Way ANOVA with Dunnet’s or Sidak’s Multiple Comparison Test (MCT) was used to determine significance.
2.4 Whole Mount Immunocytochemistry for Proliferation
Fixed tadpoles from morphological analyses were treated as described for whole mount immunocytochemical analysis of phospho-Ser10-Histone 3(10) and the rostral head region (RHR) was photographed as described (19). Positive cells were counted using the Cell Counter tool of ImageJ64.
2.5 TRE-Luciferase Reporter Frogs and Assays
TH-responsive transgenic-reporter frogs were developed essentially as described (21) through mixing of sperm nuclei with two constructs: a) luciferase under the control of the tandem TREs from the thibz gene (11) in the background of a minimal MTV promoter; and b) GFP driven by the γ-crystallin promoter (12). The nuclei were transplanted into unfertilized eggs and the resulting, normally-developing tadpoles were screened for lens-specific GFP expression. An F0 adult female with co-segregation of GFP and luciferase showed germline transmission. γ-crystallin-driven GFP cosegregates with the TRE-luciferase reporter in the male F2 generation. Matings between F2, transgenic males with wild-type females resulted in 50% transgenic animals. GFP+ tadpoles were sorted using a Leica MZFLIII microscope connected to an EXFO X-Cite 120 Fluorescence Illumination System, and were treated with compounds as for morphology, except treatments lasted 48 h. After euthanasia tadpoles were decapitated and heads were processed for luciferase activity and normalized to protein concentration as described (19).
3. Results
Figure 1B shows the time line for treatments and harvesting for the different assays. Routinely, we harvested for morphology and whole mount immunocytochemistry on Day 5, and we harvested for luciferase activation on Day 2.
3.1 Morphology changes induced by T3 and T4
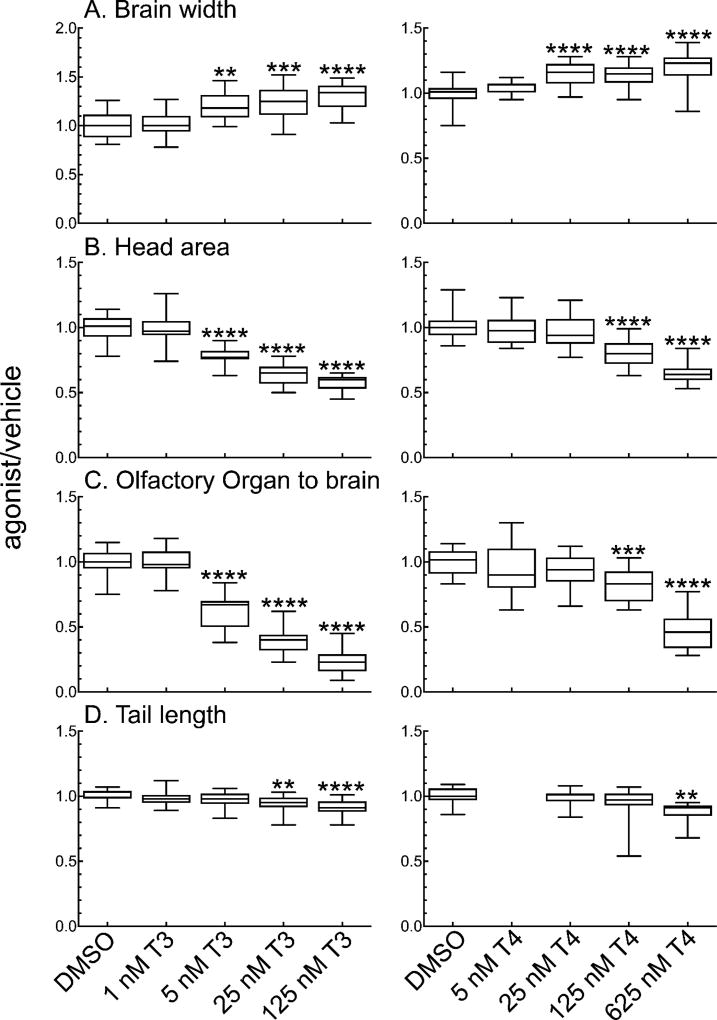
We treated tadpoles 1-week PF with a series of concentrations of T3 or T4, which did not result in any mortality over five days of treatment. Measurements from dorsal-view photographs show that T3 and T4 induce increases in the width of the optic tectum (Figure 2A) in comparison to vehicle (DMSO), which are significant at physiological concentrations for each hormone. TH induces gill resorption, and measuring the head area provides a proxy measurement for resorption, as resorption causes a decrease in head area (10,22). Both T3 and T4 induce decreases in head area in a concentration dependent manner (Figure 2B). The tadpoles are less sensitive to T4 induction of gill resorption than of brain width increase, as 125 nM T4, rather than 25 nM, is necessary to induce a significant decrease in head area. Significant head area reduction is induced by 5 nM T3, with higher T3 concentrations resulting in further reductions. The distance from the olfactory organ to the brain follows the same concentration response as head area for both T3 and T4 (Figure 2C). Tail length is the least sensitive to either form of the hormone, requiring 25 nM T3 or 625 nM T4 to show a significant decrease in tail length (Figure 2D).
Figure 2.
T3 and T4 affect the morphology of NF-48 tadpoles in a concentration-dependent manner. A–D: Effects of varying T3 concentration are shown in the left panel; effects of varying concentrations of T4, in the right panel. A. Brain width at the widest part of the optic tectum. B. Head area. C. Distance between the olfactory organ and the brain. D. Tail length. Boxes represent the 25th–75th percentile values, and the line is at the median; whiskers show maximum and minimum values (n = 15). Significantly different from vehicle control at **, p < 0.01; ***, p<0.001; ****, p<0.0001 as determined by 1-way ANOVA with Dunnett’s multiple comparison test (MCT).
3.2 Cellular proliferation
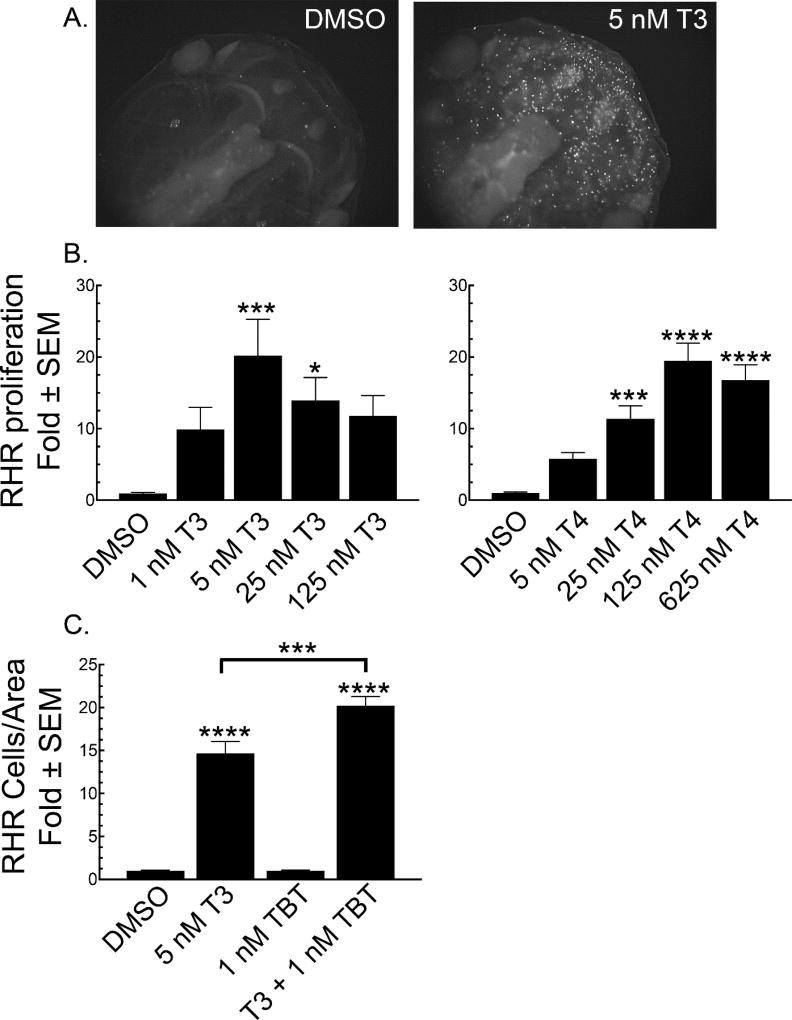
Nuclear localization of the histone 3 makes possible quantifying the number of cells positive for phosphorylation of serine 10 of histone 3, a proliferation biomarker (Figure 3A) (10). Figure 3B shows that increased proliferation in the RHR is significant at physiological concentrations of T3 and T4. Previously, we demonstrated that the trialkyltins that can function as RXR agonists, like TBT (Figure 1C), greatly potentiate the effect of T3 on NF-48 tadpoles when assaying resorption phenotypes morphologically and genetically (19). Figure 2C shows that 1 nM TBT co-treatment with 5 nM T3 significantly potentiates cellular proliferation in the RHR as a function of the RHR area after four days of treatment when compared to treatment with 5 nM T3 alone. Due to the great potentiation by TBT in the resorption phenotypes, it is necessary to reduce tadpole exposure to four days, as most of the RHR is no longer visible from the dorsal plane at 5 days (19). Furthermore, it is necessary to correct for the greater decrease in RHR area of the T3-TBT co-treatment, which are significantly reduced compared to the RHR area of the T3-only treated tadpoles (19).
Figure 3.
T3 and T4 increase cellular proliferation in the rostral head area (RHR). A. Representative photomicrographs comparing the extent of phospho-Ser10 H3 staining in tadpoles treated for 5 days with vehicle (DMSO) or 5 nM T3. B. Quantification of RHR proliferation over a T3 (left panel) or T4 (right panel) concentration range normalized to vehicle (DMSO) control. C. The potentiation of RHR proliferation by co-treatment of 5 nM T3 with 1 nM TBT for four days and normalized to the resulting RHR area. Bars represent the mean with standard error (n = 15). Significantly different from vehicle control at *, p < 0.05; ***, p<0.001; ****, p<0.0001 as determined by 1-way ANOVA with Dunnett’s (for T3 or T4 alone) or Sidak’s (for T3-TBT) multiple comparison test (MCT).
3.3 Luciferase Activation
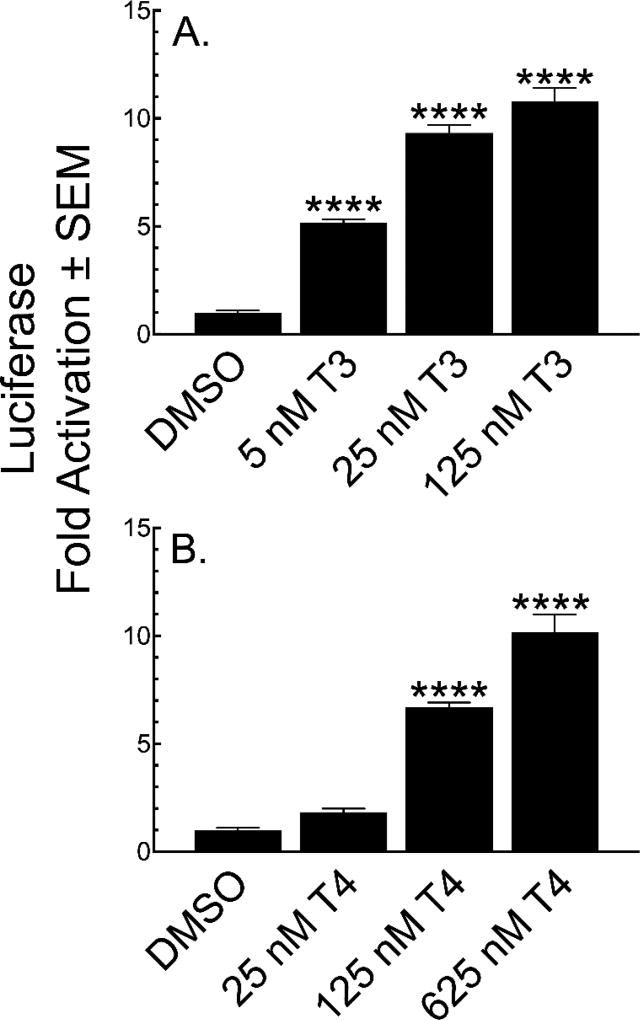
We assayed T3- and T4-induced luciferase activity in heads after two days of treatment over a concentration range for each hormone. Treatment with 5 nM T3 causes significant activation of the reporter, which further increases with concentration (Figure 4A). The luciferase activation responses are remarkably parallel to the dorsal head morphological changes (Figure 2A–C), including decreased sensitivity to T4 (Figure 4B). RHR proliferation (Figure 3B) and increased width at the optic tectum (Figure 2A) are more sensitive to T3 and T4 than the reporter gene assay.
Figure 4.
T3 and T4 activate the TRE-luc reporter in a concentration dependent manner. Transgenic tadpoles (GFP+ eyes) were treated at NF-48 for two days with T3 (A) or T4 (B) and luciferase activity was normalized to protein concentration and then compared to vehicle (DMSO). Bars represent the mean with standard error (n = 15). Significantly different from vehicle control at ****, p<0.0001 as determined by 1-way ANOVA with Dunnetts’s multiple comparison test (MCT).
3.4 BDE-47
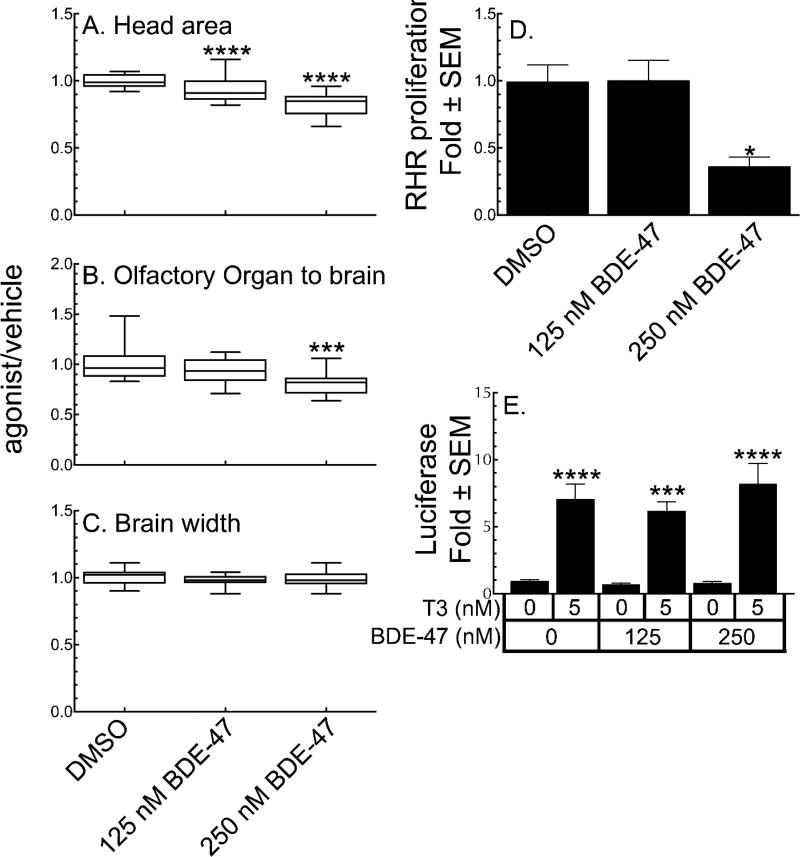
BDE-47 concentrations greater than 500 nM result in high levels of tadpole mortality, suggesting general toxicity, so we tested lower concentrations to see if we could see TH-signaling disruption before general toxicity became the dominant problem. When quantifying changes to dorsal head morphology, head area is significantly decreased at 125 nM BDE-47 (Figure 5A), and olfactory organ to brain distance is significantly smaller at 250 nM BDE-47 (Figure 5B). However, BDE-47 has no effect on the width of the optic tectum (Figure 5C). Although, 250 nM BDE-47 significantly inhibits cellular proliferation in the RHR (Figure 5D), it neither activates the TRE-Luc reporter on its own (agonist activity), nor inhibits activation by 5nM T3 (antagonist activity, Figure 5E).
Figure 5.
BDE-47 functions as a false positive for TH signaling. A–C. Morphological endpoints, presented as a ratio of effects of BDE-47 vs. vehicle control. Boxes represent the 25th–75th percentile values, and the line is at the median; whiskers show maximum and minimum values (n = 15). D. Effect of BDE-47 on cellular proliferation in the RHR. E. Effect of BDE-47 on TRE-luc activation in tadpole heads in both agonist and antagonist modes. Bars represent the mean with standard error (n = 15). Significantly different from vehicle control at *, p < 0.05; ***, p<0.001; ****, p<0.0001 as determined by 1-way ANOVA with Sidak’s multiple comparison test (MCT).
3.5 Antagonists
3.5.1 Synthetic antagonist NH-3
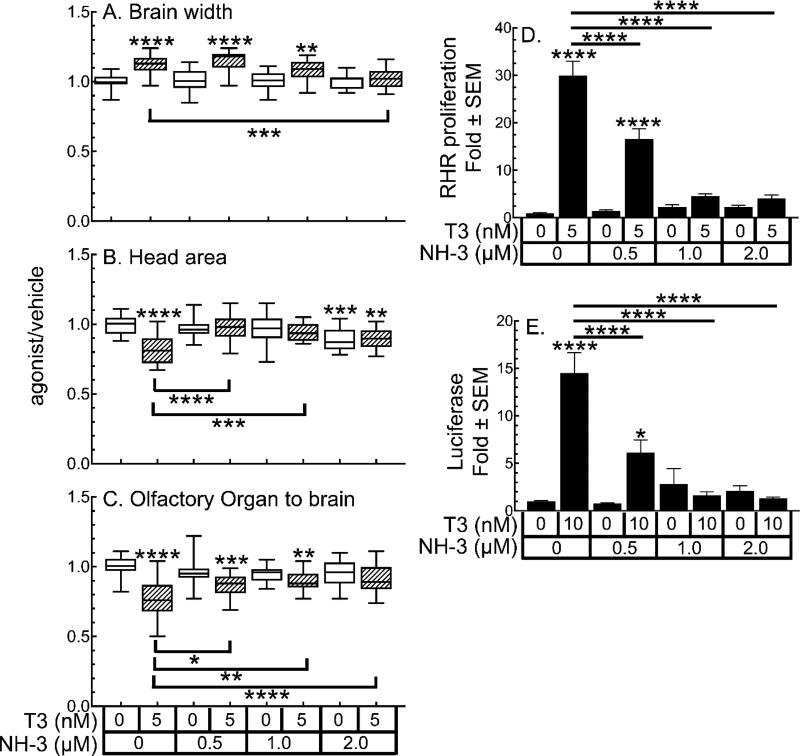
Previously, we had shown that the synthetic TR antagonist NH-3 at low micromolar concentrations inhibits both natural and T3-induced precocious metamorphosis, induced with exogenous T3 (5 nM) in NF-52 tadpoles (23). Using a new, cleaner synthesis of NH-3 (13), we tested whether NH3 antagonized TH-dependent endpoints in our assay suite. At 2 µM, NH-3 significantly inhibits the T3-induced increase in brain width at the optic tectum (Figure 6A). Gill resorption is more sensitive to NH-3 antagonism, with 0.5 and 1 µM NH-3 significantly inhibiting T3 action. At 2 µM, NH-3 significantly decreases head area in the absence of T3, and in the presence of T3 does not cause a significant change from T3 alone (Figure 6B). At all three concentrations tested, NH-3 alone does not affect olfactory organ to brain distance, but it significantly inhibits 5 nM T3-induced effects on this endpoint (Figure 6C).
Figure 6.
Synthetic TR antagonist NH-3 inhibits TH signaling. A-C. Morphological changes induced by 5 nM T3 are inhibited by NH-3. Boxes represent the 25th–75th percentile values, and the line is at the median; whiskers show maximum and minimum values (n = 15). Slashed boxes indicate samples with T3. D. Inhibition of T3-induced cellular proliferation in the RHR by NH-3. E. Inhibition of T3-induced activation of the TRE-Luc reporter in tadpole heads by NH-3. Bars represent the mean with standard error (n = 15). Significantly different from vehicle control at *, p < 0.05; ****, p<0.0001 as determined by 1-way ANOVA with Sidak’s multiple comparison test (MCT).
NH-3 is also effective at inhibiting T3-induced proliferation in the RHR (Figure 6D). At 0.5 µM NH-3, T3-induced proliferation is significantly inhibited by 48%. At 1 or 2 µM, NH-3 inhibits T3-induced proliferation by 80%. In the RHR proliferation assay, 1 and 2 µM NH-3, in the absence of T3, induces proliferation about 2-fold greater than vehicle; however, this level of induction does not reach statistical significance. Paralleling the morphology and proliferation assays, NH-3 is a potent inhibitor of the TRE-Luc reporter (Figure 6E). At 10 nM, T3 activates the reporter by 14-fold, which is inhibited 58% by 0.5 µM NH-3 and 90% by 1 or 2 µM NH-3. As in the proliferation assay, in the absence of T3, 1 or 2 µM NH-3 induces the TRE-Luc approximately 2–3-fold; however, this is not significantly different from vehicle.
3.5.2 Environmental antagonist TBBPA
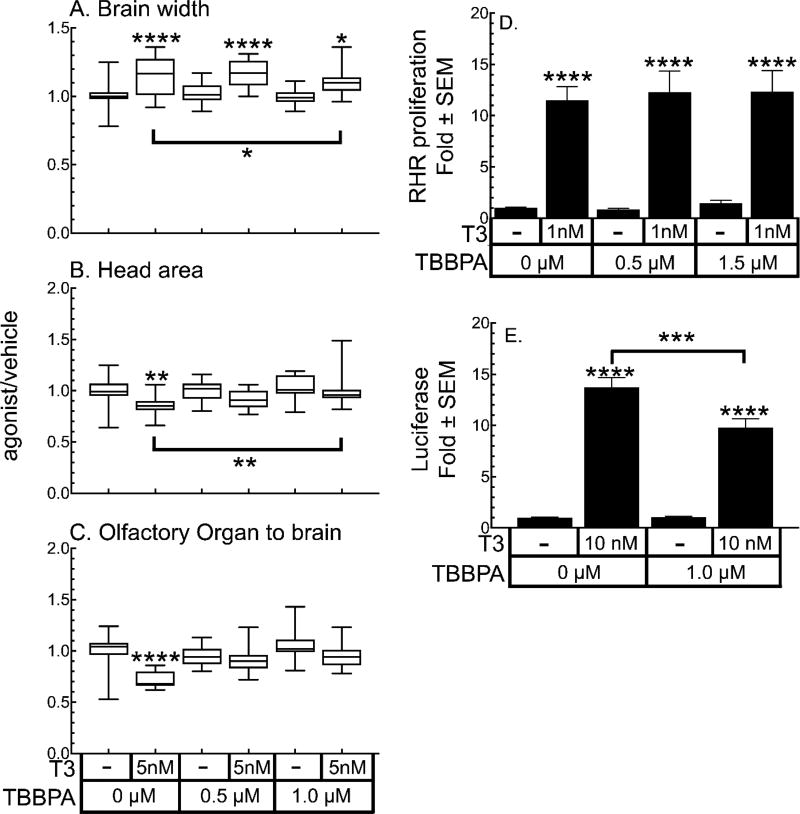
We tested TBBPA in the same manner we used for the TR antagonist NH-3, namely both in the absence and presence of T3. In our hands, 2 µM TBBPA results in high levels of mortality that appears to depend upon the clutch being assayed, which is not a variability we have observed with T3, T4, TBT, or NH-3 (19,23). Therefore, we kept TBBPA concentrations below 2 µM. At 1 µM, TBBPA significantly inhibits T3-induced increases in brain width at the optic tectum (Figure 7A), although brain width is still significantly larger than vehicle controls. At 1 µM, TBBPA also significantly inhibits the T3-induced decrease in head area (Figure 7B); however, the olfactory organ to brain distance is not affected (Figure 7C). TBBPA does not inhibit T3-induced cellular proliferation in the RHR, even when the T3 concentration is reduced to 1 nM T3 (Figure 7D). However, in contrast, 1 µM TBBPA does significantly inhibit 10 nM T3-induced activation of the TRE-Luc reporter by 54% (Figure 7E).
Figure 7.
TBBPA inhibits selected TH-dependent endpoints. A–C. Morphological changes induced by 5 nM T3 are inhibited by TBBPA co-treatment. Boxes represent the 25th–75th percentile values, and the line is at the median; whiskers show maximum and minimum values (n = 15). D. TBBPA does not inhibit cellular proliferation in the RHR induced by 1 nM T3. E. Inhibition of T3-induced activation of the TREluc reporter in tadpole heads by TBBPA. Bars represent the mean with standard error (n = 15). Significantly different from vehicle control at *, p < 0.05; **, p < 0.01; ***, p<0.001; ****, p<0.0001 as determined by 1-way ANOVA with Sidak’s multiple comparison test (MCT).
4. Discussion
The high conservation of the molecular components of TH signaling among all vertebrate classes permits the use of amphibian metamorphosis as a valid and easily accessible model for studying TH signaling and disruption (8,9,14,16). In this study we have presented a suite of three assays to evaluate the potential of compounds to disrupt TH signaling based upon exogenously-added TH-induced precocious metamorphosis. The young NF-48 X. laevis tadpoles we used offer the advantages of uniform size and synchronization of development at one-week PF. Stage NF-48 begins at one-week PF, before the animals begin eating, and continues for several days while the animals do not yet have any significant endogenous TH production; therefore, the issue of a short window of a few hours, in many cases, for screening and treatment using earlier stages is mitigated at NF-48(14). All three assays reveal TH agonism, antagonism, and potentiation of agonist signal (19); and we have developed all three as quantitative assays with significant signal-to-noise ratios to provide ample dynamic range to assess sensitivity. For example, in all three assays, 5 nM T3 (a physiological concentration) gives a significant response compared to vehicle controls. The smallest dynamic range at this concentration of T3 is the increase of brain width (20%), but this still allows ample range for assessing antagonism by NH-3 and TBBPA.
The combination of multiple morphologic parameters, which arise from both apoptotic (i.e. resportion) and proliferative cell fates, increases the power of simple morphological measurements to accurately predict disruption of TH signaling, as a general toxicant is less likely to cause an increase in brain width even though it may result in a smaller head area simply due to inhibiting growth. With the compounds we tested here, we found a high correlation between compounds that affect both brain width and olfactory-organ-to-brain distance and compounds that affect the TRE-Luc reporter, suggesting that quantitative morphological screening is a good first screen for TH disruption.
Aurora kinase B phosphorylates serine10 of histone 3, the epitope in our whole mount immunocytochemistry cellular proliferation assay. It is a very sensitive assay with a wide dynamic range as 5 nM T3 induces a 20-fold increase in the number of positive cells. It costs more and requires more skill and time than measuring morphological changes; however, using a whole mount preparation rather than sections saves considerable time and requires far less skill or specialized equipment. We did not count proliferative cells in the brain in whole mounts, as many of the changes in proliferative cell number happen along the z-axis which cannot be accurately counted using photos taken from a simple dissecting microscope.
In our assay suite, activation of the TRE-luc reporter in the transgenic X. laevis tadpoles provides the highest level of specificity for TH action at the molecular level of the TR. The TRE is robust from the X. laevis thibz gene, and it is widely expressed upon T3-induction in the tadpole (11); we have previously shown that it is a good surrogate for the thibz gene itself (19). Interestingly, the results of the cellular proliferation assay and those of the TRE-Luc reporter do not always coincide. For example, the pollutant TBBPA, although effective in inhibiting the general TRE of the TRE-luc reporter, was not able to inhibit cellular proliferation in the RHR. This result highlights the benefit of using both assays to assess TH disruption.
The strength of using the entire assay suite can be seen best in the results of testing BDE-47. Due to structural similarity to TH, BDE-47 and other polybrominated diphenylethers are widely posited to be TH disruptors (18). Interestingly, in terms of comparing results from the cellular proliferation assay and the TRE-luc assay, we get the opposite effect with BDE-47 than with TBBPA, namely, that BDE-47 inhibits proliferation in the RHR but does not affect the TRE-luc reporter. By coupling these findings with the inability of BDE-47 to increase the brain width, we can conclude that in the NF-48 tadpole, BDE-47 functions as a general toxicant, not as a TH-signaling disruptor. The role of BDE-47 as a TH disruptor has been controversial (18), in part because others have not been able to measure binding of BDE-47 to the TR (24), consistent with our data that it cannot activate the TRE-luc.
We also used the assay suite to validate in vivo a new synthesis of NH-3, a designed TR antagonist. The new synthesis eliminates a copurifying compound that has TR-agonistic activity (13). NH-3 significantly inhibited T3-inductions of all activities with similar efficiency, with the exception of increase in brain width, which required four-times more NH-3 to reach significance. This relatively uniform antagonism across the assay suite highlights the specificity of these assays for TH-signaling pathways. Furthermore, comparison to the antagonism profile of TBBPA, which was not as uniform, highlights the advantages of having multiple readouts for TH disruption, as a lower affinity pollutant may not be equally active in all TH targets. Although the agonistic contaminant is not formed in the new NH-3 synthesis, there is still a small, though not statistically significant, agonist activity by NH-3 in both the cellular proliferation and TRE-luc assays. This is probably due to the design of the NH-3 molecule, which, in addition to preventing co-activators from binding (antagonism), also prevents corepressors from binding (derepression) (25). Interestingly, this small agonistic activity is not seen with TBBPA, which does not have the molecular extension of NH-3 that prevents corepressor binding, although in vitro it was shown to release corepressor from the TR ligand binding domain (26).
5. Conclusions
We have shown that TH-induced precocious metamorphosis of tadpoles one-week PF provides a quantitative, small scale, in vivo model system for assaying potential TH disruptors at morphologic, cellular, and molecular levels. The combination of multiple morphologic parameters, which arise from both apoptotic and proliferative fates, increases the power of simple morphological measurements to accurately predict disruption of TH signaling, as a general toxicant is less likely to cause an increase in brain width, even though it may result in a smaller head area due to inhibiting growth. Whole mount immunocytochemistry for a proliferative biomarker allows quantification of the proliferative cell fate in the remodeling rostral head, which may differ from proliferation in the brain. We are not able with our simple dissecting microscope to quantify proliferation in the ventricles of the brain with reproducible precision, due to the single focal plane of our images. However, with more sophisticated microscopic techniques, this is possible (27). Finally, our TRE-luciferase reporter provides an excellent in vivo model for directly assaying TR activity since it displays a greater than 10-fold activation at physiological TH concentrations. Such a wide dynamic range may be essential for assessing the affects of potential disruptors that most likely do not bind the TR with as high an affinity as the native hormone.
Highlights for AQTOX-D-17-00332.
A Xenopus laevis induced metamorphosis assay suite detects thyroid hormone disruption
Assays quantify thyroid-hormone-induced morphological changes, cellular proliferation, and gene expression.
Tetrabromobisphenol A inhibits a thyroid-hormone-response-element reporter gene in vivo.
Tetrabrominated diphenyl ether 47 toxicity is general, not thyroid hormone signaling specific in these assays.
Acknowledgments
The authors wish to thank A.F. Parlow of the National Hormone and Peptide Program for making oLH available, Kasra Afzali for help with proliferation assay cell counting, and Tammy Ng for tail measurements. This work was supported by the United States Environmental Protection Agency (Grants R835164 to JDF and AJM and RD835550 to PJL) the National Institutes of Health (1R21ES02627); and Dutch ministry of IEnM (Project 601351-REACH).
Footnotes
Publisher's Disclaimer: This is a PDF file of an unedited manuscript that has been accepted for publication. As a service to our customers we are providing this early version of the manuscript. The manuscript will undergo copyediting, typesetting, and review of the resulting proof before it is published in its final citable form. Please note that during the production process errors may be discovered which could affect the content, and all legal disclaimers that apply to the journal pertain.
Declaration of Interest: The authors state that they have no conflicts of interest.
Contributors:
Brenda Mengeling: project design, designed and performed experiments, analyzed data, and wrote the manuscript
Yushu Wei: designed and performed experiments, analyzed data, edited the manuscript
Lucia Dorbrawa: designed and performed experiments, analyzed data, edited the manuscript
Mischa Streekstra: designed and performed experiments, analyzed data, edited the manuscript
Jochem Louisse: designed and created transgenic animals, edited the manuscript
Vikrant Singh: designed and created organic syntheses used in experiments, created figures for the manuscript
Latika Singh: designed and created organic syntheses used in experiments
Pamela J. Lein: project design support, edited the manuscript
Heike Wulff: project design support, edited the manuscript
Albertinka Murk: project design, research support, edited the manuscript
J. David Furlow: project design, designed and performed experiments, analyzed data, research support, edited the manuscript
References
- 1.Gore AC, Chappell VA, Fenton SE, Flaws JA, Nadal A, Prins GS, Toppari J, Zoeller RT. EDC-2: The Endocrine Society's Second Scientific Statement on Endocrine-Disrupting Chemicals. Endocr Rev. 2015;36:E1–E150. doi: 10.1210/er.2015-1010. [DOI] [PMC free article] [PubMed] [Google Scholar]
- 2.Furlow JD, Neff ES. A developmental switch induced by thyroid hormone: Xenopus laevis metamorphosis. Trends Endocrinol Metab. 2006;17:40–47. doi: 10.1016/j.tem.2006.01.007. [DOI] [PubMed] [Google Scholar]
- 3.Brown DD, Wang Z, Kanamori A, Eliceiri B, Furlow JD, Schwartzman R. Amphibian metamorphosis: a complex program of gene expression changes controlled by the thyroid hormone. Recent Prog Horm Res. 1995;50:309–315. doi: 10.1016/b978-0-12-571150-0.50018-4. [DOI] [PubMed] [Google Scholar]
- 4.Sachs LM, Buchholz DR. Frogs model man: In vivo thyroid hormone signaling during development. Genesis. 2017:55. doi: 10.1002/dvg.23000. [DOI] [PubMed] [Google Scholar]
- 5.Yaoita Y, Shi YB, Brown DD. Xenopus laevis alpha and beta thyroid hormone receptors. Proceedings of the National Academy of Sciences of the United States of America. 1990;87:7090–7094. doi: 10.1073/pnas.87.18.7090. [DOI] [PMC free article] [PubMed] [Google Scholar]
- 6.OECD. Test No: 231: Amphibian Metamorphosis Assay. OECD Publishing; [Google Scholar]
- 7.Gutleb AC, Schriks M, Mossink L, Berg JH, Murk AJ. A synchronized amphibian metamorphosis assay as an improved tool to detect thyroid hormone disturbance by endocrine disruptors and apolar sediment extracts. Chemosphere. 2007;70:93–100. doi: 10.1016/j.chemosphere.2007.06.048. [DOI] [PubMed] [Google Scholar]
- 8.Haselman JT, Kosian PA, Korte JJ, Olmstead AW, Iguchi T, Johnson RD, Degitz SJ. Development of the Larval Amphibian Growth and Development Assay: effects of chronic 4-tert-octylphenol or 17beta-trenbolone exposure in Xenopus laevis from embryo to juvenile. Journal of applied toxicology : JAT. 2016;36:1639–1650. doi: 10.1002/jat.3330. [DOI] [PubMed] [Google Scholar]
- 9.Haselman JT, Sakurai M, Watanabe N, Goto Y, Onishi Y, Ito Y, Onoda Y, Kosian PA, Korte JJ, Johnson RD, Iguchi T, Degitz SJ. Development of the Larval Amphibian Growth and Development Assay: Effects of benzophenone-2 exposure in Xenopus laevis from embryo to juvenile. Journal of applied toxicology : JAT. 2016;36:1651–1661. doi: 10.1002/jat.3336. [DOI] [PubMed] [Google Scholar]
- 10.Schreiber AM, Das B, Huang H, Marsh-Armstrong N, Brown DD. Diverse developmental programs of Xenopus laevis metamorphosis are inhibited by a dominant negative thyroid hormone receptor. Proceedings of the National Academy of Sciences of the United States of America. 2001;98:10739–10744. doi: 10.1073/pnas.191361698. [DOI] [PMC free article] [PubMed] [Google Scholar]
- 11.Furlow JD, Brown DD. In vitro and in vivo analysis of the regulation of a transcription factor gene by thyroid hormone during Xenopus laevis metamorphosis. Mol Endocrinol. 1999;13:2076–2089. doi: 10.1210/mend.13.12.0383. [DOI] [PubMed] [Google Scholar]
- 12.Offield MF, Hirsch N, Grainger RM. The development of Xenopus tropicalis transgenic lines and their use in studying lens developmental timing in living embryos. Development. 2000;127:1789–1797. doi: 10.1242/dev.127.9.1789. [DOI] [PubMed] [Google Scholar]
- 13.Singh L, Pressly B, Mengeling BJ, Fettinger JC, Furlow JD, Lein PJ, Wulff H, Singh V. Chasing the Elusive Benzofuran Impurity of the THR Antagonist NH-3: Synthesis, Isotope Labeling, and Biological Activity. J Org Chem. 2016;81:1870–1876. doi: 10.1021/acs.joc.5b02665. [DOI] [PubMed] [Google Scholar]
- 14.Fini JB, Le Mevel S, Turque N, Palmier K, Zalko D, Cravedi JP, Demeneix BA. An in vivo multiwell-based fluorescent screen for monitoring vertebrate thyroid hormone disruption. Environmental science & technology. 2007;41:5908–5914. doi: 10.1021/es0704129. [DOI] [PubMed] [Google Scholar]
- 15.Jagnytsch O, Opitz R, Lutz I, Kloas W. Effects of tetrabromobisphenol A on larval development and thyroid hormone-regulated biomarkers of the amphibian Xenopus laevis. Environ Res. 2006;101:340–348. doi: 10.1016/j.envres.2005.09.006. [DOI] [PubMed] [Google Scholar]
- 16.Zhang YF, Xu W, Lou QQ, Li YY, Zhao YX, Wei WJ, Qin ZF, Wang HL, Li JZ. Tetrabromobisphenol A disrupts vertebrate development via thyroid hormone signaling pathway in a developmental stage-dependent manner. Environmental science & technology. 2014;48:8227–8234. doi: 10.1021/es502366g. [DOI] [PubMed] [Google Scholar]
- 17.Malene B, Ulla F-R, Katharina MM. Thyroid effects of endocrine disrupting chemicals. Mol Cell Endocrinol. 2012;355:240–248. doi: 10.1016/j.mce.2011.09.005. [DOI] [PubMed] [Google Scholar]
- 18.Costa LG, de Laat R, Tagliaferri S, Pellacani C. A mechanistic view of polybrominated diphenyl ether (PBDE) developmental neurotoxicity. Toxicol Lett. 2014;230:282–294. doi: 10.1016/j.toxlet.2013.11.011. [DOI] [PMC free article] [PubMed] [Google Scholar]
- 19.Mengeling BJ, Murk AJ, Furlow JD. Trialkyltin Rexinoid-X Receptor Agonists Selectively Potentiate Thyroid Hormone Induced Programs of Xenopus laevis Metamorphosis. Endocrinology. 2016;157:2712–2723. doi: 10.1210/en.2016-1062. [DOI] [PubMed] [Google Scholar]
- 20.Gemmill CL. The apparent ionization constants of the phenolic hydroxyl groups of thyroxine and related compounds. Arch Biochem Biophys. 1955;54:359–367. doi: 10.1016/0003-9861(55)90048-5. [DOI] [PubMed] [Google Scholar]
- 21.Ishibashi S, Kroll KL, Amaya E. Generating transgenic frog embryos by restriction enzyme mediated integration (REMI) Methods Mol Biol. 2012;917:185–203. doi: 10.1007/978-1-61779-992-1_11. [DOI] [PMC free article] [PubMed] [Google Scholar]
- 22.Fini JB, Riu A, Debrauwer L, Hillenweck A, Le Mevel S, Chevolleau S, Boulahtouf A, Palmier K, Balaguer P, Cravedi JP, Demeneix BA, Zalko D. Parallel biotransformation of tetrabromobisphenol A in Xenopus laevis and mammals: Xenopus as a model for endocrine perturbation studies. Toxicol Sci. 2012;125:359–367. doi: 10.1093/toxsci/kfr312. [DOI] [PubMed] [Google Scholar]
- 23.Lim W, Nguyen NH, Yang HY, Scanlan TS, Furlow JD. A thyroid hormone antagonist that inhibits thyroid hormone action in vivo. J Biol Chem. 2002;277:35664–35670. doi: 10.1074/jbc.M205608200. [DOI] [PubMed] [Google Scholar]
- 24.Suvorov A, Bissonnette C, Takser L, Langlois MF. Does 2,2',4,4'-tetrabromodiphenyl ether interact directly with thyroid receptor? Journal of applied toxicology : JAT. 2011;31:179–184. doi: 10.1002/jat.1580. [DOI] [PubMed] [Google Scholar]
- 25.Nguyen NH, Apriletti JW, Cunha Lima ST, Webb P, Baxter JD, Scanlan TS. Rational design and synthesis of a novel thyroid hormone antagonist that blocks coactivator recruitment. J Med Chem. 2002;45:3310–3320. doi: 10.1021/jm0201013. [DOI] [PubMed] [Google Scholar]
- 26.Levy-Bimbot M, Major G, Courilleau D, Blondeau JP, Levi Y. Tetrabromobisphenol-A disrupts thyroid hormone receptor alpha function in vitro: use of fluorescence polarization to assay corepressor and coactivator peptide binding. Chemosphere. 2012;87:782–788. doi: 10.1016/j.chemosphere.2011.12.080. [DOI] [PubMed] [Google Scholar]
- 27.Thompson CK, Cline HT. Thyroid Hormone Acts Locally to Increase Neurogenesis, Neuronal Differentiation, and Dendritic Arbor Elaboration in the Tadpole Visual System. J Neurosci. 2016;36:10356–10375. doi: 10.1523/JNEUROSCI.4147-15.2016. [DOI] [PMC free article] [PubMed] [Google Scholar]


