

Abstract
Deadenylation is a fundamental process that regulates eukaryotic gene expression. Mammalian deadenylation exhibits biphasic kinetics, with the Pan2–Pan3 and Ccr4–Caf1 deadenylase complexes mediating the first and second phase, respectively; however, the significance of the biphasic nature of deadenylation in mRNA turnover remains unclear. In this study, we discovered that two distinct isoforms of human Pan3 display opposing properties necessary for coordinating the two phases of deadenylation. The shorter isoform (Pan3S) interacts more strongly with PABP than the longer isoform (Pan3L) does. Pan2 deadenylase activity is enhanced by Pan3S but suppressed by Pan3L. Knocking down individual Pan3 isoforms has opposing effects on the global poly(A) tail length profile, P-body formation, and different mRNA decay pathways. Transcriptome-wide analysis of Pan3 knockdown effects on mRNA turnover shows that depleting either Pan3 isoform causes profound and extensive changes in mRNA stability globally. These results reveal a new fundamental step governing mammalian mRNA metabolism. We propose that the first phase of deadenylation, coordinated through the interplay among the two Pan3 isoforms, Pan2, and PABP, represents a cytoplasmic mRNA maturation step important for proper mRNA turnover.
Keywords: P-body, Pan2-Pan3 complex, deadenylation, mRNA turnover, transcriptome regulation
INTRODUCTION
Deadenylation, the removal of poly(A) tails from the 3′ end of mRNAs, is the step that triggers mRNA degradation in eukaryotes (for review, see Chen and Shyu 2011; Wahle and Winkler 2013). One consequence of deadenylation is formation of nontranslatable mRNA–protein complexes (mRNPs), which may aggregate in the cytoplasm to form RNA-processing bodies (P-bodies) in which the mRNAs are sequestered or degraded (for review, see Parker and Sheth 2007; Chen and Shyu 2013). Thus, deadenylation and its regulation play a critical role in controlling gene expression.
Mammalian deadenylation exhibits biphasic kinetics (Yamashita et al. 2005). In the first phase, the 3′ poly(A) tails are shortened to ∼110–150 nt by the Pan2–Pan3 complex, where Pan2 is the catalytic subunit and Pan3 is the regulatory factor. In the second phase, a complex containing the Ccr4 and Caf1 poly(A) nucleases further shortens the poly(A) tails to ∼10–60 nt (Yamashita et al. 2005). The observations that the miRNA–RISC complex accelerates deadenylation by recruiting both the Pan2–Pan3 and Ccr4–Caf1 deadenylase complexes (Chen et al. 2009; Fabian et al. 2009; Braun et al. 2011; Chekulaeva et al. 2011) further underscore the importance of the two-pronged deadenylation in mRNA metabolism. Nevertheless, relatively little is known about the biological significance of the biphasic nature of deadenylation involving two deadenylase complexes or about the regulation of the overall process in mammalian cells. Previous studies using individual reporter mRNAs showed that compromising Pan2–Pan3 deadenylase activity only modestly affects deadenylation (Boeck et al. 1996; Brown et al. 1996; Tucker et al. 2001; Mangus et al. 2004; Yamashita et al. 2005), suggesting that Ccr4–Caf1–Not complex may play a major role in eukaryotic mRNA deadenylation (Chen and Shyu 2011; Wahle and Winkler 2013). This raised a critical issue concerning the functional significance of the first-phase deadenylation and the involvement of the Pan2–Pan3 complex in mRNA metabolism.
Through its interaction with the cytoplasmic poly(A)-binding protein C1 (PABP) (Brown et al. 1996; Mangus et al. 2004; Uchida et al. 2004), Pan3 helps determine the poly(A) substrate specificity of Pan2 (Brown et al. 1996; Mangus et al. 2004; Uchida et al. 2004; Huang et al. 2013). Pan3 also modulates Pan2 enzymatic activity (Jonas et al. 2014; Schäfer et al. 2014; Wolf and Passmore 2014; Wolf et al. 2014). However, little is known about Pan3's primary function and biological role in mRNA turnover. In yeast, Pan3 is crucial for mRNA to acquire the proper length of the 3′ poly(A) tail and it functions as a regulatory factor of deadenylation (Brown et al. 1996; Tucker et al. 2001; Mangus et al. 2004). In mammalian cells, Pan3 has additional roles in P-body formation, including to help recruit Pan2, Ccr4, and Caf1 (Zheng et al. 2008), suggesting a role of Pan3 in early mRNP remodeling essential for determining the subsequent cytoplasmic fate of mRNA. Several recent structural and in vitro studies also provided new insight into the organization of Pan2–Pan3 complex and support a pivotal role for Pan3 as the regulatory subunit of the complex (Christie et al. 2013; Jonas et al. 2014; Schäfer et al. 2014; Wolf et al. 2014). However, a large portion of the N-terminal domain was not present in the Pan3 fragment used for the structural studies (Christie et al. 2013; Jonas et al. 2014; Schäfer et al. 2014; Wolf et al. 2014). The N-terminal domain of Pan3 contains a PABP-interacting motif 2 (PAM2) and has the potential to form flexible interfaces for eliciting protein–protein and protein–RNA interactions due to its nature of intrinsic disorder (Mangus et al. 2004; Siddiqui et al. 2007; Huang et al. 2013). Therefore, it is crucial to include the N-terminal domain of Pan3 to study the in vivo functions of Pan3.
In this study, we discovered that human Pan3 has two functionally distinct isoforms that are conserved in warm-blooded vertebrates. The longer isoform contains an extra 55-amino acid segment in the N-terminal domain immediately upstream of the PABP-interacting motif, PAM2. Using a series of complementary approaches, we examined how the two isoforms may coordinate to regulate deadenylation and their influence on P-body formation, mRNA decay pathways, and related cellular functions. Our results demonstrate an essential role of the N-terminal domain in conferring the opposing molecular functions onto the two Pan3 isoforms and provide important new insights into the in vivo roles of Pan3 and the biological significance of the biphasic feature of deadenylation in the regulation of global mRNA turnover.
RESULTS
Two human Pan3 isoforms exhibit different PABP-interacting ability
In the process of cloning human Pan3 cDNA, we identified two distinct Pan3 isoforms (Fig. 1A). The longer Pan3 isoform (Pan3L) contains a 55-amino acid segment that is absent in the shorter Pan3 isoform (Pan3S). This Pan3L-specific segment is located immediately upstream of the PABP-interacting motif PAM2 in the N-terminal domain. RT-PCR analysis confirmed the presence of two major Pan3 transcripts in various human cell lines (Fig. 1B). Multiple sequence alignment analysis using ClustalX (Larkin et al. 2007) reveals that these two isoforms are highly conserved among warm-blooded vertebrates (Supplemental Fig. S1).
FIGURE 1.

Two distinct isoforms of human Pan3 exhibit different interaction strengths with PABP. (A) Schematic diagram of two human Pan3 isoforms. (B) RT-PCR and agarose gel electrophoresis analysis of transcripts for the two Pan3 isoforms in the indicated human cell lines. GAPDH mRNA served as a loading control. (C–G) Coimmunoprecipitation (Co-IP) and Western blot analyses showing that HA-Pan3S pulls down more endogenous PABP than HA-Pan3L does, whereas the two Pan3 isoforms pull down similar amounts of endogenous Pan2 (C); myc-PABP exhibits stronger interaction with HA-Pan3S than with HA-Pan3L (D); HA-Pan3L and HA-Pan3S exhibit a similar ability to interact with Pan2-V5 (E,F); and HA-Pan3S and HA-Pan3L have a similar ability to pull down Pan3S-V5 or Pan3L-V5 (G). NIH3T3 cells were transfected with plasmids expressing the indicated epitope-tagged proteins. GAPDH served as a negative control for co-IP. The amount of each “Input” sample loaded onto the gel was 5% (C,E,F), 3% (D), or 15% (G) of the amount of the corresponding lysate used for IP.
As Pan3 is a PABP-interacting protein (Brown et al. 1996; Uchida et al. 2004; Huang et al. 2013) that regulates Pan2 activity (Brown et al. 1996; Mangus et al. 2004; Uchida et al. 2004; Huang et al. 2013; Jonas et al. 2014; Schäfer et al. 2014; Wolf and Passmore 2014; Wolf et al. 2014), we conducted co-IP experiments to analyze the two Pan3 isoforms’ ability to interact with PABP or Pan2. The results show that HA-Pan3S pulls down much more endogenous PABP than HA-Pan3L does in both mouse NIH3T3 cells and human BEAS-2B cells (Fig. 1C; Supplemental Fig. S2A). Consistently, when HA-Pan3S and HA-Pan3L were coexpressed with myc-PABP, myc-PABP exhibited stronger interaction with Pan3S than with Pan3L (Fig. 1D). On the other hand, both Pan3 isoforms have a similar ability to pull down endogenous or V5-tagged Pan2 (Fig. 1C,E,F; Supplemental Fig. S2B) or other Pan3 molecules (Fig. 1G). Together, we conclude that these two Pan3 isoforms exhibit different PABP-interacting ability, with Pan3S-PABP interaction being stronger than the Pan3L–PABP interaction.
N-terminal domain is critical for the interaction of Pan3 with PABP
To study the contribution of each Pan3 domain to the interactions of Pan3 isoforms with PABP and Pan2, we created a series of domain truncation mutants of both Pan3 isoforms (Fig. 2A) for co-IP experiments using both NIH3T3 and BEAS-2B cells. The data show that Pan3 mutant lacking the N-terminal domain (ΔN) hardly pulls down any endogenous PABP (Fig. 2B; Supplemental Fig. S3). Truncating either one of the pseudokinase or C-terminal domains (ΔK or ΔC) appreciably compromised the PABP-binding ability of Pan3 (Fig. 2C; Supplemental Fig. S3), although not as much as the effect caused by Pan3 ΔN mutant (Fig. 2B; Supplemental Fig. S3). These results indicate that the three domains are all involved in the interaction between Pan3 and PABP. Intriguingly, the N-terminal domain alone (L N- or S N-domain) pulls down a similar amount of PABP as the respective WT Pan3 isoform does (Fig. 2B; Supplemental Fig. S3), whereas the pseudokinase domain and C-terminal domain (either alone or together) could barely interact with PABP (Fig. 2B,C; Supplemental Fig. S3; K-domain, C-domain, or ΔN). Thus, among the three domains, the N-terminal domain is the only one that is sufficient to fully support the PABP-binding activity of Pan3. Together, these results indicate that the N-terminal domain is critical for Pan3 to interact with PABP, and that crosstalk among the three Pan3 domains can influence the PAN3–PABP interaction.
FIGURE 2.

Effects of Pan3 domain truncations on Pan3–PABP and Pan3–Pan2 interactions. (A) Schematic diagram showing various domain truncations of Pan3S and Pan3L. (B,C) Coimmunoprecipitation (Co-IP) and Western blot analyses showing the effects of Pan3 domain truncations on HA-Pan3 isoforms’ abilities to pull down endogenous PABP and Pan2. NIH3T3 cells were transfected with plasmids coding for the indicated epitope-tagged proteins. GAPDH served as the negative control for co-IP. The amount of each “Input” sample loaded onto the gel was 5% of the amount of the corresponding lysate used for IP.
The Pan3 mutant lacking the N-terminal domain remained capable of pulling down Pan2 (Fig. 2B; Supplemental Fig. S3; ΔN). In contrast, truncating either the C-terminal domain or the pseudokinase domain abolished the interaction of Pan3 with Pan2 (Fig. 2C; Supplemental Fig. S3; ΔC or ΔK). None of the individual Pan3 domains alone can pull down Pan2 (Fig. 2; Supplemental Fig. S3; L N-, S N-, K-, or C-domain). These results demonstrate that both pseudokinase and C-terminal domains are necessary for Pan2–Pan3 interaction and that these two Pan3 domains together are sufficient to interact with Pan2. Moreover, the observation that the Pan3 ΔN mutant pulls down less Pan2 than the WT Pan3 does in BEAS-2B cells (Supplemental Fig. S3) indicates that the N-terminal domain of Pan3, albeit not required for Pan2-binding, can also influence the Pan3–Pan2 interaction.
Pan3L and Pan3S have opposite effects on Pan2 deadenylase activity in vivo
Because of the intrinsically disordered nature of the Pan3 N-terminal domain, purification of full-length recombinant Pan3 proteins for in vitro studies has not been successful (Uchida et al. 2004; Siddiqui et al. 2007; Christie et al. 2013; Jonas et al. 2014; Schäfer et al. 2014; Wolf et al. 2014; CYA Chen and AB Shyu unpubl.). In light of our finding that Pan3L and Pan3S display different PABP-binding activities (Fig. 1C,D; Supplemental Fig. S2), we set up a cell-based deadenylation assay (Supplemental Fig. S4) to test the effects of the two Pan3 isoforms on Pan2 deadenylase activity in vivo. β-Globin mRNA constitutively expressed from transfected plasmid DNA in the cells was used as a reporter transcript because it exhibits default slow deadenylation in NIH3T3 cells, which makes any change in its deadenylation kinetics readily discerned (Shyu et al. 1991; Xu et al. 1998). Northern blot analysis showed that Pan2 overexpression reduced the population of β-globin mRNA with a longer poly(A) tail and concomitantly increased the amount of β-globin mRNA with a shorter 3′ poly(A) tail (Fig. 3A, cf. lanes 1 and 2), consistent with our previous observation that overexpression of Pan2 promotes rapid poly(A) shortening (Yamashita et al. 2005). When Pan2 and Pan3S were coexpressed, the accumulation of β-globin mRNA with a shorter poly(A) tail was further enhanced (Fig. 3A, cf. lanes 2 and 4), indicating that Pan3S enhances the deadenylase activity of Pan2. Intriguingly, when Pan2 and Pan3L were coexpressed, there was no accumulation of β-globin mRNA with either very long or very short poly(A) tails (Fig. 3A, lane 3); instead, mRNAs with an intermediate size of ∼150 nt were detected. These results suggest that Pan3L prevents Pan2 from working into the second phase of deadenylation. We obtained similar results using either mouse NIH3T3 or human BEAS-2B cells (Fig. 3A; Supplemental Fig. S5).
FIGURE 3.

Effects of Pan3 isoforms and their domain truncations on Pan2 deadenylase activity in vivo. NIH3T3 cells were transfected with a plasmid coding for HA-Pan2 alone or together with a plasmid coding for one of the HA-tagged WT or truncated Pan3 isoforms. β-Globin mRNA constitutively expressed (A) or transiently induced (B–D) in the same cells served as a reporter transcript. Total cytoplasmic RNA was extracted for Northern blot analysis to check poly(A) size distribution of the β-globin reporter mRNA (upper panels of A,B; upper left panels of C,D). Poly(A)– RNA samples were prepared with oligo(dT) and RNase H treatment. Levels of the indicated HA-tagged proteins were visualized by Western blot analysis (lower panels of A,B; lower left panels of C,D). The poly(A) size distribution profiles (middle panels of A,B; right panels of C,D) were obtained by scanning each lane of the Northern blots using ImageJ software. Red arrows (A,B) highlight changes of the poly(A) size distribution profile. Red and blue dashed lines (C,D) serve as a reference to compare the effects caused by different Pan3 domain truncations on the poly(A) size distribution.
To further investigate the effects of overexpressing Pan3L or Pan3S on the two phases of deadenylation, we used a transcription pulsing approach (Xu et al. 1998; Chen et al. 2008) to monitor deadenylation of newly synthesized mRNAs that are fairly homogenous in their poly(A) tail length (Fig. 3B). β-Globin mRNA transcription driven by the Tet-off promoter was transiently induced for 0.5 h in the cells. The results show that overexpression of Pan2 shortens newly synthesized β-globin mRNAs (Fig. 3B, cf. lanes 1 and 2). Coexpressing Pan3S and Pan2 resulted in an accumulation of mRNAs with a shorter poly(A) tail (Fig. 3B, lane 4). When Pan3L and Pan2 were coexpressed, β-globin mRNAs carrying poly(A) tails with intermediate length accumulated (Fig. 3B, lane 3). These results further substantiate that Pan3L and Pan3S exhibit different effects on Pan2 deadenylase activity in cells, with Pan3S enhancing the nuclease activity of Pan2 and Pan3L preventing Pan2 from working into the second phase of deadenylation, which is normally catalyzed by the Caf1–Ccr4 complex (Yamashita et al. 2005).
Using the transcriptional pulsing approach, we then tested the effects of the N-terminal domain alone or deletion of either one of the three domains, which compromised the binding ability of Pan3 with Pan2 and/or PABP, on Pan2 deadenylase activity (Fig. 3C,D). The results showed that these mutations not only compromise the ability of Pan3S to enhance Pan2 deadenylase activity (Fig. 3C, cf. lanes 4–7 and lane 3) but appear to exhibit a dominant-negative effect on Pan2-mediated deadenylation as well (Fig. 3C, cf. lanes 4–7 and lane 2). On the other hand, the Pan3L mutants remain having negative effects on Pan2 deadenylase activity (Fig. 3D, cf. lanes 4–7 and lane 2). Given that the Pan2-mediated deadenylation enhancing function of Pan3S was compromised when the interaction of Pan3S with PABP or Pan2 was diminished or abolished (Figs. 2, 3C), the Pan3L mutants may cause the negative effects on Pan2 deadenylase activity similarly to the Pan3S mutants (i.e., through routes different from that used by the WT Pan3L to impact Pan2 activity). Together, we conclude that Pan3L and Pan3S have distinct effects on Pan2 deadenylase activity and that both Pan3–PABP and Pan3–Pan2 interactions are critical for regulating the Pan2-mediated deadenylation in vivo.
Pan3L and Pan3S have different impacts on global mRNA deadenylation
As Pan3L and Pan3S differentially modulated the deadenylase activity of Pan2 (Fig. 3; Supplemental Figs. S4, S5), we used a poly(A) length-distribution profile analysis (Fig. 4A) to check the impact of Pan3 isoforms on poly(A) shortening of the entire cellular mRNA population (Fig. 4B). The results showed that at the steady state the poly(A) length profile of mRNAs extracted from the control cells exhibited two major groups (Fig. 4B, lane 1; peak 1 and peak 2), resulting from the first and second phases of deadenylation, respectively. Pan2 overexpression led to an appreciable decrease of peak 1 with a concomitant increase in peak 2 (Fig. 4B, lane 2), consistent with the observation that excess Pan2 promotes rapid poly(A) shortening (also see Fig. 3; Yamashita et al. 2005). When Pan3L and Pan2 were coexpressed, there was an appreciable increase in peak 1 and a decrease in peak 2 (Fig. 4B, lane 3). In contrast, coexpressing Pan3S and Pan2 resulted in the loss of peak 1 (Fig. 4B, lane 4). These observations support that Pan3S acts as a positive regulator, globally enhancing Pan2-mediated poly(A) shortening, whereas Pan3L acts as a global negative regulator, not allowing Pan2 deadenylase to take mRNAs through the second phase of deadenylation.
FIGURE 4.

Pan3S and Pan3L exhibit differential effects on global mRNA deadenylation. (A) Schematic diagram showing the experimental procedure of poly(A) size distribution profiling. (B) Denaturing gels showing changes in the poly(A) length-distribution profile of the entire mRNA population accompanying ectopic expression of HA-Pan2 with or without individual Pan3 isoforms. Total cytoplasmic RNA samples were collected from the same sets of cells used for the experiment shown in Figure 3A. (C–E) Human BEAS-2B cells were treated with control siRNA, Pan3L-specific siRNA, Pan3S-specific siRNA, or both Pan3 siRNAs (Pan3S+L). The knockdown efficiency was evaluated by Western blot (C) and RT-PCR analyses (D); actin protein or GAPDH mRNA served as the respective loading control. The effects of Pan3 isoform knockdowns on poly(A) size distribution of the entire mRNA population were analyzed by denaturing gel electrophoresis (E). Red brackets (B,E) indicate peak 1 and peak 2, two major fractions of steady-state mRNAs from the control cells that result from the first and second phases of deadenylation, respectively. The poly(A) size distribution profiles (right panels of B,E) were obtained by scanning each lane of the gels using ImageJ software.
We then took a complementary approach to investigate the role of Pan3 isoforms in regulating global mRNA deadenylation by knocking down individual endogenous Pan3 isoforms (Fig. 4C,D) and examining the effects on the poly(A) length-distribution profile of the entire mRNA population (Fig. 4E). The results showed that depleting Pan3S or both Pan3 isoforms not only increased the accumulation and poly(A) length of peak 1, but also reduced the intensity of peak 2 (Fig. 4E, cf. lane 2 or 3 and lane 1), indicating a general impairment of initiating deadenylation in the absence of Pan3S isoform. On the other hand, knocking down Pan3L reduced the overall intensity of both peaks 1 and 2 (Fig. 4E, cf. lanes 1 and 4), consistent with the idea that Pan2–Pan3S complex may digest the poly(A) tails all the way through to increase overall deadenylation. Collectively, the results show that the two Pan3 isoforms play distinct roles in controlling deadenylation, with Pan3S acting as a positive regulator and Pan3L being a negative regulator, and that their combined action is required for regulating global mRNA deadenylation.
Pan3L and Pan3S have different roles in relation to P-bodies
The dynamics of P-body formation indicate that mRNP remodeling or a change in its constituents is a constant event (Eulalio et al. 2007; Parker and Sheth 2007; Zheng et al. 2011). Previously, we showed that deadenylation is required for P-body formation and that knocking down endogenous Pan3 decreased the number of P-bodies in NIH3T3 cells (Zheng et al. 2008). Thus, it is possible that when the functions of the two human Pan3 isoforms in mRNA deadenylation and decay (see below) are disrupted, it may compromise proper cytoplasmic mRNP remodeling as manifested by changes in P-body dynamics and constituents. Indeed, a recent study using human U2OS cells identified a distinct subclass of P-bodies (GW/P-bodies) containing a unique GW protein splice variant GW220 (Castilla-Llorente et al. 2012). This raised an interesting question as to whether the individual Pan3 isoforms have distinct roles in GW/P-body formation. To address these questions, we performed indirect immunofluorescence microscopy using human U2OS cells with knockdown of each or both Pan3 isoforms by corresponding siRNAs (Fig. 5).
FIGURE 5.

Pan3L and Pan3S knockdowns exhibit differential effects on P-body abundance. Human U2OS cells were transfected with control siRNA (control KD), Pan3L-specific siRNA (Pan3L KD), Pan3S-specific siRNA (Pan3S KD), or both Pan3 siRNAs (Pan3S+L KD). Immunofluorescence microscopy was used to visualize markers for total P-bodies (TNRC6 in A,B; green or Rck/p54 in A; red) or for GW/P-bodies (GW220 in B; red) as described in Materials and Methods. RT-PCR and gel electrophoresis were used to assess the Pan3 knockdown efficiency; GAPDH served as the loading control. Scale bars, 50 µm.
The results show that in control knockdown cells, P-bodies can be detected either by an antiserum targeting general TNRC6 family proteins or by an antibody recognizing another P-body marker, Rck/p54 (Fig. 5A; control KD). Anti-GW220 antibody only detects a subset of the P-bodies containing TNRC6 family proteins (Fig. 5B, control KD), consistent with the observation that not all P-bodies contain GW220 protein (Castilla-Llorente et al. 2012). It was striking that P-bodies (with and without GW220) were barely detected when Pan3S was depleted (Fig. 5; Pan3S KD or Pan3S+L KD), indicating that Pan3S is required for overall P-body formation. Knocking down Pan3L alone slightly reduced the number of TNRC6-positive P-bodies (Fig. 5A and upper panel of Fig. 5B; cf. Pan3L KD and control KD) but greatly increased the number of GW220-positive P-bodies (Fig. 5B; compare the middle panels of Pan3L KD and control KD). Nearly all of the P-bodies in the Pan3L-depleted cells were GW220-positive (Fig. 5B; Pan3L KD; compare upper and middle panels). Similar results were obtained using BEAS-2B cells (Supplemental Fig. S6). Collectively, the data indicate that the two Pan3 isoforms play distinct roles in P-body formation and dynamics. Pan3S is required for formation of P-bodies in general. On the other hand, Pan3L differentially regulates the formation of GW220-containing P-bodies and general P-bodies with a negative and positive effect, respectively. The results are also consistent with the notion that compromising either Pan3 isoform functions greatly impacts cytoplasmic mRNP remodeling and thus likely subsequent decay of mRNA following deadenylation.
Pan3 isoforms have distinct effects on ARE- and miRNA-mediated mRNA decay pathways
To investigate the roles of Pan3 isoforms in regulating mRNA decay, we performed time-course experiments using the Tet-off driven transcription pulse-chase approach and Northern blot analysis (Chen et al. 2008). We monitored mRNA decay kinetics of the β-globin mRNA carrying an AU-rich element (BBB+ARE) (Chen and Shyu 1995) or three consecutive copies of miRNA let-7 binding sites (BBB+3xlet7) in human BEAS-2B cells (Chen et al. 2007) transfected with siRNAs targeting either or both Pan3 isoforms; the stable β-globin (BBB) mRNA served as a control (Fig. 6A). As expected, the BBB+ARE and BBB+3xlet7 transcripts decayed much faster than BBB mRNA (Fig. 6A–C, cf. upper left panels). Pan3L knockdown greatly accelerated the already rapid decay of the BBB+ARE transcript (Fig. 6B). On the other hand, Pan3S knockdown slightly stabilized the BBB+ARE mRNA (Fig. 6B). When both Pan3 isoforms were knocked down, a combination of the effects caused by knocking down individual Pan3 isoforms was observed (Fig. 6B). Together, these results indicate that the two Pan3 isoforms have different, and complex, roles in regulating the ARE-mediated mRNA decay pathway.
FIGURE 6.

Effects of Pan3 isoform knockdowns on individual mRNA decay pathways in vivo. (A–C) Northern blots showing the decay of the β-globin mRNA (BBB; A), β-globin mRNA carrying the c-fos ARE (BBB+ARE; B), or β-globin mRNA carrying three consecutive let-7 binding sites (BBB+3xlet7; C) in human BEAS-2B cells transfected with control siRNA, Pan3L-specific siRNA, Pan3S-specific siRNA, or both Pan3 siRNAs (Pan3S+L). The tTA-expressing BEAS-2B-19 cells were first transfected with the indicated siRNAs and then cotransfected with plasmids encoding the indicated reporter mRNA and a constitutively expressed α-globin/GAPDH hybrid mRNA that served as a control (ctrl) mRNA. Transcription of the reporter mRNA was transiently induced for 2 h by tetracycline removal. RNA samples were prepared at the indicated time points after tetracycline was replenished. Poly(A)− RNA samples were prepared in vitro by treating RNA samples from early time points with oligo(dT) and RNase H. RT-PCR and agarose gel electrophoresis were performed to assess the Pan3 knockdown efficiency; GAPDH served as the loading control. Semi-log plots illustrate decay kinetics of BBB+ARE (B) and BBB+3xlet7 (C) mRNAs after knocking down the Pan3 isoforms. Decay curves and RNA half-lives (t1/2) were obtained by least squares regression of the fraction of mRNA remaining as a function of time, using data from two separate time-course experiments with reproducible results. (D) Dual luciferase assay showing the effects of Pan3 isoform knockdowns on miRNA-mediated gene silencing. (Upper left) Schematic diagram of renilla luciferase (RL) mRNAs carrying three copies of the WT or mutant let-7 binding sites in the 3′UTR (RL+3xlet7 or RL+3xlet7mut). (Lower left) RT-PCR and agarose gel electrophoresis were performed to assess the Pan3 knockdown efficiency; GAPDH served as the loading control. (Right) Results of dual luciferase assays. Firefly luciferase (FL) activity, derived from the same plasmid carrying the RL reporter gene, was used for normalization. The relative fold changes were measured by comparing the RL/FL activity detected under different knockdown (KD) conditions as indicated with that detected in cells expressing the corresponding reporter mRNA under control KD (set as 1). All data represent the average ±SD (n = 3).
The effects of knocking down Pan3 isoforms on miRNA-mediated mRNA decay (Fig. 6C) are different from those found with ARE-mediated decay (Fig. 6B). The decay of BBB+3xlet7 mRNA was slowed down when either Pan3L or Pan3S was knocked down, with Pan3S knockdown having a more dramatic stabilizing effect (Fig. 6C). Knocking down both Pan3 isoforms had an additive stabilizing effect (Fig. 6C). Thus, the two Pan3 isoforms have independent positive effects on miRNA-mediated mRNA decay, with Pan3S being more potent than Pan3L. Dual luciferase assay using renilla luciferase mRNA carrying three let-7 binding sites in the 3′UTR (RL+3xlet7) as a reporter showed that the effects of Pan3 isoform knockdowns on the levels of renilla luciferase activities (Fig. 6D) are consistent with that caused by the corresponding knockdowns on miRNA-mediated mRNA decay (Fig. 6C). Taken together, our data demonstrate that knocking down Pan3L or Pan3S can have differential effects on different mRNA decay pathways.
Transcriptome-wide effects of knocking down Pan3 isoforms on mRNA stability
To further extend the above findings, we examined the roles of the Pan3 isoforms on global mRNA turnover by performing mRNA half-life profiling analysis across the transcriptome of human U2OS cells with and without depleting individual Pan3 isoforms (Fig. 7A). High-depth RNA sequencing (RNA-seq) was carried out on cell samples collected at various times after transcription was inhibited by actinomycin D (Supplemental Table S1). As a subset of the transcripts was markedly enriched over time, particularly when Pan3S was knocked down, we focused on analyzing transcripts whose decay followed first-order kinetics and thus were amenable to half-life evaluation (Supplemental Table S2).
FIGURE 7.

Effects of Pan3 knockdowns on global mRNA turnover. (A) RT-PCR and agarose gel electrophoresis were used to assess the Pan3 knockdown efficiency in human U2OS cells; GAPDH mRNA served as loading control. (B) A heat map illustrating differential effects of knocking down different Pan3 isoforms on mRNA stability across the transcriptome. A color-gradient scale (relatively short half-life in yellow; relatively long half-life in blue) depicts the changes in half-life of each gene under different Pan3 isoform knockdown conditions compared with the half-life of the corresponding gene in the control knockdown (Ctrl KD) cells. The genes whose transcripts were degraded following strong first-order kinetics under all four knockdown conditions (Supplemental Table S3) are included in this analysis. (C) Combined scatter and density plots showing effects of knocking down Pan3L (left), Pan3S (middle), or both Pan3L and Pan3S (right) on mRNA stability across the transcriptome. The genes whose transcripts were degraded following strong first-order kinetics under each knockdown condition (Supplemental Table S2) are included in the analyses shown in C and D. (D) CIRCOS plot representations showing effects of knocking down different Pan3 isoforms on global mRNA turnover. The half-lives (t1/2) in the control condition (Ctrl) are plotted at the top half of the circle, and those obtained from Pan3L knockdown (L KD), Pan3S knockdown (S KD), or knocking down both Pan3 isoforms (S+L KD) are plotted at the bottom half of the circle. Each line represents a change in half-life of an mRNA, with the red or blue colors indicating that the mRNAs are destabilized or stabilized by Pan3 knockdown, respectively.
A heat map illustrating mRNA stability profiles across the transcriptome (Supplemental Table S3) shows that extensive changes in mRNA transcript stabilities result from knocking down either one or both Pan3 isoforms (Fig. 7B, compare each knockdown with Ctrl KD). Pan3L knockdown (Fig. 7B, L KD) stabilizes a number of transcripts but destabilizes others. In contrast, knocking down Pan3S, either alone (Fig. 7B, S KD) or together with Pan3L (Fig. 7B, S+L KD), leads predominantly to stabilization for a large number of transcripts. Combined scatter and density plots (Fig. 7C) derived from the transcriptome data (Supplemental Table S2) show that both stabilization and destabilization effects are apparent for Pan3L knockdown (Fig. 7C, left), with slightly more transcripts being destabilized (Fig. 7C, left, compare the colored areas below and above the dashed red line). On the other hand, stabilized mRNAs greatly outnumber destabilized transcripts as long as Pan3S is knocked down (Fig. 7C, middle and right). Further, the magnitude of the stabilizing effect on individual transcripts is much larger with Pan3S knockdown than with Pan3L knockdown (Fig. 7C; compare S KD t1/2 or S+L KD t1/2 with L KD t1/2).
To gain further insight into the differential effects of Pan3 isoform knockdowns on global mRNA turnover, we also examined the transcriptome data (Supplemental Table S2) using circular plots generated with CIRCOS software (Hu et al. 2014). The results (Fig. 7D) show that most of the transcripts with a half-life of <4 h under control knockdown conditions are stabilized upon Pan3L knockdown (Fig. 7D, left, blue lines in the area of ctrl t1/2 = 0–4 h). For transcripts with a half-life of 4–8 h under control conditions, both stabilization and destabilization effects of knocking down Pan3L are readily detected (Fig. 7D, left, blue or red lines in the area of ctrl t1/2 = 4–8 h). Most transcripts with a half-life over 8 h under control conditions are destabilized upon Pan3L knockdown (Fig. 7D, left, red lines in the area of ctrl t1/2 = 8–12 h). On the other hand, as long as Pan3S is knocked down (Fig. 7D, middle and right), transcripts with a half-life of <6 h under control conditions are largely stabilized (see the blue bundles across the circles in Fig. 7D, middle and right, ctrl t1/2 = 0–6 h), whereas very modest stabilization or destabilization effect was observed for mRNAs with a half-life over 6 h under control conditions (Fig. 7D, middle and right, ctrl t1/2 = 6–12 h). Taken together, our data show that loss of function of Pan3L or Pan3S exhibits different molecular phenotypes. A profound global mRNA stabilization effect is caused as long as Pan3S is knocked down, whereas Pan3L knockdown results in stabilization of relatively unstable transcripts but destabilization of relatively stable transcripts across the transcriptome.
Transcriptome-wide effects of knocking down Pan3 isoforms on different mRNA decay pathways
In light of the finding that knocking down Pan3 isoforms differentially influences decay of mRNAs carrying an ARE- or miRNA-binding sites (Fig. 6), we performed further bioinformatics analysis using the RNA-seq data sets (Supplemental Table S2) to study the effects of Pan3 isoform depletions across the transcriptome on three mRNA decay pathways: ARE-mediated decay, miRNA-mediated decay, and nonsense-mediated decay (NMD). We applied the AREScore algorithm (Spasic et al. 2012), which identifies ARE-containing mRNAs and provides a numerical assessment of the strength of individual AREs, to check the average ARE richness and strength of the transcripts whose decay was affected by knocking down the Pan3 isoforms (Fig. 7A). The results show that the transcripts that are destabilized by at least twofold (t1/2 fold ≤0.5) upon Pan3L depletion had a mean ARE score of 6.1, whereas stabilized transcripts (t1/2 fold >1.0) had a mean ARE score of 2.8 (Fig. 8A). This difference is highly significant (P = 2.21 × 10⁻¹⁶), considering that the mean ARE score for human mRNA transcriptome is 3.8 (Spasic et al. 2012). These observations indicate that Pan3L knockdown selectively boosts the decay of ARE-containing mRNAs, which is consistent with our Northern blot analysis showing that rapid decay of BBB+ARE mRNA is enhanced upon Pan3L knockdown (Fig. 6B).
FIGURE 8.
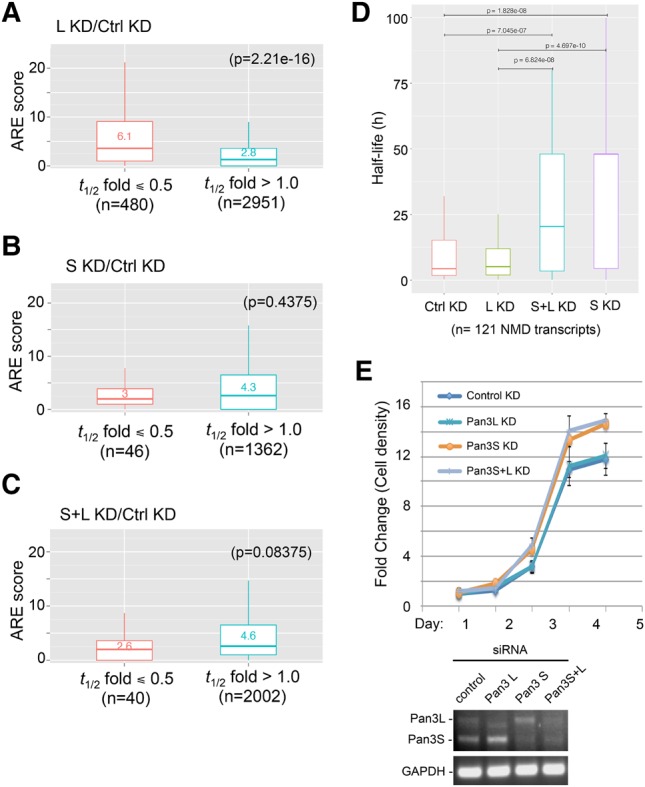
Transcriptome-wide effects of Pan3 isoform knockdowns on individual mRNA decay pathways and cell proliferation. (A–C) Boxplots showing the AREScore distribution of mRNAs after knockdown of Pan3L (A), Pan3S (B), or both Pan3 isoforms (C). The AREScore algorithm (http://arescore.dkfz.de/arescore.pl) was applied to RNA-seq data sets (Supplemental Table S2) to identify ARE-containing mRNAs in each of the knockdown conditions and to quantitate the strength of AREs found in individual transcripts using the default parameters. A t-test was done to access statistical significance. (D) Evaluation of the effects of Pan3 depletion on the NMD pathway in 121 high-confidence NMD substrates that followed first-order decay kinetics under control or Pan3 knockdown conditions (Supplemental Table S2). Changes in average half-life of the NMD transcripts caused by different Pan3 knockdowns are shown by boxplots, of which the statistical significance was assessed by a Wilcoxon test. (E) Cell proliferation assay showing the effects of depleting Pan3 isoforms on cell growth. (Upper) Normalized growth curves of U2OS cells with knockdown of one or both Pan3 isoforms (Pan3L KD, Pan3S KD, or Pan3S+L KD) or with control knockdown (mean ± SD; n = 8). (Lower) RT-PCR and gel electrophoresis were used to assess the knockdown efficiency; GAPDH served as the control.
The transcripts that are stabilized (t1/2 fold > 1.0) upon knocking down Pan3S or both isoforms also have a mean ARE score higher than that of destabilized transcripts (t1/2 fold ≤ 0.5) (Fig. 8B,C), although the differences were not as dramatic as with Pan3L knockdown (Fig. 8A). These results indicate that depletion of Pan3S or both isoforms does not particularly impede the ARE-mediated decay pathway. In other words, the data suggest that knocking down Pan3S or both isoforms has a stabilizing effect on global mRNA in general. This is consistent with the observation that depletion of Pan3S or both isoforms also has a stabilization effect on BBB+3xlet7 (Fig. 6C). Moreover, bioinformatics analysis of miRNA-binding site enrichment across the transcriptome shows that the mRNAs stabilized by Pan3 knockdown are not particularly enriched in miRNA-binding sites (Supplemental Fig. S7), indicating that knocking down Pan3S or both isoforms does not particularly impede the miRNA-mediated decay pathway either. Together, these results support that knocking down Pan3S or both isoforms has a general stabilization effect on global mRNA decay.
Previously, we have shown that compromising the Pan2–Pan3 deadenylase activity impedes the rapid decay of a nonsense-codon containing mRNA (Yamashita et al. 2005; Zheng et al. 2008). To evaluate the effects of Pan3 isoform depletions on the NMD pathway across the transcriptome, we first identified 121 genes appearing in both a high-confidence NMD substrates list (Lou et al. 2016) and the list of genes whose transcripts followed first-order decay kinetics under each knockdown condition (Supplemental Table S2). Our bioinformatics analysis shows that the average half-life of the 121 transcripts is significantly increased as long as Pan3S is depleted, indicative of a compromise of the NMD pathway (Fig. 8D). In contrast, little effect on the stability of these NMD substrates was observed when Pan3L was knocked down (Fig. 8D).
Together, the results of both Northern blot (Fig. 6) and the transcriptome-wide bioinformatics analyses (Figs. 7, 8A–D; Supplemental Fig. S7) demonstrate that knocking down either Pan3 isoforms differentially impacts different mRNA decay pathways across the transcriptome. We conclude that both Pan3 isoforms play critical roles in controlling global mRNA turnover in mammalian cells.
Effects of Pan3 isoform knockdowns on cell proliferation
To examine the functional categories of genes affected by Pan3 isoform depletions, we used GATHER (Chang and Nevins 2006) to look for enriched Gene Ontology (GO) terms for the genes whose transcripts are stabilized by at least threefold under each knockdown condition (Supplemental Table S2). We identified 592 or 779 transcripts that meet the criteria when knocking down Pan3S or both isoforms, respectively, and only 43 genes whose transcripts are stabilized by at least threefold upon Pan3L knockdown. GATHER analysis of the 43 transcripts stabilized by Pan3L knockdown does not yield any significant results in GO term enrichment analysis. However, in the case of knocking down Pan3S or both isoforms, among the top three to six functional categories, most associated terms are all related to cell cycle and cell proliferation (Supplemental Fig. S8, Gene Ontology). We then used GATHER to identify the most common transcription factor-binding sites among these genes. It is striking that the most significant hits are matrices for the E2F-1 transcription factor (Supplemental Fig. S8, TRANSFAC), which is known to control gene expression involved in cell cycle progression (DeGregori and Johnson 2006). Finally, we used GATHER for pathway analysis and found that the top three to four hits are all related to cell cycle and cell proliferation (Supplemental Fig. S8, KEGG Pathway).
In light of the above findings (Supplemental Fig. S8), we performed a cell proliferation assay to check the effects of depleting Pan3 isoforms on cell growth (Fig. 8E). The results show that depletion of Pan3S or both isoforms enhances the cell growth of U2OS cells, whereas knocking down Pan3L has little effect (Fig. 8E). Collectively, unbiased bioinformatics analyses together with cell proliferation assay reveal a new link between the effects of depleting Pan3 isoforms on the stability of cell proliferation-related mRNAs and the changes in cell growth under the corresponding Pan3 knockdown conditions.
DISCUSSION
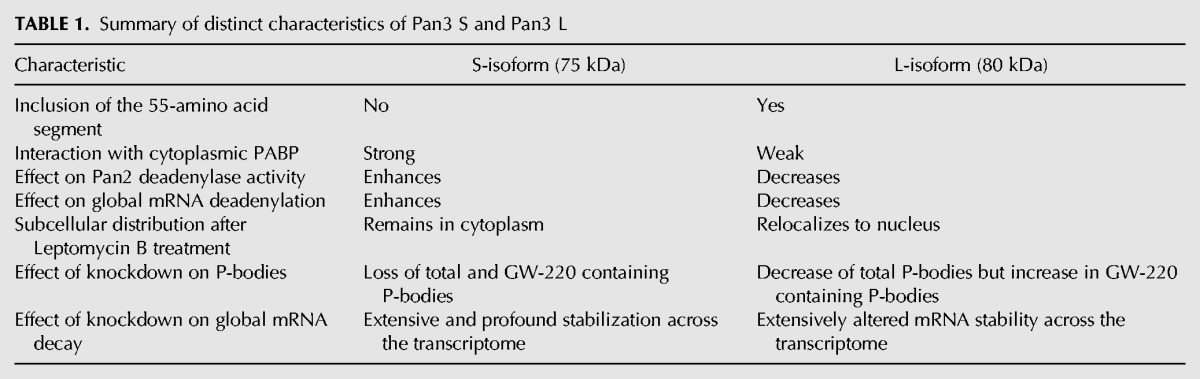
Two decades have passed since Pan3 was first discovered in yeast (Brown et al. 1996), but our understanding of this highly conserved deadenylation factor, particularly its role in mRNA turnover, remains rudimentary. Mammalian deadenylation exhibits biphasic kinetics with Pan2–Pan3 and Ccr4–Caf1 deadenylase complexes mediating the first and second phases, respectively (Yamashita et al. 2005). Previous studies using individual reporter mRNAs showed that compromising Pan2–Pan3 deadenylase activity only modestly affects deadenylation (Boeck et al. 1996; Brown et al. 1996; Tucker et al. 2001; Mangus et al. 2004; Yamashita et al. 2005), raising the critical issues concerning the functional significance of the first-phase deadenylation and the involvement of the Pan2–Pan3 complex in mRNA metabolism. The findings of our present study shed new light on these important issues. In this study, we have discovered and functionally characterized two distinct Pan3 isoforms (Table 1), both of which are evolutionarily conserved among warm-blooded vertebrates (Supplemental Fig. S1). Our results reveal a previously unsuspected principle that governs mRNA turnover in eukaryotes.
TABLE 1.
Summary of distinct characteristics of Pan3 S and Pan3 L
Our transcriptome-based approach and bioinformatics analysis reveal that knocking down either one or both Pan3 isoforms has a profound effect on global mRNA stability in mammalian cells (Fig. 7). These findings are of particular significance as they reveal that when Pan3 is depleted, even though deadenylation may still proceed through Ccr4–Caf1 action (Tucker et al. 2001; Yamashita et al. 2005; Chen and Shyu 2011; Wahle and Winkler 2013), subsequent decay of mRNA across the transcriptome is drastically impacted. One important implication is that the first phase of deadenylation may represent a critical mRNP remodeling step that sets an intrinsic degradation rate for mRNAs. Therefore, disrupting the first phase of deadenylation may cause appreciable changes in mRNP composition, thereby compromising proper functions of several mRNA decay pathways, including ARE-mediated decay, miRNA-mediated decay, and NMD (Figs. 6, 8A–D). This interpretation is consistent with our findings that knockdown of Pan3 isoforms greatly affects P-body and GW/P-body dynamics (Fig. 5), indicative of changes in the structures and/or constituents of mRNPs (Sheth and Parker 2006; Franks and Lykke-Andersen 2008; Zheng et al. 2008; Aizer et al. 2014). One possibility is that depending on the involvement of Pan3 isoforms, mRNPs undergoing decay through individual turnover pathways may be remodeled in different manners. When the first phase of deadenylation is disrupted, mRNPs may be fundamentally altered; as a result, formation of aberrant mRNPs leads to changes in both P-body dynamics and mRNA decay (Figs. 5 and 6).
Based on the generally opposing characteristics of Pan3S and Pan3L (Table 1), we envisage the following scenario as a possibility concerning how the biphasic deadenylation and subsequent decay of mRNA may be coordinated through the interplay among Pan2, PABP, and the two Pan3 isoforms in mammalian cells (Supplemental Fig. S9). Given that Pan 2 and Pan3L are both shuttling proteins (Yamashita et al. 2005) but Pan3S is not (Supplemental Fig. S10), we propose that Pan3L may associate with Pan2 in the nucleus and inhibit Pan2 deadenylase activity. As several recent structural and in vitro studies (Christie et al. 2013; Jonas et al. 2014; Schäfer et al. 2014; Wolf et al. 2014) showed that Pan3 is dimeric when complexed with Pan2, Pan3S may associate with Pan2–Pan3L complex via dimerization with Pan3L in the cytoplasm. Through interaction between Pan3S and PABP, Pan2–Pan3 forms a complex with PABP associated with the mRNA 3′ poly(A) tail. One could also imagine that Pan3 isoforms may form hetero- or homodimers, leading to changes in the conformation of the Pan2–Pan3–Pan3–PABP complex and affecting the levels of Pan2 deadenylase activity. When a conformation of the complex allows Pan3S to activate Pan2, deadenylation of the mRNA is enhanced (Supplemental Fig. S9). After the poly(A) tail is shortened to 110–150 nt by Pan2, a conformational change of the complex may occur to allow Pan3L to inactivate Pan2 and conclude the first phase of deadenylation (Supplemental Fig. S9). By the end of the first phase of deadenylation, critical mRNP remodeling occurs to ensure a proper engagement of subsequent steps in the cytoplasm (Supplemental Fig. S9). It should be noted that one caveat to the above scenario involving Pan3 dimerization based on the structural studies is that a large portion of the Pan3 N-terminal domain, including the PAM2 motif and the 55-residue segment present in the Pan3L, was deleted from the Pan3 constructs used for the structural studies (Christie et al. 2013; Jonas et al. 2014; Schäfer et al. 2014; Wolf et al. 2014). Our data (Figs. 2, 3C,D) clearly indicate an indispensable role of the Pan3 N-terminal domain in modulating Pan3–PABP interaction and Pan2 deadenylase function. Future cocrystallization of the complex consisting of Pan2, PABP, and full-length Pan3S and/or Pan3L should provide important insight into the mechanism by which Pan3 acts to regulate Pan2 deadenylase activity.
In summary, the present results provide new mechanistic insights into the biphasic deadenylation process and further elaborate the functional impacts of the Pan2–Pan3 complex in mRNA deadenylation and degradation in mammalian cells. We propose that the first phase of deadenylation, involving differential actions of Pan2–Pan3S and Pan2–Pan3L, represents a previously unsuspected step of mRNA “maturation” in the cytoplasm, with the potential to modulate critical mRNP remodeling and influence the cytoplasmic fate of mRNA. It will be important for future study to address which downstream step(s)—for example, the second phase of deadenylation (Tucker et al. 2001; Yamashita et al. 2005), uridylation (Rissland and Norbury 2009; Lim et al. 2014), and decapping (Tucker and Parker 2000; Coller and Parker 2004; Liu and Kiledjian 2006)—are affected when the first phase of deadenylation is altered. Other future challenges are to address how Pan3S and Pan3L can differentially influence mRNP remodeling and different decay pathways and to elucidate how the presence or absence of the Pan3L-specific 55-amino acid segment in the N-terminal domain can lead to changes in Pan3 functions for the regulation of global mRNA turnover in mammalian cells.
MATERIALS AND METHODS
Plasmid constructs
The plasmids HA-Pan3L (Zheng et al. 2008), HA-Pan3S (Huang et al. 2013), HA-Pan2 (Chang et al. 2004), pTet-BBB+3xlet7 (Chen et al. 2009), pTet-BBB, pTet-BBB+ARE (Xu et al. 1998), and pSVα-globin/GAPDH (Chen and Shyu 1994) were created as described previously. The plasmids carrying domain truncations of either HA-Pan3L or Pan3S were created by a PCR-based mutagenesis to specifically delete each region as shown in Figure 2A.
Cell culture, transfection, dual luciferase assay, and cell proliferation assay
NIH3T3 cells were maintained in DMEM (Invitrogen) medium containing 10% calf serum. For U2OS cells, 10% heat-inactivated FBS (Invitrogen) was used in DMEM medium. On the day of transfection, 4.5 × 10⁶ suspended cells were seeded onto a 10-cm dish immediately before adding the DNA–lipid (1:3) mixture, which was prepared by blending DNA-OptiMEM solution with Lipofetamine2000-OptiMEM (Invitrogen) solution as described in the manufacturer's protocol. Each 10-cm dish of cells was transfected with 6 µg of each plasmid tested (total 18 µg; carrier DNA was added when necessary). BEAS-2B cells were cultured in F12-Dulbecco's modified Eagle's medium containing heat-inactivated fetal calf serum (5%). Tetracycline (500 ng/mL) was included in the medium for culturing BEAS-2B-19, a stable cell line harboring the tetracycline-responsive transcription factor tTA (Zhai et al. 2008). Cells were seeded and incubated for 1 d before transfection. Each 10-cm dish of cells was transfected with 18 µg of total DNA using X-treme GENE9 (Roche) following the manufacturer's protocol. To knock down Pan3 isoforms, transfections of siRNAs (Sigma-Aldrich) were carried out using lipofectamine-RNAiMAX (Invitrogen) according to the manufacturer's protocol. Pan3S-specific siRNA sequences are CAGAGACGAAAGACACCAA (sense) and UUGGUGUCUUUCGUCUCUG (anti-sense). Pan3L-specific siRNA sequences are CUGCCUUGCUGACAGGUGU (sense) and ACACCUGUCAGCAAGGCAG (anti-sense). The Pan3L-specific siRNA targets the exon sequence coding for the 55-amino acid segment that is absent in Pan3S, and the Pan3S-specific siRNA recognizes the exon–exon junction sequence resulted from removal of the Pan3L-specific exon (Fig. 1A). When transfecting cells with both siRNA and plasmid DNA, cells were seeded 1 d before the first transfection with siRNAs and then were transfected with plasmid DNA the next day. The transfected cells were harvested 42–48 h after transfection for RNA extraction and/or cell lysate preparation. For indirect immunofluorescence microscopy, transfected cells were reseeded on culture slides 24 h later and incubated for another 24 h before being stained. For dual luciferase assays, firefly luciferase activity was used as an internal control. The renilla and firefly luciferase activities in cell lysates were analyzed using a Dual-Glo Luciferase Assay System (Promega) according to the manufacturer's protocol. Luminescence was scanned and recorded with a Tecan Infinite200 Microplate Reader (Tecan Trading AG). Cell proliferation assay was performed using the CyQUANT Cell Proliferation Assay Kit (Invitrogen). Briefly, following control or Pan3-specific siRNA treatment, 1 × 10⁴ cells per well were seeded onto a 96-well plate with a total of eight replicates per siRNA treatment. Five 96-well plates were prepared for the time-course experiment (one plate for each day). Cells were cultured following the manufacturer's protocol. Medium was removed from each well at the desired time, and the cells were frozen and stored at −70°C. When all the samples were collected, cell proliferation analysis was performed following the manufacturer's protocol.
Northern blot analysis and RT-PCR
Time-course experiments using the tTA-expressing BEAS-2B-19 stable cell line were performed as described previously (Chen et al. 2008). Briefly, BEAS-2B-19 cells were transfected with control or Pan3-specific siRNAs for one day followed by another transfection with a control plasmid, pSVα1/GAPDH, along with the pTet-BBB, pTet-BBB+ARE, or pTet-BBB+3xlet7 reporter plasmid. Transfected cells were cultured in medium containing tetracycline (30 ng/mL) for 42–48 h followed by a 2-h incubation in fresh medium without tetracycline to allow transient expression of the reporter mRNAs driven by the Tet-off promoter. Tetracycline was added back to the medium at a final concentration of 500 ng/mL to stop transcription from the Tet-off promoter, and cells were harvested at different time points for RNA extraction. Northern blot analysis was performed as described previously (Chen et al. 2008). All the time-course experiments were repeated at least once with reproducible results.
RT-PCR was performed to monitor the expression of Pan3, and GAPDH mRNA was amplified in parallel to serve as an internal control. The sequences of Pan3-specific primers were GCACCAGCTTTATTGGAGTC and CAACCTCTGTAGGAACTGCTG. The sequences of GAPDH-specific primers were GAAGGTGAAGGTCGGAGTCAAC and CAGAGTTAAAAGCAGCCCTGGT. Amplified DNA fragments were subject to gel electrophoresis on 1% or 1.2% agarose gels and visualized by ethidium bromide staining.
Coimmunoprecipitation and Western blot analysis
Cytoplasmic lysate preparation and co-IP experiments were carried out as described previously (Ezzeddine et al. 2007). Briefly, cells were harvested after transfection and were lysed at 4°C in 600 µL of lysis buffer (20 mM Tris-HCl, pH 7.4, 150 mM NaCl, 1% NP-40, 1 mM Na-orthovanadate, 1 mM Na-pyrophosphate, and 1 mM NaF, supplemented with a protease inhibitor cocktail [Roche]). Fifty microliters of cell lysate was saved as “input” control, and the rest (600–800 µL) was incubated with anti-HA epitope antibody-conjugated agarose beads (Sigma-Aldrich) in the presence of 0.1 mg/mL RNase A at 4°C for 2 h. The beads were subject to five washes with the lysis buffer and one wash with phosphate-buffered saline (PBS). The protein samples were resolved on a 7% or 10% SDS–PAGE and transferred to Immobilon-P membranes (Millipore). To detect HA-tagged proteins or endogenous GAPDH, HRP-conjugated monoclonal anti-HA antibody (1/500; Roche) or HRP-conjugated GAPDH (F-335) antibody (1/500; Santa Cruz Biotechnology) was used. To detect endogenous Pan2 or PABP, membranes were first incubated with rabbit anti-Pan2 antibody (1/1000, custom antibody service from Bethyl Laboratories) (Yamashita et al. 2005) or rabbit anti-PABPC1 antibody (1/1000; a gift from R.E. Lloyd, Baylor College of Medicine) followed by secondary HRP-conjugated goat anti-rabbit antibodies (1/4,000; Bethyl Laboratories) for detection with chemiluminescence reagent (peroxide/luminol enhancer; Pierce). Images were acquired using GeneGnome (Syngene) and analyzed using GeneSnap software.
Poly(A) tail distribution profiling assay
Total RNA was isolated from the cells using the RNeasy Mini kit (QIAGEN). Poly(A) tail size distribution profile analysis (Lingner and Keller 1993) was performed as described previously (Huang et al. 2013). Briefly, total RNA was end-labeled with [α-32P]3′-cordycepin using yeast poly(A) polymerase (Affymetrix). Labeled RNA was then digested with RNase T1 (Sigma-Aldrich) and RNase A (Sigma-Aldrich). Radioactivity was measured after precipitation with trichloroacetic acid, and 20,000 CPM of each sample was used for electrophoresis on 8% denaturing polyacrylamide–urea gels. Autoradiograms were scanned and analyzed using ImageJ software (NIH) to obtain poly(A) length-distribution profiles. All the poly(A) tail distribution profiling assays were repeated at least twice.
Immunofluorescence microscopy
Cells cultured in slide chambers were fixed with 3.7% paraformaldehyde and permeabilized with methanol and 0.5% Triton X-100 as described previously (Zheng et al. 2008). Endogenous Rck/p54 was detected using rabbit anti-Rck/p54 (1/2000; Bethyl Laboratories) and Alexa Flour 555 (red) conjugated to goat anti-rabbit IgG. Endogenous TNRC6 proteins were detected using human anti-TNRC6 antiserum (1/250; a gift from M.J. Fritzler, University of Calgary) and Alexa Fluor 488 (green) conjugated to goat anti-human IgG. Endogenous GW220 was detected using rabbit anti-GW220 antiserum (1/250; a gift from J. Liu, Memorial Sloan Kettering Cancer Center) and Alexa Flour 555 (red) conjugated to goat anti-rabbit IgG. The secondary antibodies were diluted to 1/1000 using PBS containing 1% (w/v) bovine serum albumin. Fluorescent mounting medium containing DAPI was applied to the slides before the placement of coverslips. Digital images were obtained at room temperature using a Leica DMI 400B inverted light microscope system.
RNA-sequencing and decay rate calculation
We used whole transcriptome RNA-seq to investigate changes of global mRNA stability in response to knockdown of Pan3 isoforms. Time-course experiments were performed using actinomycin D (act D; 5 µg/mL) to block transcription followed by harvesting cells at 0, 0.5, 1, 2, 4, and 6 h. RNA samples prepared from the harvested cells were sequenced by HiSeq 2000 (Axeq Technologies) (Supplemental Table S1). The resulting 100 nt paired-end RNA-seq reads were aligned to the human genome (hg19) and their abundance was estimated using TopHat (v1.3.3). For decay rate calculations, RSEM 1.2.18 was used for aligning sequence reads to the hg38 genome, assembling transcripts, and estimating abundance. We only considered the genes whose transcript expression levels were at least 10 TPM (transcripts per kilobase million) from high-depth RNA-sequencing. The expression of each transcript was normalized to the expression of the GAPDH (NM_002046) transcript. The normalized values at each time point were used to estimate the transcript half-life (t1/2) based on a first-order exponential decay model (Imamachi et al. 2014). Transcripts whose half-life estimates could not be accurately determined due to a high residual value (>0.5; column G in Supplemental Table S2) in linear regression analysis were further filtered out. Calculated half-lives of the final group of transcripts under each of the four knockdown conditions including control (6587 transcripts), knocking down Pan3L (7161 transcripts), Pan3S (1550 transcripts), or both Pan3 isoforms (2315 transcripts) for bioinformatics analysis are listed in Supplemental Table S2. Raw RNA-sequencing data have been deposited in the Gene Expression Omnibus under accession number GSE86549.
SUPPLEMENTAL MATERIAL
Supplemental material is available for this article.
Supplementary Material
ACKNOWLEDGMENTS
We thank R. Kulmacz for critically reading the manuscript; K. Strouz, L. Liu, and Y. Ho for technical assistance; A. Yamashita and Y. Yamashita for help with HA-Pan3S plasmid construction; A.B. Chadee and D. Zheng for assisting in plasmid construction and initial tests; J. Chang's bioinformatics service for RNA half-life analysis; J. Liu for providing anti-GW220 antiserum and the U2OS cell line; R.E. Lloyd for providing anti-PABPC1 antibody; and M.J. Fritzler for providing human anti-TNRC6 antiserum. This work was supported by grants from the National Institutes of Health (RO1 GM046454 to A.-B.S.), the Houston Endowment, Inc. (to A.-B.S.), and the Cancer Prevention & Research Institute of Texas (RR150085 to L.H.).
Footnotes
Article is online at http://www.rnajournal.org/cgi/doi/10.1261/rna.061556.117.
REFERENCES
- Aizer A, Kalo A, Kafri P, Shraga A, Ben-Yishay R, Jacob A, Kinor N, Shav-Tal Y. 2014. Quantifying mRNA targeting to P-bodies in living human cells reveals their dual role in mRNA decay and storage. J Cell Sci 127: 4443–4456. [DOI] [PubMed] [Google Scholar]
- Boeck R, Tarun S Jr, Rieger M, Deardorff JA, Muller-Auer S, Sachs AB. 1996. The yeast Pan2 protein is required for poly(A)-binding protein-stimulated poly(A)-nuclease activity. J Biol Chem 271: 432–438. [DOI] [PubMed] [Google Scholar]
- Braun JE, Huntzinger E, Fauser M, Izaurralde E. 2011. GW182 proteins directly recruit cytoplasmic deadenylase complexes to miRNA targets. Mol Cell 44: 120–133. [DOI] [PubMed] [Google Scholar]
- Brown CE, Tarun SZ Jr, Boeck R, Sachs AB. 1996. PAN3 encodes a subunit of the Pab1p-dependent poly(A) nuclease in Saccharomyces cerevisiae. Mol Cell Biol 16: 5744–5753. [DOI] [PMC free article] [PubMed] [Google Scholar]
- Castilla-Llorente V, Spraggon L, Okamura M, Naseeruddin S, Adamow M, Qamar S, Liu J. 2012. Mammalian GW220/TNGW1 is essential for the formation of GW/P bodies containing miRISC. J Cell Biol 198: 529–544. [DOI] [PMC free article] [PubMed] [Google Scholar]
- Chang JT, Nevins JR. 2006. GATHER: a systems approach to interpreting genomic signatures. Bioinformatics 22: 2926–2933. [DOI] [PubMed] [Google Scholar]
- Chang TC, Yamashita A, Chen C-YA, Yamashita Y, Zhu W, Durdan S, Kahvejian A, Sonenberg N, Shyu A-B. 2004. UNR, a new partner of poly(A)-binding protein, plays a key role in translationally coupled mRNA turnover mediated by the c-fos major coding-region determinant. Genes Dev 18: 2010–2023. [DOI] [PMC free article] [PubMed] [Google Scholar]
- Chekulaeva M, Mathys H, Zipprich JT, Attig J, Colic M, Parker R, Filipowicz W. 2011. miRNA repression involves GW182-mediated recruitment of CCR4–NOT through conserved W-containing motifs. Nat Struct Mol Biol 18: 1218–1226. [DOI] [PMC free article] [PubMed] [Google Scholar]
- Chen CY, Shyu AB. 1994. Selective degradation of early-response-gene mRNAs: functional analyses of sequence features of the AU-rich elements. Mol Cell Biol 14: 8471–8482. [DOI] [PMC free article] [PubMed] [Google Scholar]
- Chen AC-Y, Shyu A-B. 1995. AU-rich elements: characterization and importance in mRNA degradation. Trends Biochem Sci 20: 465–470. [DOI] [PubMed] [Google Scholar]
- Chen CYA, Shyu AB. 2011. Mechanisms of deadenylation-dependent decay. Wiley Interdiscip Rev RNA 2: 167–183. [DOI] [PMC free article] [PubMed] [Google Scholar]
- Chen C-Y, Shyu A-B. 2013. Deadenylation and P-bodies. In Ten years of progress in GW/P body research (ed. Chan EKL, Fritzler MJ), pp. 183–195. Springer, New York. [Google Scholar]
- Chen C-YA, Yamashita Y, Chang T-C, Yamashita A, Zhu W, Zhong Z, Shyu A-B. 2007. Versatile applications of transcriptional pulsing to study mRNA turnover in mammalian cells. RNA 13: 1775–1786. [DOI] [PMC free article] [PubMed] [Google Scholar]
- Chen AC-Y, Ezzeddine N, Shyu AB. 2008. Messenger RNA half-life measurements in mammalian cells. Methods Enzymol 448: 335–357. [DOI] [PMC free article] [PubMed] [Google Scholar]
- Chen C-YA, Zheng D, Xia Z, Shyu A-B. 2009. Ago-TNRC6 triggers microRNA-mediated decay by promoting two deadenylation steps. Nat Struct Mol Biol 16: 1160–1166. [DOI] [PMC free article] [PubMed] [Google Scholar]
- Christie M, Boland A, Huntzinger E, Weichenrieder O, Izaurralde E. 2013. Structure of the PAN3 pseudokinase reveals the basis for interactions with the PAN2 deadenylase and the GW182 proteins. Mol Cell 51: 360–373. [DOI] [PubMed] [Google Scholar]
- Coller J, Parker R. 2004. Eukaryotic mRNA decapping. Annu Rev Biochem 73: 861–890. [DOI] [PubMed] [Google Scholar]
- DeGregori J, Johnson D. 2006. Distinct and overlapping roles for E2F family members in transcription, proliferation and apoptosis. Curr Mol Med 6: 739–748. [DOI] [PubMed] [Google Scholar]
- Eulalio A, Behm-Ansmant I, Schweizer D, Izaurralde E. 2007. P-body formation is a consequence, not the cause, of RNA-mediated gene silencing. Mol Cell Biol 27: 3970–3981. [DOI] [PMC free article] [PubMed] [Google Scholar]
- Ezzeddine N, Chang T-C, Zhu W, Yamashita A, Chen C-YA, Zhong Z, Yamashita Y, Zheng D, Shyu A-B. 2007. Human TOB, an antiproliferative transcription factor, is a poly(A)-binding protein-dependent positive regulator of cytoplasmic mRNA deadenylation. Mol Cell Biol 27: 7791–7801. [DOI] [PMC free article] [PubMed] [Google Scholar]
- Fabian MR, Mathonnet G, Sundermeier T, Mathys H, Zipprich JT, Svitkin YV, Rivas F, Jinek M, Wohlschlegel J, Doudna JA, et al. 2009. Mammalian miRNA RISC recruits CAF1 and PABP to affect PABP-dependent deadenylation. Mol Cell 35: 868–880. [DOI] [PMC free article] [PubMed] [Google Scholar]
- Franks TM, Lykke-Andersen J. 2008. The control of mRNA decapping and P-body formation. Mol Cell 32: 605–615. [DOI] [PMC free article] [PubMed] [Google Scholar]
- Hu Y, Yan C, Hsu C-H, Chen Q-R, Niu K, Komatsoulis GA, Meerzaman D. 2014. OmicCircos: a simple-to-use R package for the circular visualization of multidimensional omics data. Cancer Inform 13: 13–20. [DOI] [PMC free article] [PubMed] [Google Scholar]
- Huang K-L, Chadee AB, Chen C-YA, Zhang Y, Shyu A-B. 2013. Phosphorylation at intrinsically disordered regions of PAM2 motif-containing proteins modulates their interactions with PABPC1 and influences mRNA fate. RNA 19: 295–305. [DOI] [PMC free article] [PubMed] [Google Scholar]
- Imamachi N, Tani H, Mizutani R, Imamura K, Irie T, Suzuki Y, Akimitsu N. 2014. BRIC-seq: a genome-wide approach for determining RNA stability in mammalian cells. Methods 67: 55–63. [DOI] [PubMed] [Google Scholar]
- Jonas S, Christie M, Peter D, Bhandari D, Loh B, Huntzinger E, Weichenrieder O, Izaurralde E. 2014. An asymmetric PAN3 dimer recruits a single PAN2 exonuclease to mediate mRNA deadenylation and decay. Nat Struct Mol Biol 21: 599–608. [DOI] [PubMed] [Google Scholar]
- Larkin MA, Blackshields G, Brown NP, Chenna R, McGettigan PA, McWilliam H, Valentin F, Wallace IM, Wilm A, Lopez R, et al. 2007. Clustal W and Clustal X version 2.0. Bioinformatics 23: 2947–2948. [DOI] [PubMed] [Google Scholar]
- Lim J, Ha M, Chang H, Kwon SC, Simanshu Dhirendra K, Patel Dinshaw J, Kim VN. 2014. Uridylation by TUT4 and TUT7 marks mRNA for degradation. Cell 159: 1365–1376. [DOI] [PMC free article] [PubMed] [Google Scholar]
- Lingner J, Keller W. 1993. 3′-End labeling of RNA with recombinant yeast poly(A) polymerase. Nucleic Acids Res 21: 2917–2920. [DOI] [PMC free article] [PubMed] [Google Scholar]
- Liu H, Kiledjian M. 2006. Decapping the message: a beginning or an end. Biochem Soc Trans 34: 35–38. [DOI] [PubMed] [Google Scholar]
- Lou CH, Dumdie J, Goetz A, Shum Eleen Y, Brafman D, Liao X, Mora-Castilla S, Ramaiah M, Cook-Andersen H, Laurent L, et al. 2016. Nonsense-mediated RNA decay influences human embryonic stem cell fate. Stem Cell Reports 6: 844–857. [DOI] [PMC free article] [PubMed] [Google Scholar]
- Mangus DA, Evans MC, Agrin NS, Smith M, Gongidi P, Jacobson A. 2004. Positive and negative regulation of poly(A) nuclease. Mol Cell Biol 24: 5521–5533. [DOI] [PMC free article] [PubMed] [Google Scholar]
- Parker R, Sheth U. 2007. P bodies and the control of mRNA translation and degradation. Mol Cell 25: 635–646. [DOI] [PubMed] [Google Scholar]
- Rissland OS, Norbury CJ. 2009. Decapping is preceded by 3′ uridylation in a novel pathway of bulk mRNA turnover. Nat Struct Mol Biol 16: 616–623. [DOI] [PMC free article] [PubMed] [Google Scholar]
- Schäfer IB, Rode M, Bonneau F, Schüssler S, Conti E. 2014. The structure of the Pan2-Pan3 core complex reveals cross-talk between deadenylase and pseudokinase. Nat Struct Mol Biol 21: 591–598. [DOI] [PubMed] [Google Scholar]
- Sheth U, Parker R. 2006. Targeting of aberrant mRNAs to cytoplasmic processing bodies. Cell 125: 1095–1109. [DOI] [PMC free article] [PubMed] [Google Scholar]
- Shyu AB, Belasco JG, Greenberg MG. 1991. Two distinct destabilizing elements in the c-fos message trigger deadenylation as a first step in rapid mRNA decay. Genes Dev 5: 221–232. [DOI] [PubMed] [Google Scholar]
- Siddiqui N, Mangus DA, Chang TC, Palermino JM, Shyu AB, Gehring K. 2007. Poly(A) nuclease interacts with the C-terminal domain of polyadenylate-binding protein domain from poly(A)-binding protein. J Biol Chem 282: 25067–25075. [DOI] [PubMed] [Google Scholar]
- Spasic M, Friedel CC, Schott J, Kreth J, Leppek K, Hofmann S, Ozgur S, Stoecklin G. 2012. Genome-wide assessment of AU-rich elements by the AREScore algorithm. PLoS Genet 8: e1002433. [DOI] [PMC free article] [PubMed] [Google Scholar]
- Tucker M, Parker R. 2000. Mechanisms and control of mRNA decapping in Saccharomyces cerevisiae. Annu Rev Biochem 69: 571–595. [DOI] [PubMed] [Google Scholar]
- Tucker M, Valencia-Sanchez MA, Staples RR, Chen J, Denis CL, Parker R. 2001. The transcription factor associated Ccr4 and Caf1 proteins are components of the major cytoplasmic mRNA deadenylase in Saccharomyces cerevisiae. Cell 104: 377–386. [DOI] [PubMed] [Google Scholar]
- Uchida N, Hoshino S-i, Katada T. 2004. Identification of a human cytoplasmic poly(A) nuclease complex stimulated by poly(A)-binding protein. J Biol Chem 279: 1383–1391. [DOI] [PubMed] [Google Scholar]
- Wahle E, Winkler GS. 2013. RNA decay machines: Deadenylation by the Ccr4-Not and Pan2-Pan3 complexes. Biochim Biophys Acta 1829: 561–570. [DOI] [PubMed] [Google Scholar]
- Wolf J, Passmore LA. 2014. mRNA deadenylation by Pan2-Pan3. Biochem Soc Trans 42: 184–187. [DOI] [PMC free article] [PubMed] [Google Scholar]
- Wolf J, Valkov E, Allen MD, Meineke B, Gordiyenko Y, McLaughlin SH, Olsen TM, Robinson CV, Bycroft M, Stewart M, et al. 2014. Structural basis for Pan3 binding to Pan2 and its function in mRNA recruitment and deadenylation. EMBO J 33: 1514–1526. [DOI] [PMC free article] [PubMed] [Google Scholar]
- Xu N, Loflin P, Chen CYA, Shyu AB. 1998. A broader role for AU-rich element-mediated mRNA turnover revealed by a new transcriptional pulse strategy. Nucleic Acids Res 26: 558–565. [DOI] [PMC free article] [PubMed] [Google Scholar]
- Yamashita A, Chang TC, Yamashita Y, Zhu W, Zhong Z, Chen CY, Shyu AB. 2005. Concerted action of poly(A) nucleases and decapping enzyme in mammalian mRNA turnover. Nat Struct Mol Biol 12: 1054–1063. [DOI] [PubMed] [Google Scholar]
- Zhai Y, Zhong Z, Chen CYA, Xia Z, Song L, Blackburn MR, Shyu AB. 2008. Coordinated changes in mRNA turnover, translation, and RNA processing bodies in bronchial epithelial cells following inflammatory stimulation. Mol Cell Biol 28: 7414–7426. [DOI] [PMC free article] [PubMed] [Google Scholar]
- Zheng D, Ezzeddine N, Chen CYA, Zhu W, He X, Shyu AB. 2008. Deadenylation is prerequisite for P-body formation and mRNA decay in mammalian cells. J Cell Biol 182: 89–101. [DOI] [PMC free article] [PubMed] [Google Scholar]
- Zheng D, Chen CYA, Shyu A-B. 2011. Unraveling regulation and new components of human P-bodies through a protein interaction framework and experimental validation. RNA 17: 1619–1634. [DOI] [PMC free article] [PubMed] [Google Scholar]
Associated Data
This section collects any data citations, data availability statements, or supplementary materials included in this article.