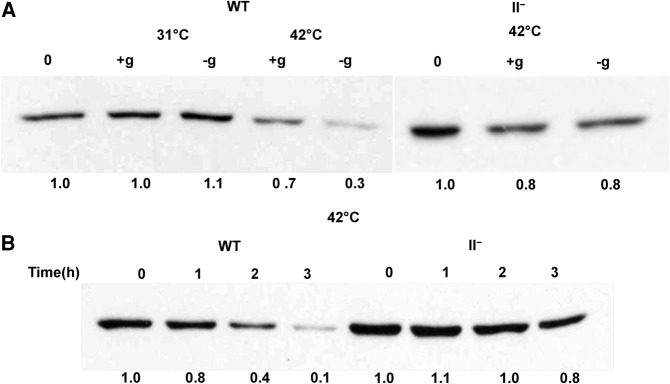
FIGURE 6.
RNase II regulates the level of RNase PH during starvation. (A) WT and RNase II− cells containing the 2× Flag rph gene were first grown in M9/glucose at 31°C to early exponential phase (zero time) and then either starved of glucose for 2 h (−g) or grown in the presence of glucose for 2 h (+g) at 31°C or 42°C. Cells were collected by centrifugation, lysed, and then analyzed by immunoblotting using anti-Flag monoclonal antibody. Shown is a representative gel from an experiment carried out three times with essentially identical results. The amount of total RNase PH at zero time for each cell was set at 1.0. (B) Cells were grown at 31°C to early exponential phase (zero time) and then subjected to glucose starvation at 42°C for the indicated times. Cells were treated and RNase PH analyzed as in A. Shown is a representative gel from an experiment carried out twice with essentially identical results. The amount of total RNase PH in each cell at zero time was set at 1.0.

