Significance
Tropical wilderness areas of largely pristine habitats and low human population densities are witnessing rapid urbanization. However, the urban impact on harvested wildlife populations is largely unknown. An extensive dataset on the population status of a keystone fish species was generated by interviewing hundreds of rural Amazonians about their lifetime fishing activity along a heavily fished but otherwise relatively pristine river. Data reveal that the fish become much smaller and harder to catch when travelling toward a rainforest metropolis of over 2 million residents. This trend extends over 1,000 km from the city. We show how urban connectivity drives this depletion, and discuss how wider forest diversity and human livelihoods may suffer as a result.
Keywords: ecological footprint, fishing down, overfishing, urbanization, freshwater biodiversity
Abstract
Tropical rainforest regions are urbanizing rapidly, yet the role of emerging metropolises in driving wildlife overharvesting in forests and inland waters is unknown. We present evidence of a large defaunation shadow around a rainforest metropolis. Using interviews with 392 rural fishers, we show that fishing has severely depleted a large-bodied keystone fish species, tambaqui (Colossoma macropomum), with an impact extending over 1,000 km from the rainforest city of Manaus (population 2.1 million). There was strong evidence of defaunation within this area, including a 50% reduction in body size and catch rate (catch per unit effort). Our findings link these declines to city-based boats that provide rural fishers with reliable access to fish buyers and ice and likely impact rural fisher livelihoods and flooded forest biodiversity. This empirical evidence that urban markets can defaunate deep into rainforest wilderness has implications for other urbanizing socioecological systems.
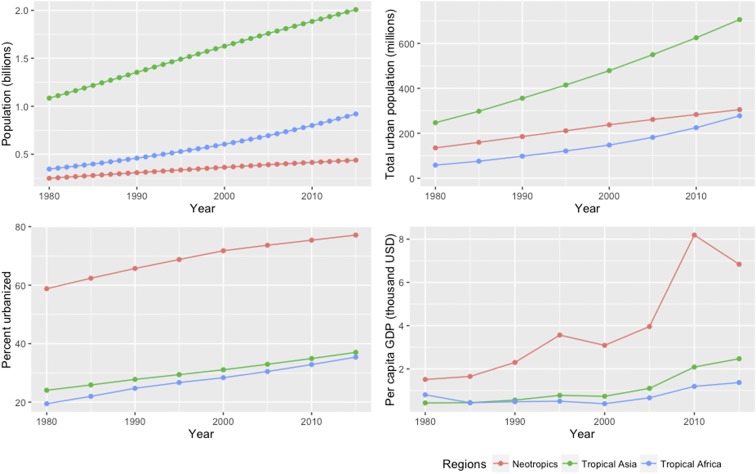
The tropics harbor two-thirds of Earth’s biodiversity (1), and are experiencing rapid human population increase, urbanization, and economic transitions (Fig. S1). These demographic changes are resulting in higher food demand from tropical consumers, particularly for animal protein (2). Much of this demand is being met by the expansion of farmed meat production, which has resulted in widespread land-use change (3). However, wild meat such as fish and bushmeat is also an important food for hundreds of millions of tropical consumers, from the poorest and most vulnerable people (4, 5) to wealthier urban residents (6, 7). The consumption of wild meat is causing pan-tropical defaunation, because exploited populations are widely harvested above the maximum sustainable yield (5, 8–10). The severe decline in abundance of exploited species can cascade onto ecosystem functioning and human well-being, causing food insecurity by reducing access to safe and affordable sources of protein and micronutrients (9, 10).
Fig. S1.
Demographic and economic change in the tropics by region (1980 through 2015). The tropics here are defined as all of the countries whose centroids lie within 23.5° of the equator [ArcMap (40)]. Tropical Asia includes the Pacific island nations of Oceania. Data sources: UN Population Division (56) and International Monetary Fund World Economic Outlook Database (57). Gross domestic product (GDP) is based on current prices. USD, US dollar.
There is now evidence that urban demand is an important driver of tropical wildlife depletion. Marine defaunation shadows have been observed around urban markets, in the form of market proximity-dependent declines in target seafood species, or even whole fish communities (11–14). Tropical inland fisheries have also been overexploited (8), yet evidence is based on local effects of rural-subsistence fishing (8, 15), so the impacts of overfishing inland waters to supply urban markets are unclear. Modeled bushmeat market data suggesting that rainforest defaunation shadows exist around urban areas (16–18) are supported by recent empirical evidence that in situ terrestrial wildlife population impacts are greatest nearer small towns (19). Although forest degradation has been observed spreading from a tropical forest metropolis to meet demand for wood (20), the role of emerging metropolises (>1 million people) in driving large-scale wildlife overharvesting in rainforests and/or inland waters is unknown.
Understanding metropolitan impacts on biodiversity and ecosystems is critical in the Amazon, the world’s largest tropical rainforest and drainage basin, with over 1 million km2 of freshwater ecosystems (21) and more fish species than the Congo and Mekong basins combined (22). Human demographic changes in the Amazon illustrate how the demand for wild meat harvest has urbanized. Three-quarters of the population of the Brazilian Amazon lived in rural areas in 1950, whereas three-quarters—around 18 million people—now live in urban areas (23). Recent evidence shows that urban consumption of wild meat in Amazonia is commonplace (7), as is the case across the forested tropics (5), where urbanization continues (Fig. S2). This raises an important question about the defaunation shadows cast by rainforest cities, in particular large metropolises, in so-called tropical wilderness areas of largely structurally intact rainforest and sparse human population (24).
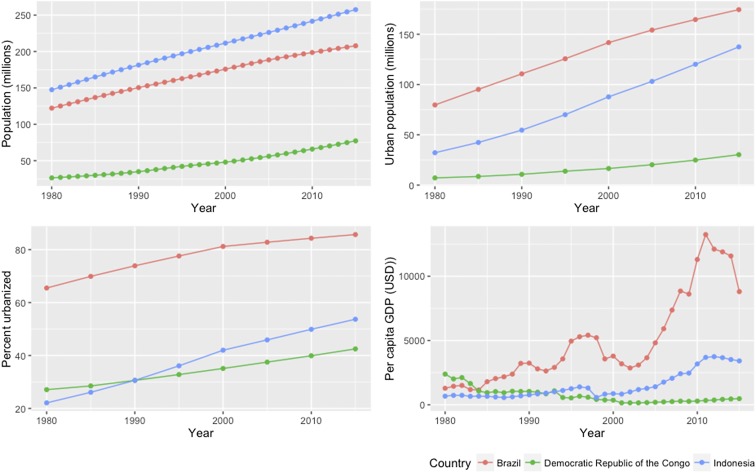
Fig. S2.
Demographic and economic change in the major national hosts of tropical forests (1980 through 2015). The countries with the largest areas of tropical forest are (in descending order) Brazil, the Democratic Republic of Congo, and Indonesia (58).
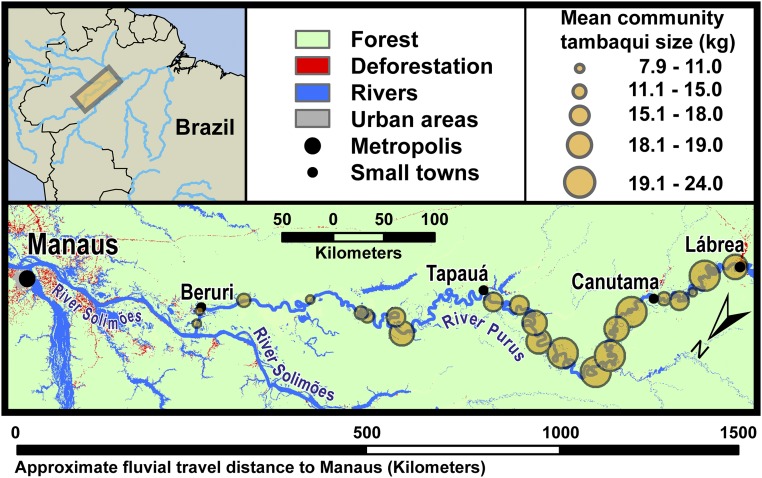
We examine how far the defaunation shadow of a metropolis extends into the forested “wilderness.” We then assess which factors determine the extent of this shadow, and discuss the potential ecological and social consequences. Specifically, we use fisher surveys to investigate the impacts of feeding the Amazon’s largest city, Manaus, by harvesting its consumers’ favorite fish species, tambaqui (Colossoma macropomum). Through these surveys, we measure the principal indicators of overharvesting for targeted fish species: the captured individual’s body size and catch per unit effort in biomass (CPUEb) (8). Although ensuring to incorporate only fishing activity that occurred within close proximity to the interviewed fisher’s community (Methods for more details), we surveyed a 1,267-km gradient of fluvial travel distance from Manaus. The gradient was located along the Purus River, which is Manaus’s principal fishing ground. The Purus watershed has very low human population densities and high remaining forest cover (Fig. 1 and Table S1), bringing our study area well within the definition of a tropical wilderness area (24). It is also one of just three major Amazonian tributaries with an undammed main channel, and the only one whose watershed remains wholly undammed (22).
Fig. 1.
Map of the Purus River. Mean community tambaqui size corresponds to the largest tambaqui caught in the fishers’ lives, as presented in Fig. 2A.
Table S1.
Characteristics of the study area
| Municipality | Original forest cover, % | Population | Area, km2 | Population density, people/km2 |
| Beruri | 98.75 | 15,482 | 17,469 | 0.89 |
| Canutama | 96.57 | 12,733 | 33,643 | 0.38 |
| Lábrea | 94.81 | 37,505 | 68,263 | 0.58 |
| Tapauá | 99.64 | 19,047 | 84,946 | 0.22 |
The study area (located entirely in the stated four municipalities) meets the definition of a tropical wilderness area, requiring it to be largely intact (>75% of original pristine vegetation remaining) and have a low human population density (<5 per km2) (24). Percentage of intact original forest cover was calculated using data from the Brazilian National Institute for Space Research (59), whereas population and municipality area data come from the 2010 Brazilian census (23).
Results
Spatial Decline in Tambaqui.
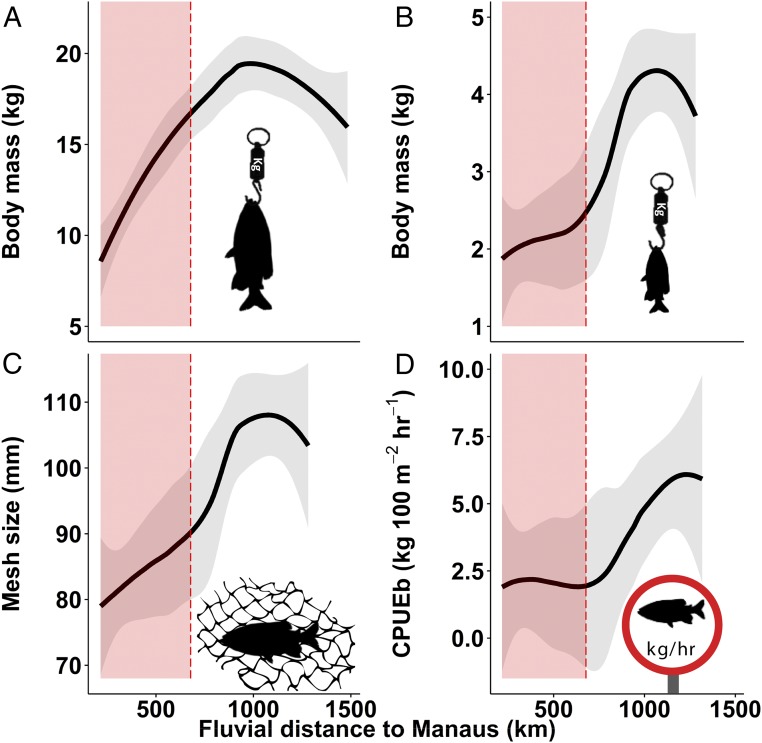
Fishers nearer Manaus reported catching tambaqui half the size of those caught 1,000 km from the city (Fig. 2 A and B). The size of the largest tambaqui caught in the fisher’s lifetime increased significantly with distance from Manaus (n = 392, P < 0.001), as did the mean size caught in the 72 h before the interview (n = 51, P = 0.003). The tambaqui catch rate also doubled with increasing distance along the Manaus travel-distance gradient (Fig. 2D), with which a positive trend in CPUEb was found (n = 46, P = 0.035). Reductions in the gill-net mesh size used to catch tambaqui were also found with increasing proximity to the city (n = 46, P = 0.002; Fig. 2C), indicating that fishers here do not expect to catch larger individuals.
Fig. 2.
Spatial declines in tambaqui (C. macropomum) toward Manaus. Relationships between fluvial travel distance to Manaus and (A) the largest tambaqui caught in the fisher’s lifetime (kg), (B) mean size tambaqui caught recently (kg), (C) gill-net mesh size (mm) used to catch a tambaqui, and (D) tambaqui catch per unit effort in biomass (kg per 100 m2 of gill net and 1 h of fishing). B–D represent fishing activity within 72 h before interview. Red shaded areas depict the range in which fishers have regular access to fish buyers and ice, with the upper limit corresponding to the midpoint between sampled communities that do and do not have such access. Shown in gray are 95% confidence intervals.
Flooded forest cover was included as a model variable, as it represents essential tambaqui feeding habitat, but showed no significant trends. Apart from distance to Manaus, the only significant variables in any of the four models showed a positive relationship between distance to the nearest town and the size of the largest tambaqui caught in the fisher’s lifetime (P = 0.022; Table S2) and a negative relationship between gill-net mesh size and human population density (P = 0.021). The slight dip in all four tambaqui population indices at greater distances from Manaus (Fig. 2) is likely explained by the presence of a road just upstream of our study area that connects this upper section of the Purus River to other distant urban markets.
Table S2.
Linear mixed model results
| Biggest in lifetime | Mean in 72 h | Mesh size | CPUEb | |||||||||||||
| Independent variable, n | 392 | 51 | 46 | 46 | ||||||||||||
| Estimate | SE | t | P | Estimate | SE | t | P | Estimate | SE | t | P | Estimate | SE | t | P | |
| Distance to Manaus | 0.007 | 0.001 | 5.1 | <0.001 | 0.003 | 0.001 | 4.4 | 0.002 | 0.024 | 0.007 | 3.6 | 0.002 | <0.001 | <0.001 | 2.6 | 0.035 |
| Distance to nearest town | 0.017 | 0.007 | 2.4 | 0.022 | 0.001 | 0.002 | 0.7 | 0.488 | 0.043 | 0.024 | 1.8 | 0.077 | <0.001 | <0.001 | −0.9 | 0.355 |
| Population density | −1.329 | 0.813 | −1.64 | 0.123 | −0.148 | 0.399 | −0.4 | 0.711 | −13.637 | 5.726 | −2.4 | 0.021 | 0.016 | 0.017 | 0.9 | 0.347 |
| Flooded forest cover, % | 0.018 | 0.027 | 0.7 | 0.526 | −0.005 | 0.011 | −0.4 | 0.669 | −0.193 | 0.123 | −1.6 | 0.122 | <0.001 | <0.001 | 1.3 | 0.187 |
Bold type indicates significant results (P < 0.05).
Mechanism.
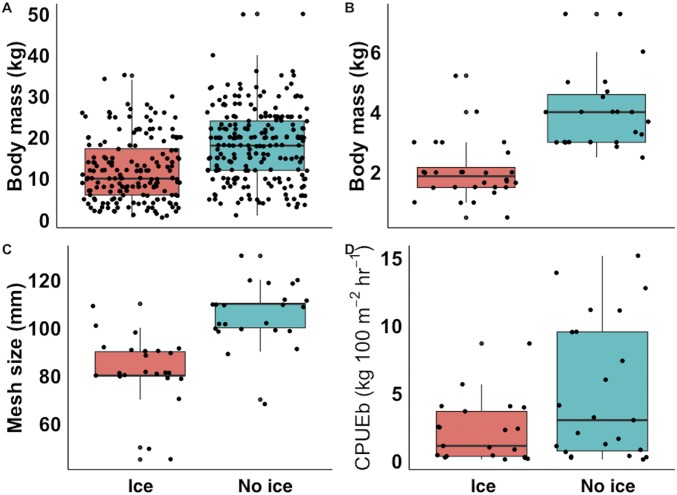
The spatial decline in tambaqui nearer Manaus can be largely explained by frequent visits by boats from the city that buy fish. Field observations and our analytical results demonstrate that the fluvial gradient we surveyed can be split into two subsystems. Commercial fishing is facilitated in rural communities closer to Manaus by boats that deposit ice and buy fish from local fishers at least once a week (shaded red in Fig. 2). Upstream of this, fishers sell fish independently when possible. Modeled trends of tambaqui capture from recent fishing activity (Fig. 2 B–D) show clear inflection points, with steepening inclines in tambaqui demographic indicators upstream of regular fish-buyer routes. Communities receiving frequent visits from fish-buying boats reported the smallest tambaqui (largest in lifetime, P < 0.001; mean in the 72 h before the interview, P < 0.001), smallest mesh sizes used to catch them (P < 0.001), and lowest CPUEb (P = 0.02; Fig. S3).
Fig. S3.
Proposed mechanism for tambaqui decline is access to city-based boats that supply ice and buy fish. Comparison of communities that receive regular city-based boat visits (“Ice” in red) and those that do not (“No ice” in blue) in terms of (A) the largest tambaqui caught in the fisher’s lifetime (kg), (B) mean tambaqui caught in the 72 h before interview (kg), (C) mesh size used to catch a tambaqui (mm), and (D) tambaqui CPUEb (kg per 100 m2⋅h−1). These boxplots show the median (horizontal line), interquartile range (box), and ± 1.5× the interquartile range (error bars).
Ecosystem Function.
To estimate the potential ecological consequences of the smaller tambaqui body size on the Amazon’s flooded forest, we simulated the impacts of overharvesting tambaqui for seed dispersal by combining our mean body-size data model (Fig. 2B) with a published model of median seed-dispersal distance (25). When applied to our data, simulations predict that tambaqui 1,350 km upriver from Manaus will disperse seeds twice as far (337 m) as those 300 km from Manaus (168 m).
Discussion
We present evidence of a large-scale spatially dependent defaunation shadow around a rainforest metropolis, using the case of the tambaqui fishery around Manaus, home to more than 2 million people. Spatial declines in tambaqui body size, CPUEb, and fishing-net mesh size indicate that defaunation extends over 1,000 km of fluvial travel distance from the metropolitan market. Our findings have shown how these impacts are driven by urban demand for a high-value fish species (supported by SI Results), which also has a key role in the ecology of biodiversity-rich flooded forest and in the livelihoods of rural and urban Amazonians. We identify boats from Manaus buying fish as the principal mechanism explaining the spatial decline in tambaqui.
The strong spatial decline in the size of the largest tambaqui caught in the lifetime of fishers (Fig. 2A) indicates that Manaus has driven a spatially expanding depletion shadow of tambaqui. This sequential exploitation may well have started with the overharvesting of fisheries near Manaus, followed by fish buyers traveling further afield to find more intact tambaqui populations. Although the impacts of the growth of Manaus on the fishery are difficult to assess without modeling long-term data, our spatial-snapshot data provide strong evidence that fishing pressure driven by demand from Manaus has caused the depletion of tambaqui. This interpretation is supported by findings in the 1980s that CPUEn (catch per unit effort in numbers) of tambaqui was lower in lakes nearer Manaus (26). Since then, however, Manaus has thrived economically and its population has doubled. According to official statistics, the resultant growing demand for tambaqui is mainly being met by a rapidly expanding aquaculture industry, whereas the reported wild catch has fallen. However, study of the Manaus fish market shows that the wild tambaqui landing data are vastly underestimated, due to widespread concealed landings of small wild tambaqui (27, 28) below the legal threshold (<55 cm, ∼4.3 kg), which consumers prefer to farmed individuals.
The spatially dependent size profile of tambaqui harvests is a key indicator of population status. Both within and across species, large-bodied animals tend to be the most impacted by wildlife consumption, because they are intrinsically vulnerable to overharvesting (5, 8) and preferred by harvesters (higher returns on effort) and consumers (8), many of whom covet rarity (6). Urban consumers can therefore maintain strong demand for a small number of increasingly rare species (6), and are willing to pay high prices for large individuals.
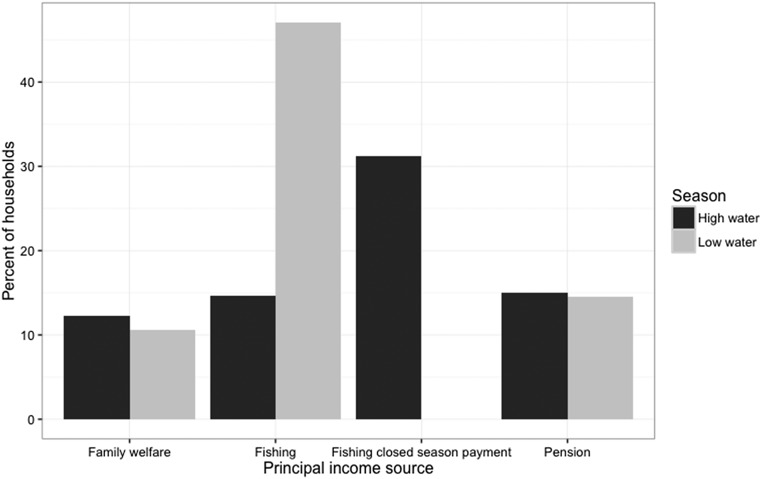
This spatial decline in tambaqui size (Fig. 2) is highly likely to represent a gradient of socioecological impacts extending far from the metropolitan market center of Manaus. Economically, the loss of large tambaqui could be important, as larger individuals are the most valuable per kilogram, with larger fish (≥7 kg) worth more than treble the price per kilogram to the fisher than the mean fish reportedly caught in this study (2.9 kg) (Table S3). This is critically important in our study region, because the primary source of rural earnings is selling fish (Fig. S4). Hence, the observed large-scale spatial declines are evidence that the unsustainable trade in tambaqui to Manaus may threaten long-term livelihood security hundreds of kilometers away, and could increase existing high reliance on conditional cash transfers as a main income source for many households (Fig. S4).
Table S3.
Tambaqui price paid to fishers by size class, as defined by local fish buyers in the lower Purus River
| Body mass, kg | Price per kg, BRL |
| ≥7 | 12 |
| ≥4 and <7 | 8 |
| ≥3 and <4 | 5 |
| ≥2 and <3 | 3.5 |
| ≥1 and <2 | 2 |
| <1 | 1 |
BRL, Brazilian Real.
Fig. S4.
Main source of income for interviewed households by season. Shown here are the principal income sources, which collectively constitute over 70% of the total number of sampled households in either high- or low-water seasons: family welfare (Bolsa familia), fishing (pesca), fishing closed-season payments (defeso), and pension (aposentadoria).
The loss of large freshwater fish species or size classes can trigger ecological cascades because they are often top apex predators with central roles in food web dynamics (8) or perform disproportionately important ecological functions, such as carbon flow modulation (29) and seed dispersal (30). Tambaqui can disperse seeds farther than almost any frugivorous animal yet studied, and this dispersal distance increases with body size (25). The major reductions in long-distance seed dispersal estimated in this study could inhibit the ability of tambaqui-dispersed seed species to germinate successfully, colonize unoccupied and distant patches, and maintain gene flow across fragmented plant populations (25, 30, 31). However, although our simulations predict a spatial reduction in seed dispersal function caused by the observed defaunation, to truly understand the extent to which this will result in cascading changes to plant population and genetic diversity of the Amazonian flooded forest would require further work.
This study advances recent findings that anthropogenic impacts in terrestrial and marine systems are strongly determined by distance from cities (20) or market access (12–14). Our research therefore also contributes to evidence (7) refuting assertions that urbanization and resulting rural depopulation in the forested tropics will reduce harvesting impacts on biodiversity (32, 33). Finally, our findings may offer a warning for tropical Asia and Africa. Although urbanization and the economy of the Amazon rainforest’s main host nation (Brazil) currently surpasses that of Congo (Democratic Republic of Congo) and Southeast Asian (Indonesia) rainforests, these regions are also experiencing rapid economic growth and urbanization (Fig. S2), which is likely to increase the defaunation shadows of rainforest cities there.
SI Results
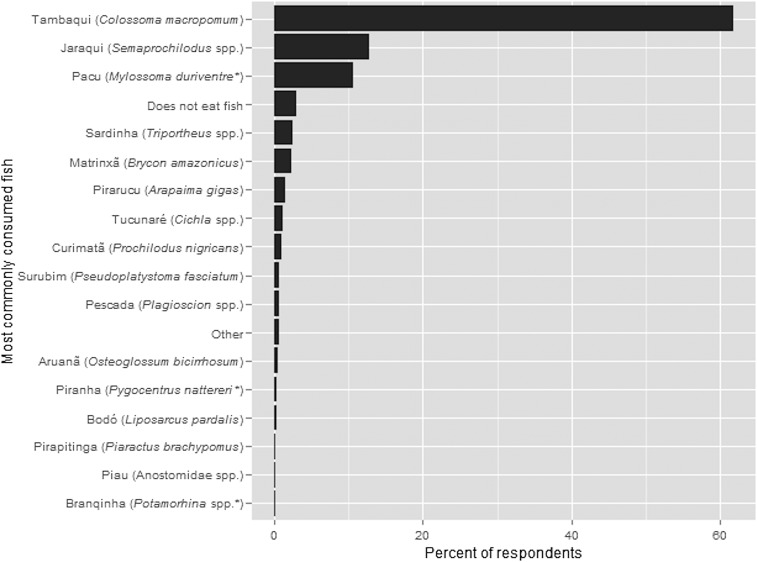
Multiple lines of evidence indicate that the vast majority of tambaqui caught on the section of the Purus River we surveyed are destined for Manaus, and that most of the tambaqui landed in Manaus are also consumed there. (i) An in-depth analysis of the regional fishery by Gandra (35) clearly demonstrates that Manaus is the Brazilian Amazon’s main market for fish, whereas (ii) Batista et al. (53) show that Manaus is also the Amazon’s main location for wild-caught tambaqui landings (see figure 16 in their report). (iii) A recent market survey (54) shows that tambaqui is also the most commonly consumed fish species in Manaus (Fig. S6). Commercial fishing pressure from Manaus is high along the Purus River, evidenced by (iv) multiple studies showing that the river is the main fishing ground for Manaus (34–36), and that (v) the fish caught in the lower Purus River is principally destined for Manaus (53). Fish consumption in Manaus is high even for the Amazon, demonstrated by (vi) the extremely high per-capita fish consumption of around 33.7 kg per annum shown in the city (35). Furthermore, (vii) sample data from the Brazilian Institute of Geography and Statistics (IBGE) show that per-capita freshwater fish consumption in the state in which Manaus is the capital (Amazonas) is much greater than in the state containing Amazonia’s only other metropolitan center (Belem is the state capital of Para) (55), and Manaus accounts for the majority of the urban population of Amazonas State (23). (viii) The fisheries analysis by Gandra (35) reports that most fish that is landed in Manaus is for consumption within the city, with relatively little of the landed catch being exported. Last, Gandra (35) also provides evidence that most of the tambaqui landed in Manaus is for the city itself, stating that (ix) tambaqui and a few other scaled fish species dominate the Manaus market, whereas catfish dominates the Brazilian and international export market.
Fig. S6.
Most commonly consumed fish taxa in Manaus. Data from a market survey where 1,000 Manaus residents sampled across socioeconomic groups were asked “What type of fish do you eat most?” (54). Asterisks with the local names pacu, piranha, and branqinha are used to describe various genera; however, the Manaus markets are dominated by the species or genera set in parentheses (27).
Taken together, the nine arguments presented above provide strong yet indirect evidence that Manaus is the cause of the defaunation shadow reported in our manuscript. An alternative view to take is that whether the tambaqui landed in Manaus is consumed there or not is somewhat irrelevant, because all landings there are linked to the city’s fishing industry, much of which will be consumed by local people and some of which will contribute to the incomes of Manaus-based fishers and traders. Similarly, Cinner et al. (12) present evidence of spatial market access, rather than explicit evidence of local consumption, driving coral-reef fish declines.
Methods
Study Area.
The study was carried out in rural communities situated along the Purus River in the Brazilian Amazon (Fig. 1). The river offers a unique system to study overfishing in an otherwise relatively pristine environment. The Purus River supplies more fish to the Amazon’s largest city, Manaus [population 2.1 million people; (23)], than any other river (34–36). However, apart from high fishing pressure, it does not suffer significantly from the other major threats of Amazonian freshwater degradation: deforestation, pollution, and dam construction (21). The Purus River catchment meets the definition of a wilderness area (24), with high remaining forest cover and low population densities (Table S1). It is the only major Amazonian tributary whose watershed remains undammed, and one of three with an undammed main channel (22).
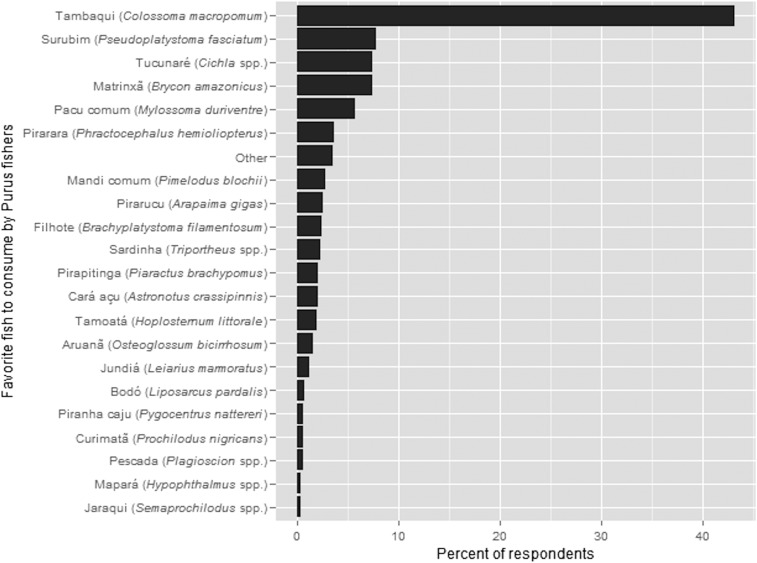
Tambaqui was selected as our focal wildlife species both due to its socioecological importance and because we believed that it presented us with the best chance of detecting overfishing-induced spatial population trends, which are commonly masked in freshwater systems by a synergy of other pressures (21). Tambaqui is the most commercially valuable wild fish species in the region, and the most popular fish food species among our rural study population (Fig. S5) and Manaus residents (Fig. S6). It is also one of few Amazonian fish species thought to have witnessed wild stock declines (21, 37, 38), once being the most landed species in Manaus but seeing dramatic declines in landed catch (38) and body size (39). Last, tambaqui has been identified as a high-quality seed disperser in the várzea flooded forest, and they disperse seeds longer distances than almost any frugivore (terrestrial or aquatic) reported in the literature (25).
Fig. S5.
Favorite fish taxa consumed by Purus fishers. All sampled household residents aged 16 or over who had fished in the past 30 d (n = 582) were asked “What is your favorite fish to eat?”
Sampling.
We worked downstream of the town of Lábrea and upstream from the confluence with the River Solimoes. From the first to the last community the fluvial travel distance along the Purus River was 1,267 km, as calculated using the travel network function in ArcGIS 10.2.2 (40). We would stop at the first community we came to as we traveled downstream from Lábrea that had 10 to 35 ordinarily (not necessarily currently) inhabited houses, and we would not stop at another community for a minimum of 13 km (mean 61 km) of fluvial travel distance subsequently. Market access is indicated solely as fluvial travel distance to Manaus because the studied section of the Purus River contains no roads, and all transport is via the river network. We did not work in the stretch of the river covered by the Abufari Biological Reserve, as regulation and monitoring concerning harvesting practices were much more intense than in sustainable-use reserves or unprotected areas, potentially causing unnecessary variation in results both ecological and in terms of response bias.
We visited a maximum of 20 households per community. Where a community had more than 20 households, those to be visited would be selected randomly by a lottery system. We interviewed every household member 16 y of age or older who had been fishing in the past 30 d (referred to as a “fisher”). Guided by average river levels (41), we visited each community at its approximate high-water peak (April through July 2014) to reduce the variation in ecology and fisher activity caused by the flood pulse (42), thereby also avoiding working during the defeso fishing closed season.
Interview Questions.
All fishers were asked in detail about the catch, effort, and catch methods of every fishing trip that they had undertaken in the 72 h before the interview. Where tambaqui was caught, they were asked to recall the number of individuals and estimated weight of the catch. To calculate effort, we asked fishers when they left and returned to their house, how long the return journey took, and how long they spent harvesting if they were not harvesting for the entire period that they were away from home and not traveling. For fishing-net dimensions, we asked the mesh size (distance of the mesh between opposite knots in mm), length, and height. The length and height were used to calculate the net area. The largest fishing-net mesh size used on a fishing trip that caught a tambaqui was used as a data point in the mesh-size analysis, as we do not know which net specifically caught tambaqui.
Use of Interviews for Collection of Ecological Data.
There is a severe lack of data on harvesting of large and rare animals in rural tropical settings due to logistical difficulties and difficulty in detection of such animals. Due to this, combined with the enormous geographical scale of the study area, this study required a much more efficient data collection method than standard scientific fish sampling. Interviews have been used increasingly in ecological studies to collect the knowledge of rural people, particularly harvesters. Compared with professional techniques, harvester catch per unit effort has been shown to be much cheaper and more efficient and result in similar levels of accuracy (43–46). One increasingly popular use of harvester interviews is the collection of catch and effort data, to undertake analyses of catch, effort, and CPUE. Commercial CPUE is probably the most widely used index of abundance in fisheries (47), and is being increasingly commonly used in studies of freshwater fisheries (48–50).
Statistical Analysis.
Statistical analyses were performed in R statistical software version 3.2.3 (51). Linear mixed models combining primary response variable data with secondary explanatory variable data were used for multivariate analyses. Response variables were quantitative responses to fisher surveys. Response variables were (i) the largest tambaqui individual caught by a fisher in their lifetime (kg), (ii) the mean tambaqui caught by a fisher in the 72 h before interview (kg), (iii) the maximum gill-net mesh size used on a fishing trip that caught tambaqui (mm), and (iv) CPUEb in kg per 100 m2 of net deployed per h it was in the water. To keep response variables spatially associated with each community’s location, each response variable concerned only fishing trips that had occurred within a 2-h rabeta motorized canoe journey from the fisher’s home in the community. This is a measure that local people can relate to and that is fairly standard, as most harvesting is undertaken using motorized canoes of similar power (generally 5.5 horsepower) that travel at around 9 km⋅h−1 (19). Community was used as a random variable in all models. Model diagnostic plots were subsequently inspected.
Explanatory variables were fluvial distance from Manaus (km), fluvial distance from the closest town (Lábrea, Canutama, Tapauá, or Beruri) (km), human population density (people per km2), and percentage of flooded forest (várzea) cover within a 5-km radius of the community. Human population density was calculated as the 2010 Brazilian census population of the census sector in which the relevant community was located (23), divided by the area of that census sector [calculated in ArcMap (40)].
Percentage of flooded forest area was included because most tambaqui were caught in the flooded forest, which is an essential tambaqui feeding habitat (28). To calculate this, we initially made a flooded forest map of the study area in ArcMap (40), which consisted of the area defined as forest [TerraClass land cover map (52)] that spatially coincided with the area that is permanently or seasonally flooded (floodplain map). A buffer with a 5-km radius was then created around each community, and the percentage of this area covered by flooded forest was calculated. This percentage ranged between 16.3 and 92.2% (mean 59.0%), but a linear model found that there was no significant trend with distance to Manaus (P = 0.5). We also performed a linear model to explore the possibility of a trend in the age of the sampled tambaqui fishers and distance to Manaus in case this could influence results, and also found no significant trend (P = 0.25).
Ethics.
Upon arrival at every community, we would initially approach the principal community representative (presidente) to thoroughly explain the research and ask permission to work in the community. A further explanation of the research was given on arrival at every interviewed household. Oral permission was obtained before proceeding with the research, which was seen as more ethically sound than written permission in an area with high illiteracy rates. The research was assessed and approved by ethics committees at both Lancaster University and the Federal University of Lavras. Article 37 of Brazilian Law 9605 from 1998 states that killing an animal is not a crime when it is carried out to satisfy the hunger of the harvester or their family. At no point in this paper is it stated whether any of the sampled fish were sold or used for consumption, and therefore no activity presented in this paper can be perceived as illegal.
Acknowledgments
We thank Nick Graham and Christina Hicks for comments, and Gemma Davies and Hannah Griffiths for help with figure preparation. We are grateful to the people of the Purus River for their partnership and many hours of fascinating conversation. This work was funded by the Natural Environment Research Council (NE/K501001/1) and Feed the World grants (to D.J.T.). L.P. was supported by an Economic and Social Research Council fellowship (ES/K010018/1), and P.S.P. received Conselho Nacional de Desenvolvimento Científico e Tecnológico (304002/2014-3) and Fundação de Amparo à Pesquisa do Estado de Minas Gerais (PPM-00608/15) research fellowships. Publication charges were paid for by the European Union (H2020-MSCA-RISE-2015 - Project 691053-ODYSSEA).
Footnotes
The authors declare no conflict of interest.
This article is a PNAS Direct Submission.
This article contains supporting information online at www.pnas.org/lookup/suppl/doi:10.1073/pnas.1614499114/-/DCSupplemental.
References
- 1.Dirzo R, Raven PH. Global state of biodiversity and loss. Annu Rev Environ Resour. 2003;28:137–167. [Google Scholar]
- 2.Sans P, Combris P. World meat consumption patterns: An overview of the last fifty years (1961–2011) Meat Sci. 2015;109:106–111. doi: 10.1016/j.meatsci.2015.05.012. [DOI] [PubMed] [Google Scholar]
- 3.Foley JA, et al. Global consequences of land use. Science. 2005;309:570–574. doi: 10.1126/science.1111772. [DOI] [PubMed] [Google Scholar]
- 4.Béné C, et al. Feeding 9 billion by 2050—Putting fish back on the menu. Food Secur. 2015;7:261–274. [Google Scholar]
- 5.Milner-Gulland EJ, Bennett EL. Wild meat: The bigger picture. Trends Ecol Evol. 2003;18:351–357. [Google Scholar]
- 6.Shairp R, Veríssimo D, Fraser I, Challender D, MacMillan D. Understanding urban demand for wild meat in Vietnam: Implications for conservation actions. PLoS One. 2016;11:e0134787. doi: 10.1371/journal.pone.0134787. [DOI] [PMC free article] [PubMed] [Google Scholar]
- 7.Parry L, Barlow J, Pereira H. Wildlife harvest and consumption in Amazonia’s urbanized wilderness. Conserv Lett. 2014;7:565–574. [Google Scholar]
- 8.Allan JD, Abell R, Hogan Z, Revenga C. Overfishing of inland waters. Bioscience. 2005;55:1041–1051. [Google Scholar]
- 9.Dirzo R, et al. Defaunation in the Anthropocene. Science. 2014;345:401–406. doi: 10.1126/science.1251817. [DOI] [PubMed] [Google Scholar]
- 10.McCauley DJ, et al. Marine defaunation: Animal loss in the global ocean. Science. 2015;347:247–254. doi: 10.1126/science.1255641. [DOI] [PubMed] [Google Scholar]
- 11.Scales H, Balmford A, Liu M, Sadovy Y, Manica A. Keeping bandits at bay. Science. 2006;313:612–613. doi: 10.1126/science.313.5787.612c. [DOI] [PubMed] [Google Scholar]
- 12.Cinner JE, et al. Bright spots among the world’s coral reefs. Nature. 2016;535:416–419. doi: 10.1038/nature18607. [DOI] [PubMed] [Google Scholar]
- 13.Maire E, et al. How accessible are coral reefs to people? A global assessment based on travel time. Ecol Lett. 2016;19:351–360. doi: 10.1111/ele.12577. [DOI] [PubMed] [Google Scholar]
- 14.Brewer TD, Cinner JE, Green A, Pandolfi JM. Thresholds and multiple scale interaction of environment, resource use, and market proximity on reef fishery resources in the Solomon Islands. Biol Conserv. 2009;142:1797–1807. [Google Scholar]
- 15.Castello L, McGrath DG, Beck PS. Resource sustainability in small-scale fisheries in the Lower Amazon floodplains. Fish Res. 2011;110:356–364. [Google Scholar]
- 16.Fa JE, et al. Impact of market hunting on mammal species in Equatorial Guinea. Conserv Biol. 2010;9:1107–1115. doi: 10.1046/j.1523-1739.1995.951107.x. [DOI] [PubMed] [Google Scholar]
- 17.Wilkie DS, Carpenter J. Bushmeat hunting in the Congo Basin: An assessment of impacts and options for mitigation. Biodivers Conserv. 1999;8:927–955. [Google Scholar]
- 18.Allebone-Webb SM, et al. Use of market data to assess bushmeat hunting sustainability in Equatorial Guinea. Conserv Biol. 2011;25:597–606. doi: 10.1111/j.1523-1739.2011.01681.x. [DOI] [PubMed] [Google Scholar]
- 19.Parry L, Peres CA. Evaluating the use of local ecological knowledge to monitor hunted tropical-forest wildlife over large spatial scales. Ecol Soc. 2015;20:15. [Google Scholar]
- 20.Ahrends A, et al. Predictable waves of sequential forest degradation and biodiversity loss spreading from an African city. Proc Natl Acad Sci USA. 2010;107:14556–14561. doi: 10.1073/pnas.0914471107. [DOI] [PMC free article] [PubMed] [Google Scholar]
- 21.Castello L, et al. The vulnerability of Amazon freshwater ecosystems. Conserv Lett. 2013;6:217–229. [Google Scholar]
- 22.Winemiller KO, et al. Balancing hydropower and biodiversity in the Amazon, Congo, and Mekong. Science. 2016;351:128–129. doi: 10.1126/science.aac7082. [DOI] [PubMed] [Google Scholar]
- 23.IBGE 2010 Censo Demográfico 2010 (Rio de Janeiro, Brazil). Available at www.ibge.gov.br/home/estatistica/populacao/censo2010/default.shtm. Accessed July 12, 2017.
- 24.Mittermeier RA, Myers N, Thomsen JB, da Fonseca GAB, Olivieri S. Biodiversity hotspots and major tropical wilderness areas: Approaches to setting conservation priorities. Conserv Biol. 1998;12:516–520. [Google Scholar]
- 25.Anderson JT, Nuttle T, Saldaña Rojas JS, Pendergast TH, Flecker AS. Extremely long-distance seed dispersal by an overfished Amazonian frugivore. Proc R Soc B Biol Sci. 2011;278:3329–3335. doi: 10.1098/rspb.2011.0155. [DOI] [PMC free article] [PubMed] [Google Scholar]
- 26.Petrere M., Jr Amazon fisheries: I - Variations in the relative abundance of tambaqui (Colossoma macropomum Cuvier, 1818) based on catch and effort data of the gill-net fisheries. Amazoniana. 1986;9:527–547. [Google Scholar]
- 27.Santos GM, Ferreira EJ, Zuanon JA. In: Peixes Comerciais de Manaus. Santos GM, Ferreira EJ, Zuanon JA, editors. ProVárzea; Manaus, Brazil: 2006. p. 55. [Google Scholar]
- 28.Araujo-Lima CARM, Goulding M. So Fruitful a Fish: Ecology, Conservation and Aquaculture of the Amazon’s Tambaqui. Columbia Univ Press; New York: 1997. [Google Scholar]
- 29.Taylor BW, Flecker AS, Hall RO., Jr Loss of a harvested fish species disrupts carbon flow in a diverse tropical river. Science. 2006;313:833–836. doi: 10.1126/science.1128223. [DOI] [PubMed] [Google Scholar]
- 30.Correa SB, et al. Overfishing disrupts an ancient mutualism between frugivorous fishes and plants in neotropical wetlands. Biol Conserv. 2015;191:159–167. [Google Scholar]
- 31.Anderson JT, Saldaña Rojas J, Flecker AS. High-quality seed dispersal by fruit-eating fishes in Amazonian floodplain habitats. Oecologia. 2009;161:279–290. doi: 10.1007/s00442-009-1371-4. [DOI] [PubMed] [Google Scholar]
- 32.Aide TM, Grau HR. Globalization, migration, and Latin American ecosystems. Science. 2004;305:1915–1916. doi: 10.1126/science.1103179. [DOI] [PubMed] [Google Scholar]
- 33.Wright SJ, Muller-Landau HC. The future of tropical forest species. Biotropica. 2006;38:287–301. [Google Scholar]
- 34.Cardoso RS, Batista VDS, Henry C, Júnior F, Martins WR. Aspectos econômicos e operacionais das viagens da frota pesqueira de Manaus, Amazônia Central. Acta Amazon. 2004;34:301–307. [Google Scholar]
- 35.Gandra A. O Mercado de Pescado da Região Metropolitana de Manaus. INFOPESCA; Montevideo, Uruguay: 2010. [Google Scholar]
- 36.Batista VDS, Petrere Júnior M. Characterization of the commercial fish production landed at Manaus, Amazonas State, Brazil. Acta Amazon. 2003;33:53–66. [Google Scholar]
- 37.Isaac VJ, Ruffino ML. Population dynamics of tambaqui, Colossoma macropomum Cuvier, in the Lower Amazon, Brazil. Fish Manag Ecol. 1996;3:315–333. [Google Scholar]
- 38.Merona B, Bittencourt MM. A pesca na Amazônia através dos desembarques no mercado de Manaus: Resultados preliminares. Memória Soc Ciencias Nat La Salle. 1988;48(Suppl):433–453. [Google Scholar]
- 39.Costa-Pereira R, Galetti M. Frugivore downsizing and the collapse of seed dispersal by fish. Biol Conserv. 2015;191:809–811. [Google Scholar]
- 40. Environmental Systems Research Institute (2014) ArcMap (Environmental Systems Research Institute, Redlands, CA), Version 10.2.2.
- 41.Coe MT, Costa MH, Botta A, Birkett C. Long-term simulations of discharge and floods in the Amazon Basin. J Geophys Res Atmos. 2002;107:1–17. [Google Scholar]
- 42.Junk WJ, Bayley PB, Sparks RE. The flood pulse concept in river-floodplain systems. Can Spec Publ Fish Aquat Sci. 1989;106:110–127. [Google Scholar]
- 43.Rist J, Milner-Gulland EJ, Cowlishaw G, Rowcliffe M. Hunter reporting of catch per unit effort as a monitoring tool in a bushmeat-harvesting system. Conserv Biol. 2010;24:489–499. doi: 10.1111/j.1523-1739.2010.01470.x. [DOI] [PubMed] [Google Scholar]
- 44.Jones JPG, Andriamarovololona MM, Hockley N, Gibbons JM, Milner-Gulland EJ. Testing the use of interviews as a tool for monitoring trends in the harvesting of wild species. J Appl Ecol. 2008;45:1205–1212. [Google Scholar]
- 45.Tesfamichael D, Pitcher TJ, Pauly D. Assessing changes in fisheries using fishers’ knowledge to generate long time series of catch rates: A case study from the Red Sea. Ecol Soc. 2014;19:18. [Google Scholar]
- 46.Grant S, Berkes F. Fisher knowledge as expert system: A case from the longline fishery of Grenada, the eastern Caribbean. Fish Res. 2007;84:162–170. [Google Scholar]
- 47.Edwards CTT, Hillary RM, Levontin P, Blanchard JL, Lorenzen K. Fisheries assessment and management: A synthesis of common approaches with special reference to deepwater and data-poor stocks. Rev Fish Sci. 2012;20:136–153. [Google Scholar]
- 48.Almeida OT, Lorenzen K, Mcgrath DG. Fishing agreements in the lower Amazon: For gain and restraint. Fish Manag Ecol. 2009;16:61–67. [Google Scholar]
- 49.Hallwass G, Lopes PF, Juras AA, Silvano RA. Fishing effort and catch composition of urban market and rural villages in Brazilian Amazon. Environ Manage. 2011;47:188–200. doi: 10.1007/s00267-010-9584-1. [DOI] [PubMed] [Google Scholar]
- 50.Pinho PF, Orlove B, Lubell M. Overcoming barriers to collective action in community-based fisheries management in the Amazon. Hum Organ. 2012;71:99–109. [Google Scholar]
- 51.R Core Team 2015 R: The R Project for Statistical Computing. Available at https://www.r-project.org/. Accessed July 12, 2017.
- 52.Instituto Nacional de Pesquisas Espaciais (INPE) 2014 Dados TerraClass 2014. Available at www.inpe.br/cra/projetos_pesquisas/terraclass2014.php.
- 53.Batista V da S, et al. Peixes e Pesca no Solimões-Amazonas: Uma Avaliação Integrada. Ibama/ProVárzea, Brasilia; Brazil: 2012. [Google Scholar]
- 54.Pesquisa365 2015 Consumo365 (Manaus). Available at www.slideshare.net/pesquisa365/consumo365. Accessed July 12, 2017.
- 55.IBGE 2009 POF (Pesquisa de Orçamentos Familiares 2008–2009). Análise do Consumo Alimentar Pessoal no Brasil. Available at www.ibge.gov.br/home/estatistica/populacao/condicaodevida/pof/2008_2009_analise_consumo/default.shtm. Accessed July 12, 2017.
- 56.United Nations 2017 World Population Prospects 2017. Available at https://esa.un.org/unpd/wpp/. Accessed July 12, 2017.
- 57.International Monetary Fund 2016 World Economic Outlook Database. Available at https://www.imf.org/external/pubs/ft/weo/2016/01/weodata/index.aspx. Accessed July 12, 2017.
- 58.Saatchi SS, et al. Benchmark map of forest carbon stocks in tropical regions across three continents. Proc Natl Acad Sci USA. 2011;108:9899–9904. doi: 10.1073/pnas.1019576108. [DOI] [PMC free article] [PubMed] [Google Scholar]
- 59.Instituto Nacional de Pesquisas Espaciais (INPE) 2014 PRODES: Desflorestamento nos Municípios da Amazônia Legal para o ano de 2014. Available at www.dpi.inpe.br/prodesdigital/prodesmunicipal.php. Accessed July 12, 2017.


