Significance
This analysis provides compelling observational evidence that rainforest transpiration during the late dry season plays a central role in initiating the dry-to-wet season transition over the southern Amazon. Transpiration first activates shallow convection that preconditions the atmosphere for regional-scale deep convection, rather than directly activating deep convection as previously proposed. Isotopic fingerprints in atmospheric moisture unequivocally identify rainforest transpiration as the primary moisture source for shallow convection during the transition. This “shallow convection moisture pump” thus depends on high transpiration rates during the late dry season, affirming the potential for climate and land use changes to alter or disrupt wet season onset in this region.
Keywords: rainfall, rainforest, Amazon, evapotranspiration, monsoon onset
Abstract
Although it is well established that transpiration contributes much of the water for rainfall over Amazonia, it remains unclear whether transpiration helps to drive or merely responds to the seasonal cycle of rainfall. Here, we use multiple independent satellite datasets to show that rainforest transpiration enables an increase of shallow convection that moistens and destabilizes the atmosphere during the initial stages of the dry-to-wet season transition. This shallow convection moisture pump (SCMP) preconditions the atmosphere at the regional scale for a rapid increase in rain-bearing deep convection, which in turn drives moisture convergence and wet season onset 2–3 mo before the arrival of the Intertropical Convergence Zone (ITCZ). Aerosols produced by late dry season biomass burning may alter the efficiency of the SCMP. Our results highlight the mechanisms by which interactions among land surface processes, atmospheric convection, and biomass burning may alter the timing of wet season onset and provide a mechanistic framework for understanding how deforestation extends the dry season and enhances regional vulnerability to drought.
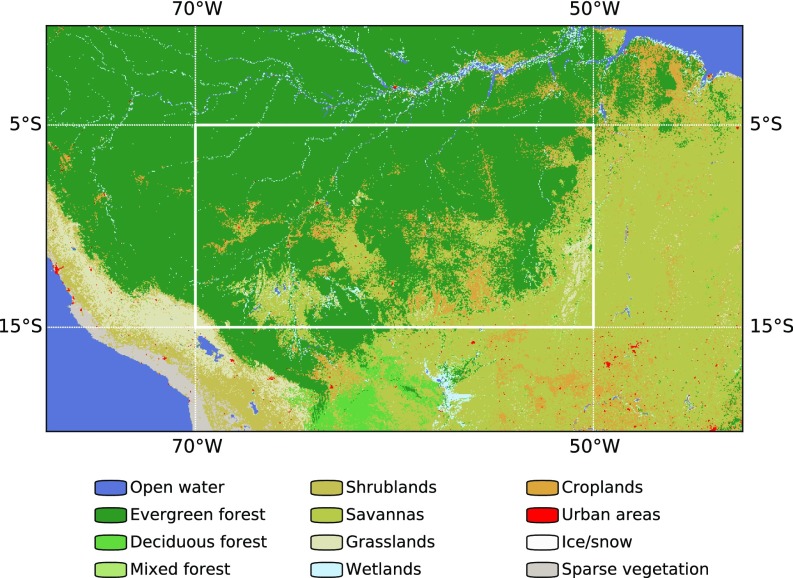
The southern Amazon, which covers 30–40% of Amazonia, is a transitional region between tropical rainforests to the north and west and subtropical savanna and agricultural lands to the south and east (Fig. 1). Rainforests in this region, which play an important role in the global carbon cycle (1), are vulnerable to slight decreases in annual rainfall or increases in dry season length (2). This vulnerability is exacerbated by large-scale agricultural land use. The southern Amazon dry season has lengthened in recent decades, primarily due to delays in wet season onset (3). Model simulations suggest that continuation of this trend could trigger an abrupt transition of rainforest to savanna (2, 4), which would substantially reduce dry season rainfall over the southern Amazon and downwind agricultural regions (5, 6).
Fig. 1.
Distribution of land cover based on Moderate-Resolution Imaging Spectroradiometer observations from 2009. The southern Amazon (5°S to 15°S, 50°W to 70°W) is indicated by the solid white box.
Rainforest vitality is known to depend on rainfall amount and dry season length (2, 7–9), but major knowledge gaps remain regarding rainforest influences on wet season onset. Rainforest evapotranspiration (ET) accounts for 30–50% of regional rainfall (10–13), but it is unclear whether ET actively modifies or merely responds to rainfall seasonality. Credible assessments of land use contributions to recent increases in dry season length and the frequency of extreme droughts in this region (14, 15) require these gaps to be filled.
The Deep Convection Moisture Pump
Wet season onset in the tropics is generally associated with either monsoon reversals in the land–ocean temperature gradient or north–south migration of the Intertropical Convergence Zone (ITCZ), both of which are driven by seasonal changes in the distribution of solar radiation. However, wet season onset over the southern Amazon precedes the southward migration of the Atlantic ITCZ by 2–3 mo (16) and occurs without a reversal in the land–ocean surface temperature gradient (17, 18). Conventional mechanisms therefore cannot explain wet season onset over the southern Amazon. An alternative hypothesis holds that late dry season increases in rainforest transpiration may increase surface air humidity and buoyancy (18, 19). Lifting of this humid near-surface air by cold fronts moving northward from midlatitude South America (20) could cause large-scale increases in deep convection and upper-level heating (21), thereby initiating moisture transport from the tropical Atlantic. Large-scale moisture transport reinforces the conditions that favor deep convection, ultimately leading to wet season onset. We refer to this transition mechanism as the deep convective moisture pump (DCMP).
The exact processes that activate the DCMP have been unclear. Cold front incursions are strongest during the dry season (22), but deep convection is rare until lower tropospheric humidity rises late in the transition season (21). Moistening of the lowest 4 km of the atmosphere (pressures 600–700 hPa) therefore emerges as the likely key to activating the DCMP (23, 24). The source of this moisture and the processes by which moistening occurs have profound implications for understanding how land use and biomass burning affect the seasonal cycle of rainfall. For example, deforestation might sharpen the land–ocean temperature gradient (accelerating wet season onset under a conventional onset mechanism), but would also reduce surface moisture fluxes (delaying wet season onset under an ET-initiated onset mechanism).
To clarify the mechanisms involved in activating the DCMP, the first question that must be answered is whether the late dry season increase in lower tropospheric humidity primarily derives from rainforest transpiration or advection from the ocean. Previous studies on this topic have been overwhelmingly based on reanalysis products that combine available observations with numerical model simulations. These products are heavily influenced by the behavior of the underlying model in data-poor regions like Amazonia. Inadequate treatments of surface hydrology, vegetation, and turbulent mixing near the top of the atmospheric boundary layer (ABL) lead to large uncertainties in reanalysis estimates of ET, rainfall, and moisture flux convergence (MFC) (25). For example, the increase in rainfall over the southern Amazon during the dry-to-wet season transition occurs 2–3 wk earlier in the European Center for Medium-Range Weather Forecasting Interim Reanalysis (ERA-Interim) than in observations (SI Text). Enhanced rainfall and associated heating in the atmosphere directly affect reanalysis estimates of ET and MFC, potentially confounding moisture source attributions based on reanalysis products. In situ observations indicate that maximum ET leads the late dry season increase in rainfall (26–28); however, it has been unclear whether modest increases in ET can contribute sufficient moisture above the ABL at regional scales. The potential influences of aerosols on the dry-to-wet season transition are an additional source of uncertainty (29), because the aerosol climatologies used by most reanalyses neglect or underestimate seasonal and interannual variations in aerosol loading in this region (30, 31). It is therefore necessary to examine the dry-to-wet season transition by using observable quantities.
SI Text
Data Processing and Generation of Composites.
All analyzed fields are area-weighted spatial averages over the southern Amazon domain, defined as the area bounded by 5°S to 15°S and 50°W to 70°W (Fig. 1). Variables are averaged into discrete 5-d periods (pentads), where the first pentad of each year corresponds to 1–5 January, the second to 6–10 January, and so on. The annual cycle of each variable is then composited relative to wet season onset for each individual year, where wet season onset is defined as the first 5-d period for which (i) the rain rate exceeded the climatological mean; (ii) the rain rate in at least five of the eight preceding pentads was less than the climatological mean; and (iii) the rain rate in at least five of the eight subsequent pentads was greater than the climatological mean (19). Onset-relative composite time series are then constructed by averaging across years for the 40 pentads before onset and the 40 pentads after onset over six wet season transitions (2005–2006 through 2010–2011). This process yields composite time series 80 pentads (400 d) long, which are then filtered by applying and inverting fast Fourier transforms (FFTs) in the time dimension. The first six Fourier coefficients of the full time series are retained, removing variability at time scales <25 d.
Except where otherwise indicated (D, –D regression slopes, surface radiation, enhanced vegetation index (EVI), and fire CO2 emissions), uncertainties in the composite time series are represented by the filtered evolutions over the six transition seasons (seven for SIF; Table S1). Spatial variations within the southern Amazon are not considered in these uncertainty estimates, although separate analyses conducted for data separated by land cover (evergreen forest vs. all other land cover types; Fig. 1) indicate that the results are not sensitive to this distinction. All uncertainty estimates are calculated before applying FFTs, so that lower and upper bounds (where applicable) are smoothed identically to the composite mean. Fig. S7 shows full composite annual cycles for a subset of the variables included in Fig. 2, along with unfiltered onset-relative changes from each year. The latter illustrate the amplitude of the variations removed by the FFT-based low-pass filter.
Table S1.
Wet season onset dates over the southern Amazon domain for 2005–2013, along with the data used from each dry-to-wet transition
| Year | Onset pentad | Onset dates | Data |
| 2005 | 56 | 4–8 October | All except SIF |
| 2006 | 58 | 14–18 October | All except SIF |
| 2007 | 57 | 9–13 October | All |
| 2008 | 59 | 18–22 October | All |
| 2009 | 58 | 14–18 October | All |
| 2010 | 60 | 24–28 October | All |
| 2011 | 57 | 9–13 October | SIF |
| 2012 | 62 | 2–6 November | SIF |
| 2013 | 57 | 9–13 October | SIF |
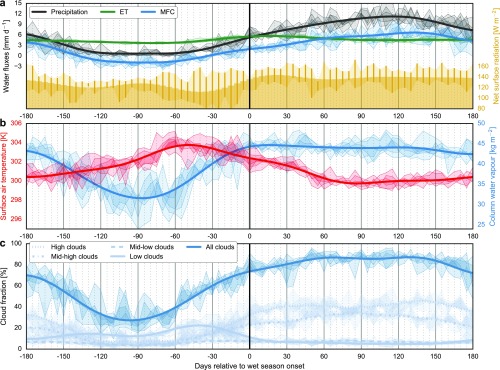
Fig. S7.
Full onset-relative annual cycle of precipitation from TRMM, ET, and moisture flux convergence from ERA-Interim, and net (downward) surface radiation flux at the surface from CERES SYN1Deg (A), surface air temperature and CWV from AIRS (B), and total and vertically-resolved cloud fraction from CERES SYN1Deg (C). Data from individual years are shown without low-pass filtering to illustrate the scale of the unfiltered variability.
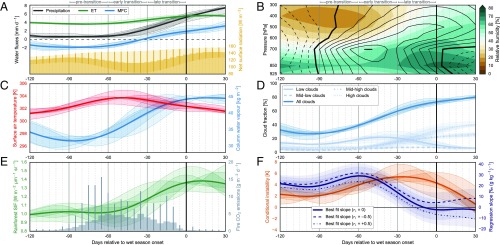
Fig. 2.
Onset-relative low-pass filtered composites of area mean precipitation from Tropical Rainfall Measuring Mission (TRMM), ET and MFC from ERA-Interim, and net absorbed surface radiation from Clouds and the Earth’s Radiant Energy System (CERES) Synoptic Radiative Fluxes and Clouds (SYN1Deg) (A); vertical distributions of RH (shading) and time rates of change in equivalent potential temperature (; contour interval 0.02 K d−1) computed from Atmospheric Infrared Sounder (AIRS) observations (B); surface air temperature and column water vapor (CWV) from AIRS (C); low (<700 hPa; 3 km above sea level), midlow (700–500 hPa; 3–5.5 km), midhigh (500–300 hPa; 5.5–10 km), high (>300 hPa; 10 km), and total cloud cover from CERES SYN1deg (D); solar-induced chlorophyll fluorescence (SIF) for rainforests from the Global Ozone Monitoring Instrument 2 and fire emissions of CO2 from Version 3.1 of the Global Fire Emissions Database (E); conditional instability in the lower–middle troposphere () based on AIRS and best-fit linear slopes of D against specific humidity () in the free troposphere based on TES (F). Shaded areas in A and C–F and error bars in A and E illustrate estimated uncertainties. Data sources, quality control criteria, and uncertainty calculations are provided in SI Text.
The timing of wet season onset and the onset-relative composite time series of precipitation are determined using Version 7 of the TRMM 3B42 daily gridded precipitation product at resolution (51). These data are widely used and have been shown to correlate well with other observationally based estimates of rainfall in the Amazon region (3). Transitions between the wet and dry seasons are identified by using the area mean climatological mean precipitation rate calculated from 18 y (1998–2015) of TRMM data. The onset dates for the 2005–2013 wet seasons are listed in Table S1.
Energy and Moisture Fluxes.
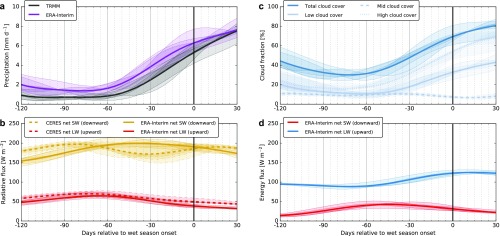
Onset-relative composite time series of ET and MFC are constructed from the ERA-Interim (52). ET in units of mmd−1 (kgmd−1) is calculated by dividing the latent heat flux (in units of Wm−2) by the latent heat of vaporization for pure water at 20 °C ( Jkg−1). MFC is calculated by averaging the moisture flux divergence diagnostic provided in the ERA-Interim product over the southern Amazon domain. The sum of ET and MFC should approximately equal precipitation, with changes in atmospheric water storage as a residual. The sum of ET and MFC (and hence precipitation) in ERA-Interim is systematically nearly twice as large as TRMM precipitation through most of the dry season (Figs. S1A and S7). The annual cycle of precipitation based on these two datasets is broadly similar, but wet season onset based on ERA-Interim is typically earlier than wet season onset based on TRMM (Fig. 1A). Wet season onset based on ERA-Interim precipitation is on average pentads earlier than that based on TRMM during 1998–2015 (as much as 40 d earlier in 10 of 18 y) and pentads earlier during the 2005–2011 analysis period (as much as 25 d earlier in 5 of 7 y).
Fig. S1.
Onset-relative time series of precipitation from TRMM and ERA-Interim (A), net fluxes of shortwave (downward) and longwave (upward) radiation at the surface from ERA-Interim and CERES SYN1Deg (B), cloud fraction from ERA-Interim (C), and upward sensible and latent heat fluxes from ERA-Interim (D). All fluxes represent area-weighted averages over the southern Amazon region during the period 2005–2011. Uncertainties represent interannual variability across six dry-to-wet transition seasons.
Cloud fraction and radiative fluxes are from Edition 3A of the Clouds and the Earth’s Radiant Energy System (CERES) Synoptic Radiative Fluxes and Clouds (SYN1deg) daily data product at spatial resolution (53, 54). Cloud fractions are retrieved by using observations from the Moderate-Resolution Imaging Spectroradiometer (MODIS) onboard the Earth Observing System (EOS) Terra and Aqua satellites (55) and observations from geostationary satellites (56). Radiation fluxes are computed by using the Fu–Liou radiative transfer model based on observed cloud and aerosol distributions and atmospheric profiles calculated by using the Goddard Earth Observing System (GEOS) Data Assimilation System. The source of the assimilated atmospheric profiles was changed from GEOS-4.1 (57) to GEOS-5.2 (58) at the beginning of January 2008. CERES SYN1deg has been processed for December 2007 by using both GEOS-4.1 and -5.2. Comparison of these two datasets over the southern Amazon domain indicates that the effects of this change on the variables used in this study are small. Relative changes associated with the switch to GEOS-5.2 are 1% in area mean total cloud fraction, 5% in the vertical profile of cloud fraction, and 1% in net downward radiation flux.
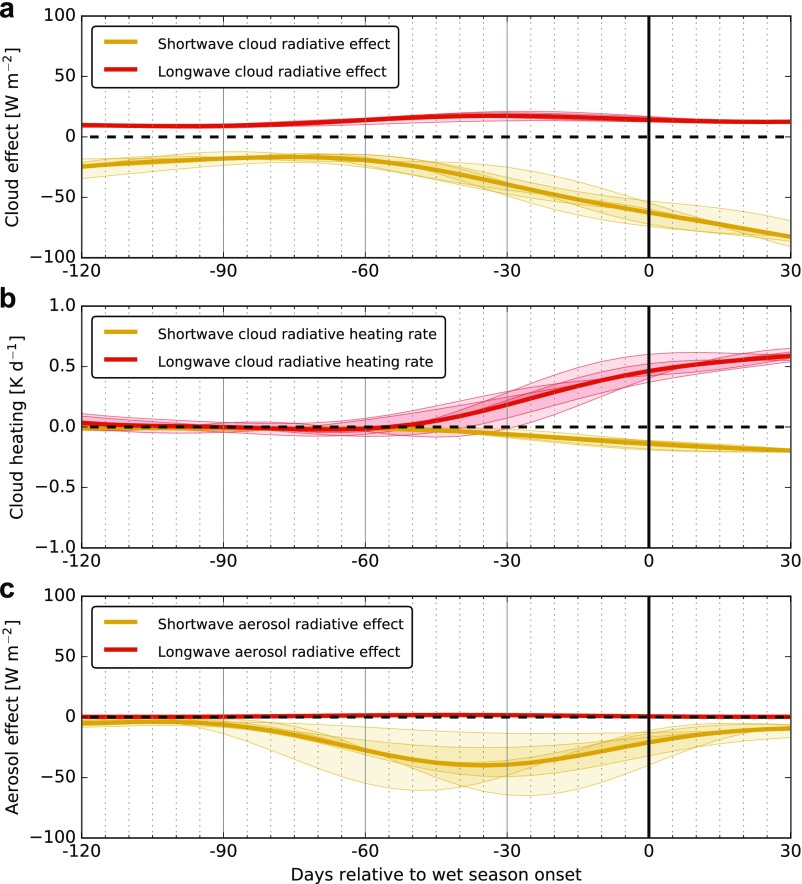
There are considerable differences between the CERES SYN1deg and ERA-Interim estimates of surface solar radiation (Fig. S1B). ERA-Interim underestimates surface insolation relative to CERES during the middle dry season (day −120 through day −75 or so), primarily because it overestimates cloud cover (cf Fig. 2D and Fig. S1B; see also estimated cloud radiative effect in Fig. S2A). By contrast, ERA-Interim overestimates surface insolation during the late dry season (day −60 through day −10), primarily due to aerosol effects (Fig. S2C) that are inadequately represented by the climatological annual cycle of tropospheric aerosols used in the ERA-Interim reanalysis system. These potential errors in surface insolation in ERA-Interim, which represent an important source of uncertainty in the precise evolution of the surface sensible and latent heat fluxes (Fig. 2A and Fig. S1D), are on order 30 W m−2. This uncertainty highlights the importance of using observationally derived variables to provide additional validation for variations in the moisture budget.
Fig. S2.
Onset-relative time series of cloud radiative effect on net downward shortwave and longwave radiation at the surface (A), cloud radiative heating due to shortwave and longwave radiation between the surface and 500 hPa (assuming a mean surface pressure of 1,000 hPa and a dry atmosphere in hydrostatic balance) (B), and aerosol radiative effect on net downward shortwave and longwave radiation at the surface (C). All variables are calculated from CERES SYN1Deg data. Uncertainties represent interannual variability across six dry-to-wet transition seasons.
Vegetation Metrics and Fire Emissions.
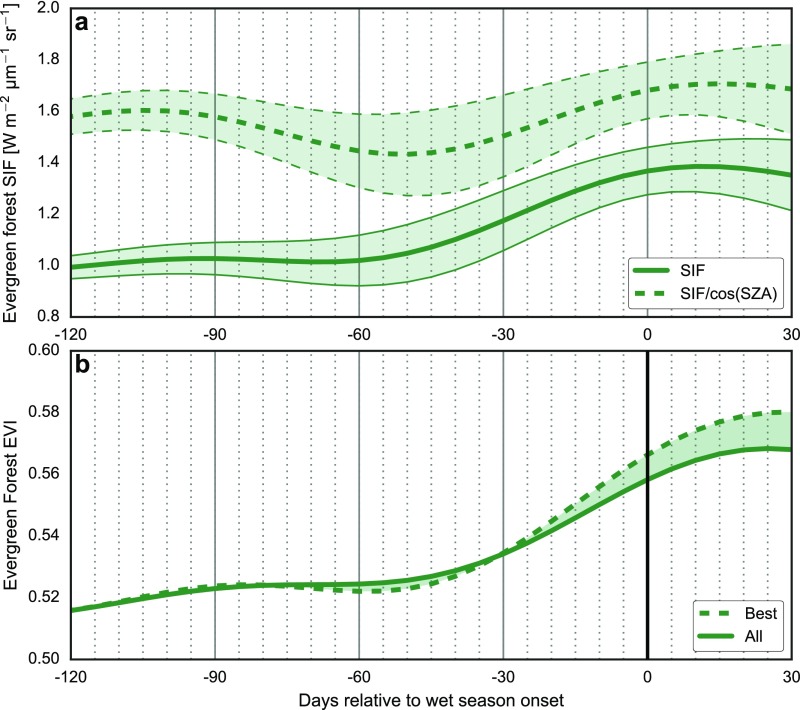
Land cover data at 500-m resolution (Fig. 1) were taken from the 2009 MODIS MCD12Q1 dataset; the SIF and EVI data shown in Fig. 2E and Fig. S4 are averaged over pixels matching the International Geosphere–Biosphere Program land cover type “evergreen broadleaf forest”. SIF, which is considered as a direct proxy for gross primary productivity, is inferred from measurements made by the Global Ozone Monitoring Instrument 2 (GOME-2) onboard the MetOp-A satellite (32). We use Version 2.6 data, which are publicly available at avdc.gsfc.nasa.gov. The original data were provided four times per month during 2007–2014, in 7- or 8-d bins depending on the number of days in the month. We use a linear regression to interpolate these data to 5-d resolution. The area-weighted mean is obtained by averaging SIF over broadleaf forest grid cells in the Southern Amazon region using a reduced-resolution version of the 2009 land cover dataset described above. SIF normalized by the cosine of the solar zenith angle (which removes the effects of seasonal variations in instantaneous incoming solar radiation across satellite overpasses) is shown in Fig. S4A for context.
Fig. S4.
Onset-relative time series of SIF from GOME-2 observations (A) and EVI calculated from MODIS observations (B). Two variations of SIF are shown, both covering the time period 2007–2014. The raw SIF data (solid line) are identical to those shown in Fig. 2E. SIF normalized by the cosine of the solar zenith angle (dashed line) is also shown for context and comparison with EVI. Uncertainty windows in both SIF estimates reflect interannual variability quantified as SDs across seven dry-to-wet transition seasons. The EVI data cover the time period 2005–2011, consistent with all non-SIF data shown in Fig. 2. Again, two variations are shown, one based on strict quality control standards (dashed) and one based on minimum quality control standards (solid; see SI Text, Vegetation Metrics and Fire Emissions for details). On average, late dry season increases in EVI lag late dry season increases in SIF by 10 15 d.
EVI is used as an alternative measure of rainforest bioproductivity. EVI was computed at 500-m resolution in 16-d increments from MODIS-derived reflectance data standardized to constant view and solar geometry. MODIS Bidirectional Reflectance Distribution Function (BRDF) parameters were taken from the MCD43A1 dataset. Reflectance at nadir view and 30° solar zenith angle was estimated as the linear combination of coefficients in MCD43A1 and the RossThick and LiSparseR kernel functions computed at the specified angles. EVI was computed from reflectance in near-infrared, red, and blue bands (59) and masked outside of [−1, 1]. Sensitivity analysis indicated that the choice of solar zenith angle affected the mean value of the EVI, but not the phase or amplitude of the seasonal cycle. Pixels were masked based on quality flags in the MODIS MCD43A2 dataset. The most restrictive quality control retained only best quality pixels (full BRDF inversion with low residual error), whereas the more permissive quality control retained all pixels with potentially valid data (BRDF inversion completed). The range between these two estimates is shown in Fig. S4B as a measure of uncertainty in the mean evolution of EVI. We generate EVI data using 16-d means at 8-d resolution and linearly interpolate these data to 5-d resolution. Comparison of the seasonal evolutions of SIF and EVI (Fig. S4) shows that changes in SIF lead changes in EVI by 10–15 d, indicating that increases in photosynthesis lead increases in vegetation greenness during the late dry season in this region.
Daily estimates of CO2 emissions from fires are based on Version 3.1 of the Global Fire Emissions Database (GFED3) (60, 61). Error bars on GFED3 estimates of fire emissions indicate the minimum and maximum emissions during the 6-y analysis period.
Atmospheric Thermodynamic Variables.
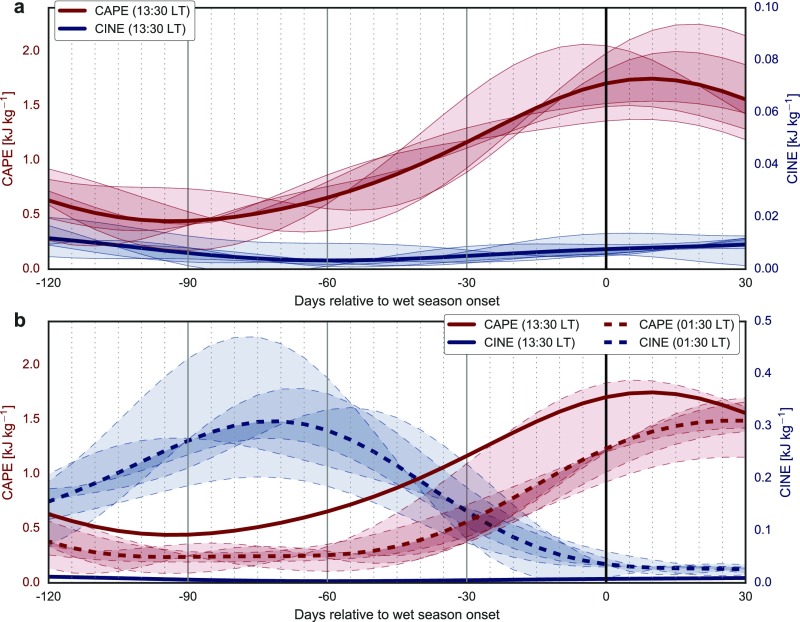
Observations of water vapor and temperature are from Version 6 of the AIRS Level 3 daily gridded product at resolution (62, 63). We use the AIRS TqJoint product based on combined AIRS and Advanced Microwave Sounding Unit observations (AIRX3RET), which provides consistent gridded profiles of temperature and water vapor on a common vertical grid with eight pressure levels between 1,000 and 300 hPa (previous versions of the AIRS data have reported temperature and water vapor on slightly different vertical grids). We use TqJoint because it facilitates the calculation of equivalent potential temperature and other atmospheric stability metrics that require knowledge of temperature and water vapor at common locations in space and time. Only data from ascending orbits (13:30 local time) are used; this choice is justified by delays of almost 2 mo between the development of daytime convective instability and the development of nighttime convective instability (Fig. S3). The area mean equivalent potential temperature () is calculated from gridded AIRS data at daily time resolution according to the equation
| [S1] |
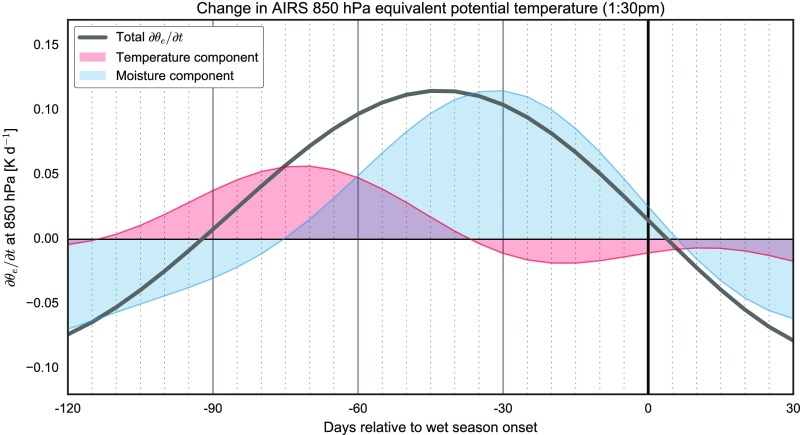
where is the dry potential temperature, is the latent heat of vaporization at 0°C, is the water vapor mass mixing ratio, is the specific heat of dry air at constant pressure, and is the temperature. The time rates of change in early afternoon and early morning are calculated as centered differences in the daily time series of area mean . Temperature and moisture contributions to changes in (Fig. S5) are calculated following the method used by Li and Fu (19). Calculations of CAPE and convective inhibition energy (CINE) (Fig. S3) include the virtual temperature correction (64). CAPE and CINE are calculated for all grid cells for which the necessary surface air and profile variables (pressure, temperature, and water vapor mass mixing ratio) are available within the TqJoint dataset. These gridded daily values are then aggregated into area-weighted 5-d (pentad) mean values.
Fig. S3.
Onset-relative composite time series of area-weighted 5-d mean CAPE (red lines) and CINE (blue lines) calculated from daily AIRS profiles of temperature and water vapor during ascending (daytime) (A) and descending (nighttime) (B) orbits. Larger values of CAPE indicate greater convective instability, whereas larger values of CINE indicate a larger energetic barrier to convection. Note different ranges of the CINE axis between A and B. Mean evolution of daytime values are shown in B to facilitate comparison. Uncertainties represent interannual variability across six dry-to-wet transition seasons.
Fig. S5.
Onset-relative composite time series of temperature (red shading) and moisture (blue shading) contributions to the time rate of change in (thick gray line) at 850 hPa based on AIRS observations. Temperature and moisture contributions are calculated following Li and Fu (19).
Isotopic Data.
The deuterium content of a water sample is expressed as the relative ratio D in parts per thousand (‰), where
| [S2] |
is the ratio of the number of HDO molecules () to the number of H2O molecules () and is the corresponding / ratio in a reference standard (here Vienna Standard Mean Ocean Water, for which ). Joint distributions of specific humidity () and D are from retrievals made using the TES on the EOS Aura satellite (49). The data have been processed by using Version 6 of the TES retrieval algorithm (v006_Litev01.00), which simultaneously estimates the volume mixing ratios of HDO, water vapor, methane, and nitrous oxide (36). Retrieving these four species together substantially improves the vertical resolution, and enables separate retrievals of D in the ABL (surface to 825 hPa) and free troposphere (FT) (750–348 hPa). The onset-relative evolution of these two quantities is shown in Fig. S8. The HDO averaging kernel is primarily sensitive to , where is the HDO/H2O ratio (36, 49). Fig. S9 shows a typical TES HDO averaging kernel for daytime retrievals over the southern Amazon during the late dry season (October 2006), which contains three rows that peak at pressures of 825 hPa or higher and six rows that peak between 750 and 350 hPa. The daytime retrievals are therefore capable of resolving the deuterium distribution in the ABL. Nighttime TES retrievals of water vapor and HDO over the southern Amazon are only weakly sensitive to levels between the surface and 825 hPa, so we omit estimates of ABL D from descending orbits (01:30 local time). We calculate pressure-weighted column mean and water vapor volume mixing ratio for the ABL and FT and then use these quantities to calculate D and water vapor mass mixing ratio in each layer. All valid observations over the southern Amazon region are then binned into onset-relative pentads before averaging or calculating best fit lines (Linear Fits).
Fig. S8.
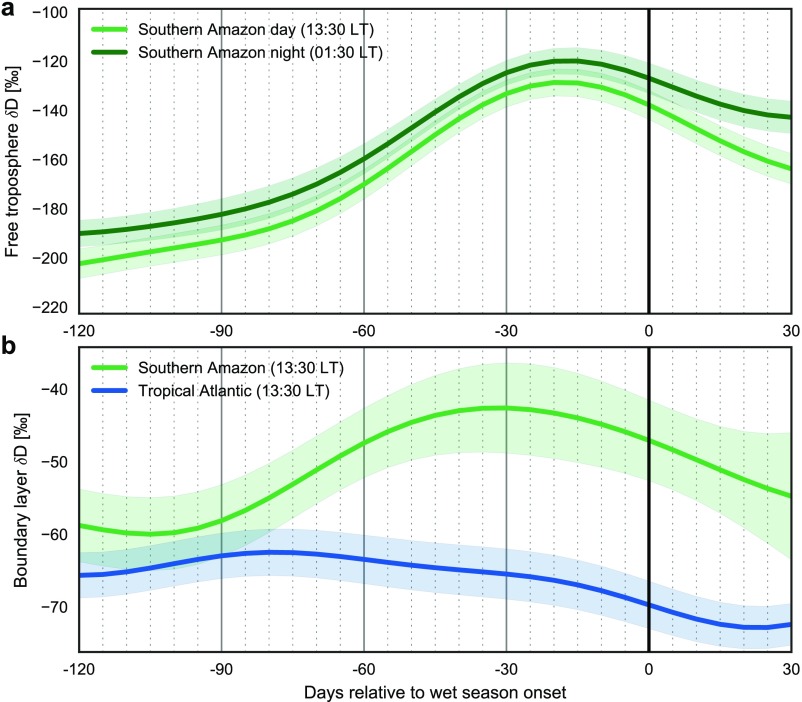
Onset-relative composite time series of area-mean D of water vapor in the free troposphere (750 to 348 hPa) (A) and the ABL (surface–825 hPa) (B) based on TES satellite retrievals from ascending (13:30 local time) and descending (01:30 local time) satellite overpasses. Data in B are shown for ascending overpasses only because TES is not sufficiently sensitive to ABL D during descending overpasses (see also Materials and Methods and Fig. S9). The evolution of ABL D over the tropical Atlantic (0–10°N, 30–55°W) is also shown for reference. Uncertainty bounds include statistical and measurement uncertainties propagated from individual TES measurements.
Fig. S9.
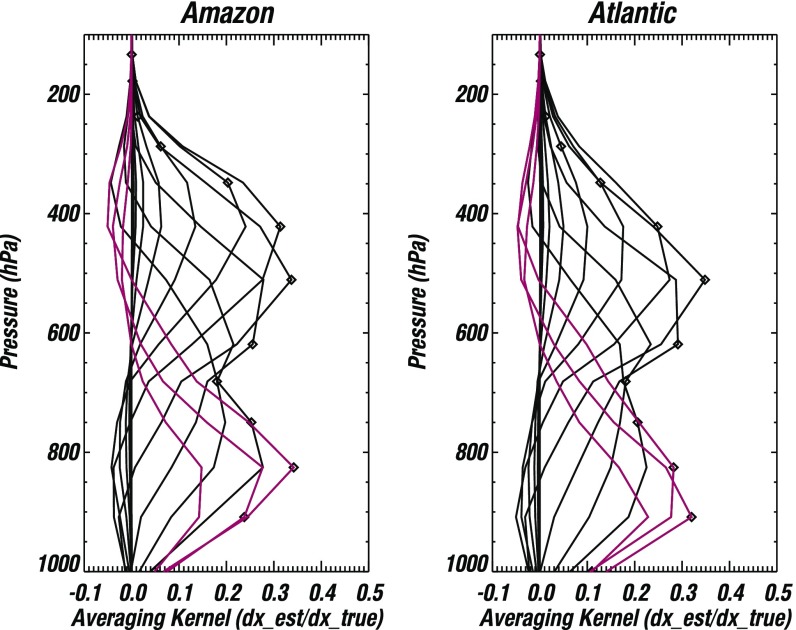
Mean averaging kernels for TES observations of water vapor and HDO vapor from ascending orbits (13:30 local time) over the southern Amazon (Left) and the tropical Atlantic (Right) during October 2006, representative of the late dry season in the southern Amazon. Diamonds indicate pressure levels in the TES retrieval vertical grid. Averaging kernel rows for levels between the surface and 800 hPa (red lines) contribute to estimates of D in the boundary layer (Fig. S8B); averaging kernel rows for levels between 800 hPa and 350 hPa contribute to estimates of D in the free troposphere (Fig. S8A). The averaging kernel for descending orbits (01:30 local time) over the southern Amazon is similar for pressures <700 hPa, but sensitivity in the boundary layer is substantially reduced (the peak sensitivities of averaging kernel rows for pressures >800 hPa shift upward). We therefore do not consider retrievals of ABL D (Fig. S8B) collected during descending passes (01:30 local time).
The TES data have been screened by using recommended quality control criteria (36): The cloud effective optical depth must be 0.4, and the degrees-of-freedom for signal for the entire profile must be 1. Reasonable adjustments to the quality control criteria mainly affect the data yield and do not alter the qualitative nature of the results. Uncertainties for the TES time series are propagated from individual measurement uncertainties (49). Typical uncertainties in the free troposphere over the southern Amazon are 7–10% on and 3–5% on . The mean degrees of freedom for signal for the vertical layers used here is 0.5–0.6 in the ABL ( 825 hPa) and 1.21.6 in the free troposphere (750 348 hPa). These values indicate that the data are able to capture qualitative variations in both layers and quantitative variations in the free troposphere, but capture only 50–60% of the variability in ABL D (i.e., the seasonal variations in daytime ABL D may be larger than indicated by Fig. S8B). Evaluating ABL D by using observations between the surface and 908 hPa (i.e., omitting the 825 hPa level) reduces the degrees of freedom for signal by about half and shifts estimates of ABL D upward by 5 to 10‰, but the seasonal evolution is qualitatively unchanged.
Boundary Layer D.
The observed evolution of D in the ABL provides independent support for two of the key physical arguments discussed in the main text: strong rainforest transpiration (which maintains high D in ABL vapor) and a deepening boundary layer during the transition season (which increases the amount of high-D air within the ABL layers of the TES averaging kernel). Analysis of the TES averaging kernels (Fig. S9) allows us to reject the possibility that the observed increase in ABL D during the late dry season is explained by cross-correlations between the ABL and FT. The ABL retrieval partially depends on the FT retrieval because the full profile is estimated by using the equation
| [S3] |
where is the estimated vertical profile of , is the averaging kernel, is the a priori profile of used to regularize the retrieval, and is the true profile of . Changes in in the FT will therefore affect retrievals of in the ABL and vice versa (Fig. S8). Changes in the FT during the late dry season will have a larger impact on the ABL because the fractional increase in is larger in the FT and the retrieval is performed using , for which changes reflect fractional variability. We can estimate how much increases in the FT HDO/H2O ratio raise the ABL estimate by multiplying (for example) the 908-hPa row of the averaging kernel (red line with diamond located at 908 hPa in Fig. S9) by a vector containing values of ∼0.06 for the 750- to 348-hPa levels (corresponding to the magnitude of the increases in in the FT). This estimate gives an upper bound on the error from cross-correlation because the higher pressures show lower variability than the lower pressures, and shows that cross-correlation with the FT can account for at most a 4‰ increase in D in the ABL, a factor 4–5 smaller than the observed change. Using more realistic values that account for the vertical profile of fractional changes suggests a more likely error of 2‰. We can therefore reject the hypothesis that increases in ABL D are caused by cross-correlation with FT D.
Comparison with D in the ocean ABL further confirms that this increase cannot be attributed to advection from the nearby ocean. The mean value of D in the ABL over the southern Amazon during October 2006 (for example) was −54 6.2‰, whereas that in the ABL over the tropical Atlantic (0–10°N, 30–55°W) was −69 4.7‰ (Fig. S8B). These estimates imply a positive bias of as much as 10‰ in the ABL (D in the ABL over the tropical ocean is generally approximately −80‰), but the Atlantic ABL is nonetheless significantly more depleted than the southern Amazon ABL. Transport from the Atlantic therefore cannot be the source of the observed increase in ABL D. This increase must therefore be due to an increase in the transpiration contribution to the vapor observed in these layers by TES, as transpiration is the only moisture source that can increase the near-surface isotopic composition relative to observed values during the peak dry season (−59 9‰).
Linear Fits.
Linear fits between water vapor mass mixing ratio () and D (Fig. 2F) are calculated by using the same data points used to calculate mean D in the FT (Fig. S8A), but without separating the data into daytime and nighttime observations (this choice is justified by the lack of significant differences in FT D between daytime and nighttime retrievals shown in Fig. S8A). Linear fits are calculated by using the full set of quality-controlled TES retrievals over the southern Amazon aggregated into onset-relative 5-d periods (each regression includes data from all six wet season transitions where available). The fitting algorithm is based on that proposed by York (65, 66) and accounts for profile-specific uncertainties in both and D (49). This algorithm also requires information about cross-correlations between errors in and errors in D for individual measurements. No information is available to constrain these correlations for the TES observations used in this analysis. We therefore assume that the errors are uncorrelated () and assess the sensitivity of the best-fit slopes to a range of cross-correlations between (slopes and uncertainties are shown for , , and in Fig. 2F). Our conclusions regarding moisture source evolution during the transition season are not sensitive to the value of , although estimates of the best fit slope for larger positive and negative values of diverge after wet season onset.
The number of samples used for fitting ranges from 37 to 191. TES retrievals of water vapor volume mixing ratios are converted to mass mixing ratios before linear fitting. Monte Carlo simulations are used to constrain uncertainties in the linear fits (50, 67). A total of 5,000 fits are performed for each onset-relative pentad by randomly perturbing the least squares estimates of and D by amounts consistent with the associated observational uncertainties. Errors in these synthetic measurements are assumed to be independent and uncorrelated (i.e., the correlation only affects the initial fit). The Monte Carlo slopes are within 1.5% of the slopes based on the original data on average, with almost all of the slopes (95%) within 10%. The error bars shown in Fig. 2F are based on twice the uncertainty in the Monte Carlo-based slopes, which are propagated from the 5,000 individual estimates (50). The vast majority (85%) of these uncertainties are within 10% of the uncertainty estimates based on the best fit line to the original data. The statistic for the Monte Carlo fits ranges from 0.984 to 1.005, with an average value of 0.996. The linear fits shown in Fig. 2F are based on column means in the free troposphere (750–348 hPa), but the results are qualitatively unchanged when the analysis is performed using data from only the lower–middle troposphere (750–619 hPa). Indeed, the joint distributions and linear fits shown in Fig. 3 are based on and D in the lower troposphere (825–619 hPa). The qualitative evolution of the distributions and slopes described in the text is not sensitive to this choice; however, using lower tropospheric values in Fig. 3 has the added benefit of putting the centers of activity in a portion of the q–D phase space where the theoretical models are more easily distinguished. Uncertainties on the linear fits shown in Fig. 3 are 95% confidence intervals based on 5,000-member bootstrapping simulations using calculated uncertainties in the best fit slope and intercept.
Fig. 3.
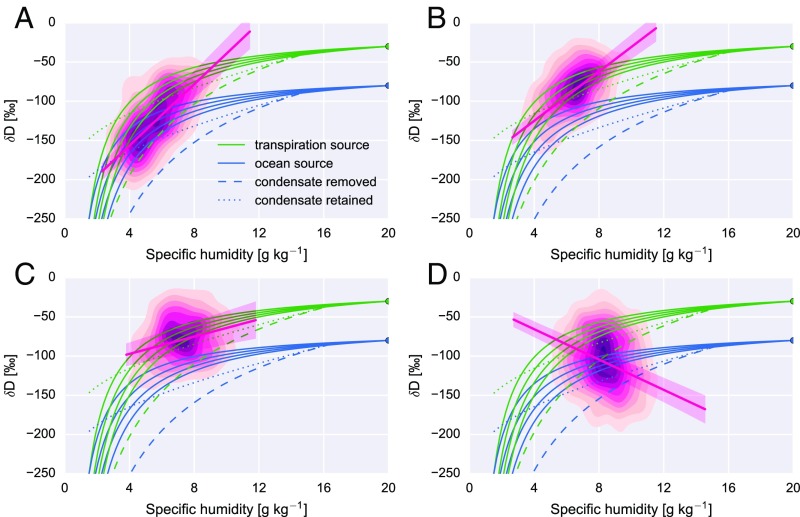
Joint distributions of specific humidity () and the deuterium content of water vapor (D) in the lower troposphere (825–600 hPa) based on TES observations during the pretransition stage (day −90 to −60) (A), early transition (day −60 to −30) (B), late transition (day −30 to 0) (C), and the first 3 mo of the wet season (day 0 to +90) (D). The joint behaviors of and D under three types of idealized vertical mixing are also shown. Solid green and blue lines represent mixing (no condensation) between four dry air masses representing the dry season free troposphere and a moist air mass representing either local ET (green; = 20 g kg−1; D = −30‰) or ocean evaporation (blue; = 20 g kg−1; D = −80‰). Dashed green and blue lines represent pseudoadiabatic Rayleigh distillation from the approximate top of the ABL, in which condensation occurs in a rising air parcel and is immediately removed as precipitation. Dotted green and blue lines represent reversible moist adiabatic ascent from the approximate top of the ABL, in which condensation occurs and is assumed to remain in the parcel. These idealized models are described in detail in SI Text.
Our interpretation of changes in water vapor isotopic composition may be confounded by other factors. For example, reductions in the –D slope after day −60 may be attributed to either large-scale moisture convergence or progressive removal of HDO during the formation and reevaporation of rainfall (38, 68). The latter would cause us to underestimate the role of transpiration as wet season onset approaches, and therefore does not weaken our conclusion that rainforest transpiration is the primary source of free tropospheric moisture during the initial stages of the dry-to-wet transition, and particularly to the SCMP that peaks between day −60 and −30. We have examined and ruled out several other potential confounding factors that could affect our interpretation, including spurious correlations resulting from diurnal variability (day/night), interannual variability (individual years), land cover (rainforest/savanna), and aerosol pollution (clean/polluted). Best fit slopes during the pretransition and early transition stages remain strong and positive, with similar slopes for each subset.
Isotopic Mixing and Plume Models.
Three theoretical models are used to establish context for interpreting seasonal and subseasonal changes in specific humidity and D (Fig. 3). The first of these represents mixing between two air masses with different water vapor isotopic compositions (33, 37):
| [S4] |
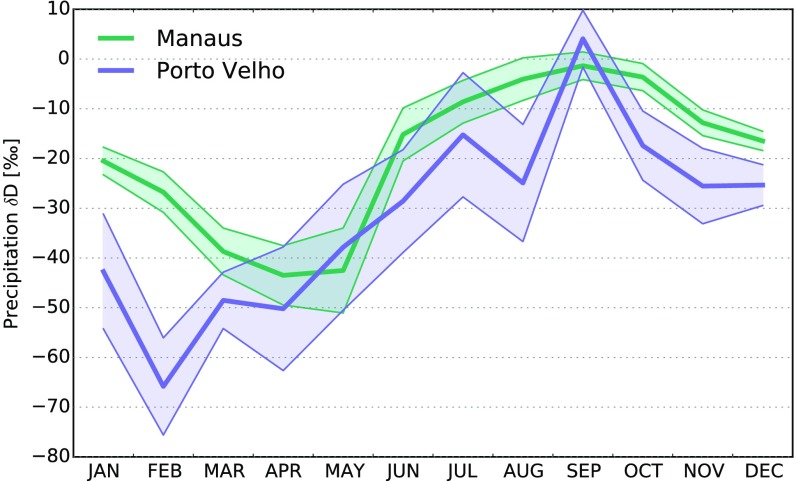
The initial specific humidity and isotopic ratio represent the evaporative moisture source, while represents the isotopic composition of dry free tropospheric air. We consider two moisture sources: air with water vapor transpired from the rainforest (δ0=−30‰) and air with water vapor evaporated from the ocean (δ0=−80‰). In both cases, gkg−1, consistent with RH ∼70–80% at typical daytime surface air temperatures during the southern Amazon transition season (Fig. 2C). The value of δ0=−80‰ for the ocean source is a typical assumption for ocean evaporate (33, 69). The value of for rainforest transpiration is based on the assumption that transpired water vapor carries the isotopic composition of local precipitation (34, 37). The precipitation-weighted mean D based on samples collected for the Global Network of Isotopes in Precipitation is ∼−38‰ at Porto Velho and −26‰ at Manaus (Fig. S6). Observations collected in other locations with clearly delineated dry and wet seasons indicate that the isotopic content of bound water (i.e., the water accessed by tree roots) in these ecosystems is weighted toward that of rainfall during the dry and transition seasons, when rain rates are lower, runoff fractions are smaller, and rainfall is more readily absorbed by soil (70). Precipitation during the dry and transition season is more enriched in deuterium than precipitation during the wet season (Fig. S6); we therefore set δ0=−30‰ for the rainforest source as a conservative estimate of deuterium enrichment in transpired water vapor relative to ocean evaporate. The free tropospheric dry end member is assumed to have gkg−1 and isotopic ratios () ranging from −250‰ to −400‰ at 50‰ intervals, consistent with the approximate range of TES observations at hPa during the peak of the dry season.
Fig. S6.
Annual variability of monthly mean D in precipitation according to samples collected at Porto Velho (8.77°S, 63.92°W) and Manaus (3.12°S, 60.02°W) under the Global Network for Isotopes in Precipitation (GNIP) measurement program. Data at Porto Velho were collected sporadically between 1965 and 1981, with the sample sizes ranging from four (July and August) to nine (November). Data at Manaus were collected sporadically between 1965 and 1990, with sample sizes ranging from 10 (September) to 17 (December). Effectively zero fractionation occurs during rainforest transpiration (34). D in transpired water vapor should therefore approximately match D in soil water; lacking direct observations, we estimate this as the precipitation-weighted mean D in rainfall. The precipitation-weighted mean D based on these data are approximately at Porto Velho and at Manaus. Previous studies suggest that this should represent a lower bound on D in soil water, because the isotopic content of bound water accessed by tree roots in ecosystems with clearly delineated dry and wet seasons is weighted toward that of rainfall during the dry and transition seasons, when rain rates are lower and runoff fractions are smaller (70). GNIP data can be accessed at www.iaea.org/water.
The other two models trace the evolution of a single saturated air mass, rather than mixing between two air masses (33, 37). The first of these is the widely used pseudoadiabatic Rayleigh model (69, 71), which is based on the assumption that all condensate falls out immediately after it forms (i.e., precipitation efficiency equals one) and is given by the equation:
| [S5] |
The second is for a reversible moist adiabatic process, often referred to as the “closed system” model (71). This model is based on the assumption that all condensate remains within the air mass (i.e., precipitation efficiency equals zero), with vapor and (liquid) condensate in isotopic equilibrium:
| [S6] |
Both models assume an undilute cloud plume, such that no environmental air is entrained into the cloud. Although both models are heavily idealized, they represent useful limiting cases: The Rayleigh model represents deeper rain-generating convection, whereas the closed system model represents shallow convection that produces condensate, but no rainfall. In this study, the fractionation factor is assumed to equal the temperature-dependent equilibrium fractionation factor between liquid and water vapor in both models (72). The cloud plume models are integrated from the approximate area mean saturation specific humidity at 850 hPa for the corresponding stage of the dry-to-wet season transition, with as generated by Eq. S4 for the corresponding moisture source. Given the tight clustering of the mixing curves at these specific humidities, both the Rayleigh and closed system models are integrated only from the mixing curve with .
GOAmazon Data.
Ground-based measurements provided by the GOAmazon field campaign were collected at Manacapuru, Brazil (3°12′S, 60°35′W) from January 2014 through November 2015. The following measurements were used in generating Fig. 5. Radiosonde vertical profiles of zonal and meridional wind speed and direction, temperature, and RH were collected daily at 0530, 1130, 1430 (occasional), 1730, and 2330 GMT. An aerosol observing system provided in situ aerosol absorption and scattering coefficients as a function of particle size and wavelength at the surface. We use cloud condensation nuclei number concentrations, which are available at a temporal resolution of 1 min.
Fig. 5.
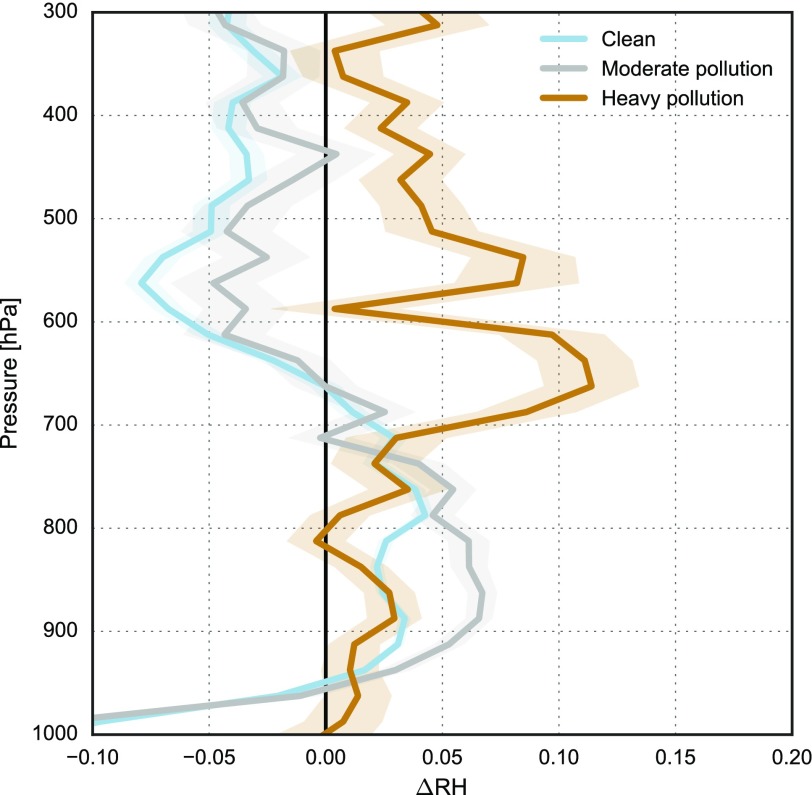
Changes in the vertical profiles of RH (RH) associated with shallow convection under clean conditions [Cloud condensation number concentrations (CCN) 500 cm−3], moderate aerosol pollution (500 cm−3 < CCN ≤ 1,000 cm−3), and heavy aerosol pollution (CCN 1,000 cm−3). CCN, RH profiles, and convective occurrence are based on observations collected during the Green Ocean Amazon (GOAmazon) field campaign (SI Text). RH is reported in absolute differences.
Cloud base, top, and cloud water content are based on radar reflectivities from an upward pointing W-band radar (95.4 GHz; valid range −90 to 50 dBZ) with a temporal resolution of 1 s and a vertical resolution of 30 m. These data are supplemented by observations collected by using a Micropulse Lidar (MPL), which is a ground-based optical remote sensing system that determines the top and base heights of clouds using a 30-s cloud mask. Time-resolved signals for the transmitted and backscattered pulse enable real-time detection of clouds. To avoid errors caused by attenuation of the radar and MPL pulses, we use both radar reflectivity and MPL backscattering to identify shallow convective clouds, which are defined as clouds with tops <4 km height above ground level and depths 2 km.
Vertical profiles of changes in RH (RH) are calculated based on radiosonde measurements taken within 2 h before and 2 h after the occurrence of shallow convective clouds. CCN measurements are 30-min averages centered on the launch time of the “before” radiosonde. Profiles of RH associated with shallow convection under “clean,” “intermediate,” and “polluted” conditions are qualitatively insensitive to changes of 200 cm−3 in the threshold values, the choice of time period (2014, 2015, or both), and the precise definition of the “transition season” (here defined as 19 June through 22 November for both years).
Stages of the Dry-to-Wet Season Transition
Fig. 2 shows the evolution of atmospheric, land surface, and vegetation properties over the southern Amazon during the transition season. Reanalysis ET and MFC are included for context; all other quantities are derived from satellite observations. Each time series is a sequence of 5-d means composited relative to wet season onset (day 0; Materials and Methods). Negative times indicate days before wet season onset. Wet season onset typically occurs in middle October over the southern Amazon. Specific onset dates are listed in Table S1.
We divide the transition season into three stages: a pretransition (90–60 d before onset), an early transition (60–30 d before onset), and a late transition (30–0 d before onset). The pretransition stage marks a turning point from seasonal drying to seasonal moistening. This turning point is reflected in column water vapor (CWV; Fig. 2C), but does not emerge in precipitation until the following stage (Fig. 2A). Surface air temperature (Fig. 2C) and reanalysis sensible heating (Fig. S1) increase during the pretransition, consistent with a brief rise in absorbed surface radiation (Fig. 2A) that often reverses as aerosol loading increases (see also Fig. S2). Changes in the vertical profile of relative humidity (RH) suggest that enhanced sensible heating deepens the daytime ABL, mixing dry free tropospheric air into the ABL and moist ABL air into the free troposphere (Fig. 2B). Increases in low cloud cover (Fig. 2D) also imply ABL growth and more frequent shallow cumulus. Biomass burning emissions increase during this phase (Fig. 2E), consistent with dry conditions.
Several important changes in moist thermodynamics and atmospheric stability begin during the pretransition. Contours in Fig. 2B show the time rate of change in equivalent potential temperature (), a measure of moist entropy. Decreases in with height indicate conditional instability, under which convection may be triggered if condensation occurs in the lower troposphere. We quantify conditional instability as the difference in between 850 hPa, slightly above the ABL top, and 500 hPa, in the middle troposphere (Fig. 2F). Larger positive values indicate greater potential for moist convection to occur. Positive in the lower troposphere after day −90 causes conditional instability to grow. Positive changes in can arise from net warming (via diabatic heating or thermal advection) or moistening (via upward or lateral moisture transport). The lower tropospheric winds are divergent over almost the entire southern Amazon during the pretransition stage, with net exports of both heat and moisture (Fig. 2A). Increases in lower tropospheric must therefore arise from local processes, such as latent and radiative heating associated with low clouds, upward mixing of moist air in shallow convection, or radiative heating due to aerosols.
The early transition is characterized by increases in rainfall and rainforest photosynthesis, along with continued destabilization of the atmosphere. Surface air temperature (Fig. 2C) plateaus, but shallow convection intensifies, as indicated by strong positive within the lower troposphere (Fig. 2B) and continued increases in low cloud cover (Fig. 2D). Conditional instability continues to grow (Fig. 2F), as increases in convective available potential energy (CAPE) and decreases in convective inhibition confirm the development of an increasingly favorable environment for convection (Fig. S3). Moistening accelerates in the lower troposphere and begins to penetrate into the upper troposphere (Fig. 2 B and C). We infer rainforest photosynthesis and plant transpiration from SIF, which scales with gross primary productivity (32). SIF increases from approximately day −60 (Fig. 2E), broadly consistent with the evolution of reanalysis ET (Fig. 2A) and other satellite-derived vegetation indices (Fig. S4). The increase in reanalysis ET between days −60 and −30 (1 mmd−1; Fig. 2A), which is similar in magnitude to observed increases in ET (27), can account for most of the early transition increase in rainfall (1.5 mmd−1).
The late transition marks a shift from shallow to deep convection. The center of increasing moves upward from the lower middle troposphere (near 700 hPa) to the upper middle troposphere (near 500 hPa). The advent of regional-scale deep convection drives continued increases in precipitation (Fig. 2A), but halts and then reverses the trend in conditional instability (Fig. 2F). The evolution of conditional instability may be understood as follows. Shallow convection during the pretransition and early transition transports moist entropy to the lower troposphere, increasing conditional instability and eroding the thermodynamic barrier to deep convection. Deep convection during the late transition consumes conditional instability and converts its underlying potential energy into the kinetic energy of the monsoon circulation (21). Temperature changes play an important role in increasing lower tropospheric during the pretransition, but most of the early transition increase is due to rising humidity (Fig. S5). We therefore refer to this process as the shallow convection moisture pump (SCMP). SIF, enhanced vegetation index, and ET continue to increase during the late transition. Increases in ET between day −30 and onset (1 mmd−1) account for less than a third of the rise in rainrate (3 mmd−1), implying that late-transition increases in RH and deep convection are primarily fueled by large-scale moisture convergence.
Water Vapor and its Isotopic Composition
The moisture source analysis discussed above references reanalysis estimates of ET and MFC, which may be unduly influenced by biases in the model-generated background state. We therefore supplement this analysis by examining the isotopic content of water vapor. Stable water isotopes are valuable tracers of the origin and history of air masses. Molecular differences among common isotopes (such as H216O and HDO) cause fractionation during most phase transitions: Heavier isotopes (HDO) preferentially condense, whereas lighter isotopes (HH216O) preferentially evaporate (33). Evaporation from the ocean surface and condensation during transport both deplete the deuterium content of water vapor relative to its source. By contrast, no fractionation occurs during steady-state transpiration, so that the mean isotopic composition of transpired vapor is virtually identical to that of soil water (34, 35). Here, we evaluate the joint evolution of water vapor and its deuterium content (D; Materials and Methods) in the free troposphere (750–348 hPa) over the southern Amazon using satellite observations (36).
The atmosphere over the southern Amazon has two main moisture sources: rainforest ET and ocean evaporation (10). Under thermodynamic equilibrium conditions, D in tropical ocean evaporate has an isotopic composition of approximately −70 to −80‰. Estimating the isotopic composition of soil water as that of local rainfall (SI Text), D for rainforest ET is approximately −20 to −40‰ (Fig. S6). We can therefore treat ocean evaporation and rainforest ET as isotopically distinct moisture sources, with rainforest ET relatively enriched in deuterium. If free tropospheric moistening is dominated by upward mixing of local ET, then the largest specific humidities in the free troposphere will be associated with the highest values of D. If moistening is instead dominated by transport from oceanic sources, then the larger specific humidities will be associated with lower values of D. The evolution of moisture sources in the free troposphere over the southern Amazon can therefore be diagnosed by using linear fits of D against specific humidity (). These linear fits have larger positive slopes when the primary moisture source is upward mixing of ET, and smaller or negative slopes when the primary moisture source is large-scale transport.
Fig. 3 shows distributions of TES measurements of lower tropospheric and D during the three stages of the transition and the first 90 d of the wet season. Joint variations of and D predicted by several theoretical models are also shown for context. These theoretical models are organized into two groups. The first group (green lines) corresponds to a local ET moisture source (D = −30‰). The second group (blue lines) corresponds to an ocean evaporation moisture source (D = −80‰). The models correspond to dry mixing, reversible moist adiabatic ascent, and Rayleigh distillation (33, 37). The dry mixing model represents intermixing of two air masses without condensation, whereas the other two models track the evolution of a single undilute air parcel undergoing lifting and condensation (see SI Text for details).
During the pretransition (Fig. 3A), the peak of the joint distribution based on TES observations matches expectations for the subtropical free troposphere: dry air with low D descending from the upper troposphere mixed with air rising from the tropical ocean ABL (33). However, the distribution also contains a moist tail that is highly enriched in deuterium and can only be explained by upward mixing of local ET. The -D slope during the pretransition is large and positive, as expected for the case in which moistening is dominated by upward mixing of transpired water vapor. The entire distribution shifts upward and toward the right during the early transition (Fig. 3B), indicating moister air with larger D. This distribution, which corresponds to the peak activity of the SCMP (Fig. 2B), is consistent with a dominant local ET moisture source. The –D slope for this stage remains large and positive, but is slightly reduced from the pretransition because dry, depleted observations are less common. The center of the distribution during the late transition is similar to that during the early transition, but with an increased prevalence of moist air with low D (Fig. 3C). This shift is consistent with enhanced MFC (more vapor from the nearby ocean; Fig. 2A) and more frequent deep convection (more distillation of heavy isotopes via convective precipitation; Fig. 2 B and D), and results in a substantially reduced –D slope relative to the early transition. The moist, low-D tail of the late-transition distribution becomes the center of the distribution during the wet season (Fig. 3D). The wet season –D slope is negative due to repeated distillation of free tropospheric vapor by deep convection (33, 38). The onset-relative evolution of –D slopes over the southern Amazon (Fig. 2F) can thus be understood as a trajectory in the –D phase space (Fig. 3) that traces three paradigms in sequence: dry/depleted through moist/enriched to moist/depleted.
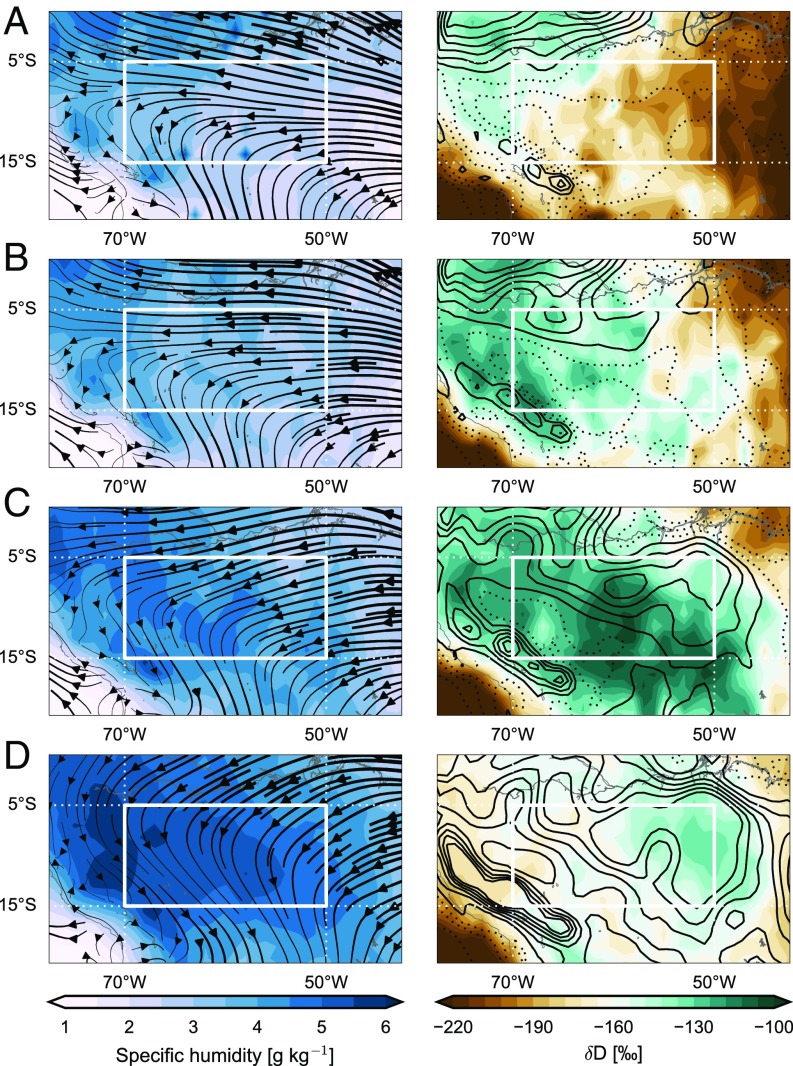
Spatial distributions of water vapor and D in the free troposphere (Fig. 4) provide additional context. During the pretransition, large values of and D are limited to the heavily forested northwestern corner of the domain (Fig. 4A). Moist, deuterium-enriched air then spreads south and east across the domain as area mean precipitation increases (Fig. 4 B and C). This propagation broadly matches the northwest-to-southeast migration of wet season onset (39). The spatial gradient of D reverses during the wet season (Fig. 4D), when deuterium-rich water vapor is located in the northeast, close to the ocean, but water vapor concentrations are largest in the west. These wet season distributions are consistent with transport from the tropical Atlantic feeding regional-scale deep convection, which keeps the free troposphere moist but depleted of deuterium. The transition to an oceanic moisture source and the removal of deuterium in convective rainfall both contribute to the wet season anticorrelation between and D. Wet season onset typically occurs latest over the northeastern corner of the domain (39). Colocated maxima in D and MFC (Fig. 4 C and D) suggest that onset there relies on large-scale moisture convergence forced by deep convective heating, as opposed to the ET-driven onset that prevails over most of the domain.
Fig. 4.
Distribution of specific humidity (Left) and D (Right) in the free troposphere based on TES observations during the pretransition (day −90 to −60) (A), early transition (day −60 to −30) (B), late transition (day −30 to 0) (C), and early wet season (day 0 to +90) (D). Winds at 850 hPa (Left) and vertically integrated MFC (Right) based on ERA-Interim are also shown for each stage of the transition. The contour interval for MFC is 1 kg m−2 d−1.
SCMP
Rain-generating deep convective storms occur in this region when CWV, RH, and are larger than normal, particularly in the lower–middle troposphere (24). Area mean changes in the moist thermodynamic properties of the atmosphere (Fig. 2) indicate that the SCMP acts to establish these conditions over the southern Amazon 30 d before wet season onset. To demonstrate that these regional-scale changes are consistent with the influences of individual shallow convective events, we evaluate changes in the vertical profile of RH associated with shallow convection during the transition season. Because convection in this region is influenced by aerosol loading (29), we examine these changes separately for shallow convection during clean, moderate, and heavily polluted conditions (Fig. 5).
An increase in RH in the lower troposphere (950–700 hPa, 0.53 km above sea level) is observed after shallow convection occurs under clean and moderate conditions. Moderate aerosol loading appears to slightly enhance the lower-tropospheric moistening associated with shallow convection, perhaps due to aerosol-induced reductions in precipitation efficiency that favor longer cloud lifetimes (40, 41). Shallow convective moistening is shifted upward under heavy pollution, reflecting upward displacements of cloud base and cloud top in a systematically drier atmosphere. These results, based on instantaneous measurements, establish the capacity of the SCMP to increase lower tropospheric RH during the early stages of the transition season, a key precondition for subsequent increases in deep convection. Our interpretations of aerosol effects are speculative, but highlight the potential influences of biomass burning on the SCMP and the need for further study.
Implications
The fate of the southern Amazon rainforest depends on the length of the dry season (2, 4). Here, we have shown that the length of the dry season in this region also depends on the rainforest. Rainforest ET during the late dry season helps to initiate a chain of atmospheric processes that hastens wet season onset 2–3 mo before the arrival of the ITCZ. This finding bolsters the hypothesis that deforestation could delay onset and lengthen the dry season (3). Given the importance of the rainforest-mediated SCMP and the strong sensitivity of shallow convection to land cover in this region (42), the dry-to-wet transition may be more sensitive to land use and vegetation changes than previously thought. Many models remain unable to realistically represent rainforest ET and shallow convection (43, 44), leading to misdiagnosis of the mechanisms that control wet season onset and large discrepancies in projected climate changes over the southern Amazon (45). A more detailed understanding of the water isotopic budget would provide valuable constraints for model evaluation and development.
Variations in the timing of wet season onset are often attributed to large-scale climate patterns like the El Niño–Southern Oscillation and the Atlantic Multidecadal Oscillation (46), but the mechanisms by which oceanic conditions during March–May influence wet season onset and forest fire activity in the southern Amazon during August–October are unclear (47, 48). Our results imply that reduced deep soil moisture recharge during March–May associated with El Niño or warmer conditions in the tropical North Atlantic could delay onset by suppressing rainforest ET during August–October (the early transition season). ET-initiated wet season onset mechanisms may also apply in other parts of the Amazon, but further investigation would be needed to evaluate this possibility.
Materials and Methods
All analyzed fields are area-weighted spatial averages over the southern Amazon domain, defined as the area bounded by 5°S to 15°S and 50°W to 70°W (Fig. 1). Variables are averaged into discrete 5-d periods (pentads) starting each year from 1 to 5 January. The annual cycle of each variable is composited relative to wet season onset for each individual year following Li and Fu (19). Onset dates are listed in Table S1. Onset-relative composites are constructed by averaging across years for the 81 5-d periods centered on onset over multiple wet season transitions (2007–2008 through 2013–2014 for SIF; 2005–2006 through 2010–2011 for all other variables). Composite time series are then filtered using fast Fourier transforms to remove variability at time scales shorter than 25 d (Fig. S7).
The deuterium content of water vapor is expressed as the relative ratio D in parts per thousand (‰), where
| [1] |
is the ratio of the number of HDO molecules to the number of H2O molecules and is the corresponding ratio in Vienna Standard Mean Ocean Water (). Joint distributions of specific humidity () and D are based on retrievals from the Tropospheric Emission Spectrometer (TES) on the EOS Aura satellite (49); see SI Text and Figs. S8 and S9 for additional details on these retrievals. Linear fits of D on account for residuals and uncertainties in both variables (50). Detailed descriptions of data sources, quality control criteria, uncertainty calculations, theoretical models, and potential confounding factors are provided in SI Text.
Acknowledgments
This work was supported by a Young Thousand Talents fellowship and National Natural Sciences Foundation of China Research Fund for International Young Scientists (Grant 41350110225) at Tsinghua University; along with National Science Foundation Grant AGS-0937400; NASA Aura Science Team Program Grant NNX09AD85G; the Department of Energy GOAmazon Project; and NASA Earth and Space Science Fellowship Program Grant NNX13AN95H. Part of the research described in this paper was carried out by the Jet Propulsion Laboratory, California Institute of Technology, under a contract with NASA.
Footnotes
The authors declare no conflict of interest.
This article is a PNAS Direct Submission.
This article contains supporting information online at www.pnas.org/lookup/suppl/doi:10.1073/pnas.1621516114/-/DCSupplemental.
References
- 1.Field CB, Behrenfeld MJ, Randerson JT, Falkowski P. Primary production of the biosphere: Integrating terrestrial and oceanic components. Science. 1998;281(5374):237–240. doi: 10.1126/science.281.5374.237. [DOI] [PubMed] [Google Scholar]
- 2.Staver AC, Archibald S, Levin SA. The global extent and determinants of savanna and forest as alternative biome states. Science. 2011;334(6053):230–232. doi: 10.1126/science.1210465. [DOI] [PubMed] [Google Scholar]
- 3.Fu R, et al. Increased dry-season length over southern Amazonia in recent decades and its implication for future climate projection. Proc Natl Acad Sci USA. 2013;110(45):18110–18115. doi: 10.1073/pnas.1302584110. [DOI] [PMC free article] [PubMed] [Google Scholar]
- 4.Oyama MD, Nobre CA. A new climate-vegetation equilibrium state for Tropical South America. Geophys Res Lett. 2003;30(23):2199. [Google Scholar]
- 5.Gash JHC, Nobre CA. Climatic effects of Amazonian deforestation: Some results from ABRACOS. Bull Am Meteorol Soc. 1997;78:823–830. [Google Scholar]
- 6.Berbery EH, Barros VR. The hydrologic cycle of the La Plata basin in South America. J Hydrometeor. 2002;3(6):630–645. [Google Scholar]
- 7.Marengo JA. Interannual variability of surface climate in the Amazon Basin. Int J Climatol. 1992;12:853–863. [Google Scholar]
- 8.Hutyra LR, et al. Climatic variability and vegetation vulnerability in Amazônia. Geophys Res Lett. 2005;32(24):L24712. [Google Scholar]
- 9.Guan K, et al. Photosynthetic seasonality of global tropical forests constrained by hydroclimate. Nat Geosci. 2015;8(4):284–289. [Google Scholar]
- 10.Salati E, Dall’Olio A, Matsui E, Gat JR. Recycling of water in the Amazon Basin: An isotopic study. Water Resour Res. 1979;15(5):1250–1258. [Google Scholar]
- 11.Eltahir EAB, Bras RL. Precipitation recycling in the Amazon basin. Q J R Meteorol Soc. 1994;120(518):861–880. [Google Scholar]
- 12.van der Ent RJ, Savenije HHG, Schaefli B, Steele-Dunne SC. Origin and fate of atmospheric moisture over continents. Water Resour Res. 2010;46(9):W09525. [Google Scholar]
- 13.Dirmeyer PA, Wei J, Bosilovich MG, Mocko DM. Comparing evaporative sources of terrestrial precipitation and their extremes in MERRA using relative entropy. J Hydrometeorol. 2014;15(1):102–116. [Google Scholar]
- 14.Davidson EA, et al. The Amazon basin in transition. Nature. 2012;481(7381):321–328. doi: 10.1038/nature10717. [DOI] [PubMed] [Google Scholar]
- 15.Escobar H. Drought triggers alarms in Brazil’s biggest metropolis. Science. 2015;347(6224):812. doi: 10.1126/science.347.6224.812. [DOI] [PubMed] [Google Scholar]
- 16.Fu R, Arias PA, Wang H. The connection between the North and South American monsoons. In: de Carvalho LMV, Jones C, editors. The Monsoons and Climate Change: Observations and Modeling. Springer International; Cham, Switzerland: 2016. pp. 187–206. [Google Scholar]
- 17.Lenters JD, Cook KH. Simulation and diagnosis of the regional summertime precipitation climatology of South America. J Clim. 1995;8(12):2988–3005. [Google Scholar]
- 18.Fu R, Zhu B, Dickinson RE. How do atmosphere and land surface influence seasonal changes of convection in the tropical Amazon? J Clim. 1999;12:1306–1321. [Google Scholar]
- 19.Li W, Fu R. Transition of the large-scale atmospheric and land surface conditions from the dry to the wet season over Amazonia as diagnosed by the ECMWF re-analysis. J Clim. 2004;17:2637–2651. [Google Scholar]
- 20.Siqueira JR, Rossow WB, Machado LAT, Pearl C. Structural characteristics of convective systems over South America related to cold-frontal incursions. Mon Weather Rev. 2005;133:1045–1064. [Google Scholar]
- 21.Li W, Fu R. Influence of cold air intrusions on the wet season onset over Amazonia. J Clim. 2006;19:257–275. [Google Scholar]
- 22.Garreaud RD, Wallace JM. Summertime incursions of midlatitude air into subtropical and tropical South America. Mon Weather Rev. 1998;126:2713–2733. [Google Scholar]
- 23.Mapes BE, Tulich S, Lin J, Zuidema P. The mesoscale convection life cycle: Building block or prototype for large-scale tropical waves? Dyn Atmos Ocean. 2006;42:3–29. [Google Scholar]
- 24.Schiro KA, Neelin JD, Adams DK, Lintner BR. Deep convection and column water vapor over tropical land versus tropical ocean: A comparison between the Amazon and the tropical western Pacific. J Atmos Sci. 2016;73(10):4043–4063. [Google Scholar]
- 25.Fernandes K, Fu R, Betts AK. How well does the ERA40 surface water budget compare to observations in the Amazon River basin? J Geophys Res Atmos. 2008;113(D11):D11117. [Google Scholar]
- 26.da Rocha HR, et al. Seasonality of water and heat fluxes over a tropical forest in eastern Amazonia. Ecol Appl. 2004;14:22–32. [Google Scholar]
- 27.Juárez RIN, Hodnett MG, Fu R, Goulden ML, von Randow C. Control of dry season evapotranspiration over the Amazonian forest as inferred from observations at a Southern Amazon forest site. J Clim. 2007;20(12):2827–2839. [Google Scholar]
- 28.Hasler N, Avissar R. What controls evapotranspiration in the Amazon basin? J Hydrometeorol. 2007;8(3):380–395. [Google Scholar]
- 29.Rickenbach TM, Nieto-Ferreira R, Barnhill RP, Nesbitt SW. Regional contrast of mesoscale convective system structure prior to and during monsoon onset across South America. J Clim. 2011;24(14):3753–3763. [Google Scholar]
- 30.Tegen I, et al. Contribution of different aerosol species to the global aerosol extinction optical thickness: Estimates from model results. J Geophys Res Atmos. 1997;102:23895–23915. [Google Scholar]
- 31.Colarco P, da Silva A, Chin M, Diehl T. Online simulations of global aerosol distributions in the NASA GEOS-4 model and comparisons to satellite and ground-based aerosol optical depth. J Geophys Res. 2010;115:D14207. [Google Scholar]
- 32.Joiner J, et al. Global monitoring of terrestrial chlorophyll fluorescence from moderate-spectral-resolution near-infrared satellite measurements: Methodology, simulations, and application to GOME-2. Atmos Meas Tech. 2013;6(10):2803–2823. [Google Scholar]
- 33.Galewsky J, et al. Stable isotopes in atmospheric water vapor and applications to the hydrologic cycle. Rev Geophys. 2016;54:809–865. doi: 10.1002/2015rg000512. [DOI] [PMC free article] [PubMed] [Google Scholar]
- 34.McGuffie K, Henderson-Sellers A. Stable water isotope characterization of human and natural impacts on land-atmosphere exchanges in the Amazon Basin. J Geophys Res. 2004;109(D17):D17104. [Google Scholar]
- 35.Farquhar GD, Cernusak LA, Barnes B. Heavy water fractionation during transpiration. Plant Physiol. 2007;143(1):11–18. doi: 10.1104/pp.106.093278. [DOI] [PMC free article] [PubMed] [Google Scholar]
- 36.Worden J, et al. Profiles of CH4, HDO, H2O, and N2O with improved lower tropospheric vertical resolution from Aura TES radiances. Atmos Meas Tech. 2012;5(2):397–411. [Google Scholar]
- 37.Noone D. Pairing measurements of the water vapor isotope ratio with humidity to deduce atmospheric moistening and dehydration in the tropical midtroposphere. J Clim. 2012;25(13):4476–4494. [Google Scholar]
- 38.Worden J, Noone D, Bowman K. Importance of rain evaporation and continental convection in the tropical water cycle. Nature. 2007;445(7127):528–532. doi: 10.1038/nature05508. [DOI] [PubMed] [Google Scholar]
- 39.Marengo JA, Liebmann B, Kousky VE, Filizola NP, Wainer IC. Onset and end of the rainy season in the Brazilian Amazon Basin. J Clim. 2001;14:833–852. [Google Scholar]
- 40.Albrecht BA. Aerosols, cloud microphysics, and fractional cloudiness. Science. 1989;245(4923):1227–1230. doi: 10.1126/science.245.4923.1227. [DOI] [PubMed] [Google Scholar]
- 41.Ackerman AS, Kirkpatrick MP, Stevens DE, Toon OB. The impact of humidity above stratiform clouds on indirect aerosol climate forcing. Nature. 2004;432(7020):1014–1017. doi: 10.1038/nature03174. [DOI] [PubMed] [Google Scholar]
- 42.Heiblum RH, Koren I, Feingold G. On the link between Amazonian forest properties and shallow cumulus cloud fields. Atmos Chem Phys. 2014;14(12):6063–6074. [Google Scholar]
- 43.Nam C, Bony S, Dufresne J-L, Chepfer H. The ‘too few, too bright’ tropical low-cloud problem in CMIP5 models. Geophys Res Lett. 2012;39(21):L21801. [Google Scholar]
- 44.Wu J, et al. Leaf development and demography explain photosynthetic seasonality in Amazon evergreen forests. Science. 2016;351(6276):972–976. doi: 10.1126/science.aad5068. [DOI] [PubMed] [Google Scholar]
- 45.Yin L, Fu R, Shevliakova E, Dickinson RE. How well can CMIP5 simulate precipitation and its controlling processes over tropical South America? Clim Dyn. 2013;41(11-12):3127–3143. [Google Scholar]
- 46.Liebmann B, Marengo JA. Interannual variability of the rainy season and rainfall in the Brazilian Amazon basin. J Clim. 2001;14:4308–4318. [Google Scholar]
- 47.Chen Y, Velicogna I, Famiglietti JS, Randerson JT. Satellite observations of terrestrial water storage provide early warning information about drought and fire season severity in the Amazon. J Geophys Res Biogeosci. 2013;118(2):495–504. [Google Scholar]
- 48.Yin L, et al. What controls the interannual variation of the wet season onsets over the Amazon? J Geophys ResAtmos. 2014;119(5):2314–2328. [Google Scholar]
- 49.Worden J, et al. Tropospheric Emission Spectrometer observations of the tropospheric HDO/H2O ratio: Estimation approach and characterization. J Geophys Res. 2006;111(D16):D16309. [Google Scholar]
- 50.York D, Evensen NM, Martínez ML, Delgado JDB. Unified equations for the slope, intercept, and standard errors of the best straight line. Am J Phys. 2004;72(3):367–375. [Google Scholar]
- 51.Huffman GJ, et al. The TRMM Multisatellite Precipitation Analysis (TMPA): Quasi-global, multiyear, combined-sensor precipitation estimates at fine scales. J Hydrometeorol. 2007;8(1):38–55. [Google Scholar]
- 52.Dee DP, et al. The ERA-Interim reanalysis: Configuration and performance of the data assimilation system. Quart J R Meteorol Soc. 2011;137:553–597. [Google Scholar]
- 53.Wielicki BA, et al. Clouds and the Earth’s radiant energy system (CERES): An Earth observing system experiment. Bull Am Meteorol Soc. 1996;77(5):853–868. [Google Scholar]
- 54.Kato S, et al. Surface irradiances consistent with CERES-derived top-of-atmosphere shortwave and longwave irradiances. J Clim. 2013;26(9):2719–2740. [Google Scholar]
- 55.Minnis P, et al. CERES Edition-2 cloud property retrievals using TRMM VIRS and Terra and Aqua MODIS data—Part I: Algorithms. IEEE Trans Geosci Remote Sens. 2011;49(11):4374–4400. [Google Scholar]
- 56.Doelling DR, et al. Geostationary enhanced temporal interpolation for CERES flux products. J Atmos Ocean Tech. 2013;30(6):1072–1090. [Google Scholar]
- 57.Bloom S, da Silva A, Dee D. 2005. Documentation and Validation of the Goddard Earth Observing System (GEOS) Data Assimilation System-Version 4 (National Aeronautics and Space Administration, Greenbelt, MD), Tech Rep. NASA/TM-2005-104606/VOL26/VER4.
- 58.Rienecker MM, et al. 2008. The GEOS-5 Data Assimilation System - Documentation of Versions 5.0.1, 5.1.0, and 5.2.0, (National Aeronautics and Space Administration, Greenbelt, MD), Tech Rep. NASA/TM-2008-104606-VOL-27.
- 59.Huete A, et al. Overview of the radiometric and biophysical performance of the MODIS vegetation indices. Remote Sens Environ. 2002;83(1):195–213. [Google Scholar]
- 60.van der Werf GR, et al. Global fire emissions and the contribution of deforestation, savanna, forest, agricultural, and peat fires (1997–2009) Atmos Chem Phys. 2010;10(23):11707–11735. [Google Scholar]
- 61.Mu M, et al. Daily and 3-hourly variability in global fire emissions and consequences for atmospheric model predictions of carbon monoxide. J Geophys Res Atmos. 2011;116(D24):D24303. [Google Scholar]
- 62.Olsen ET, et al. 2013. AIRS/AMSU/HSB Version 6 Data Release User Guide, (Jet Propulsion Laboratory, Pasadena, California), Tech Rep.
- 63.Tian B, et al. 2013. AIRS/amsu/hsb version 6 level 3 product user Guide (Jet Propulsion Laboratory, Pasadena, CA), Tech Rep.
- 64.Williams E, Renno N. An analysis of the conditional instability of the tropical atmosphere. Mon Weather Rev. 1993;121:21–36. [Google Scholar]
- 65.York D. Least-squares fitting of a straight line. Can J Phys. 1966;44:1079–1086. [Google Scholar]
- 66.York D. Least squares fitting of a straight line with correlated errors. Earth Planet Sci Lett. 1969;5:320–324. [Google Scholar]
- 67.Wehr R, Saleska SR. The long-solved problem of the best-fit straight line: Application to isotopic mixing lines. Biogeosciences. 2017;14(1):17–29. [Google Scholar]
- 68.Field RD, Jones DBA, Brown DP. Effects of postcondensation exchange on the isotopic composition of water in the atmosphere. J Geophys Res Atmos. 2010;115(D24):D24305. [Google Scholar]
- 69.Dansgaard W. Stable isotopes in precipitation. Tellus. 1964;16(4):436–468. [Google Scholar]
- 70.Brooks RJ, Barnard HR, Coulombe R, McDonnell JJ. Ecohydrologic separation of water between trees and streams in a Mediterranean climate. Nat Geosci. 2009;3(2):100–104. [Google Scholar]
- 71.Jouzel J. 1986. Isotopes in cloud physics: Multistep and multistage processes. Handbook of Environmental Geochemistry The Terrestrial Environment B, eds Fritz P, Frontes JC (Elsevier, New York), Vol 2, pp 61–112.
- 72.Majoube M. Fractionnement en oxygene-18 et en deuterium entre l’eau et sa vapeur. J Chim Phys. 1971;68:1423–1436. [Google Scholar]


