Significance
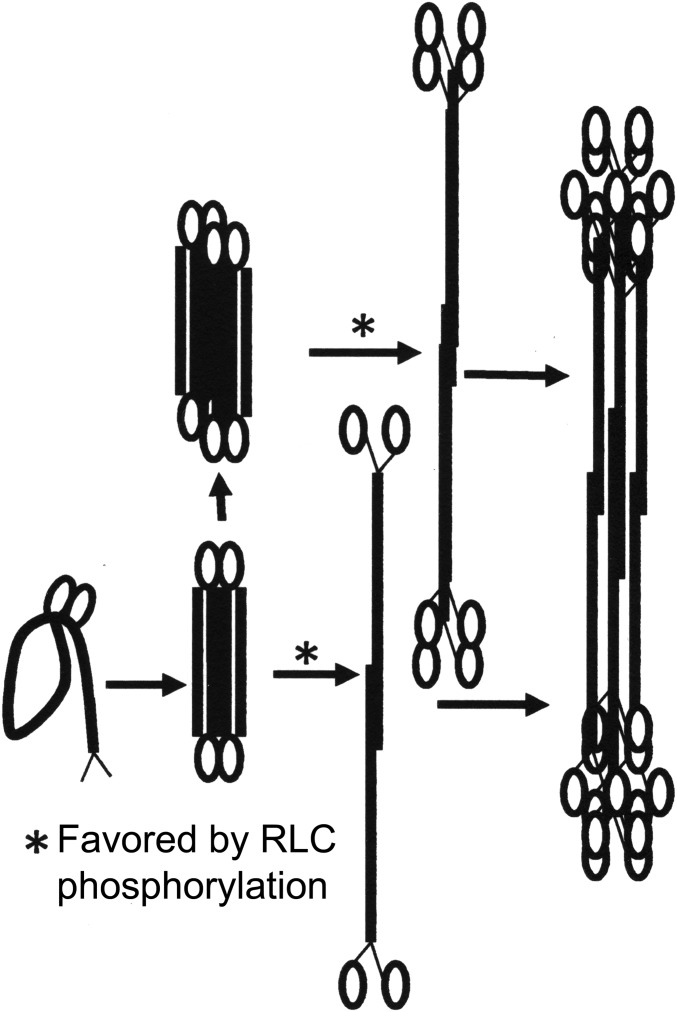
Nonmuscle myosin II (NM2) filaments have essential roles in many cellular processes that require the dynamic relocation of filamentous myosin. We find that addition of ATP to polymerized regulatory light chain (RLC)-unphosphorylated NM2s in vitro results in the formation of dimers, tetramers, hexamers, and monomers, which is reversed by phosphorylation of the RLC. Our data suggest that assembly of NM2 filaments proceeds from folded monomers to folded antiparallel dimers, tetramers, and hexamers that unfold and polymerize into antiparallel filaments. This could explain the dynamic relocalization of NM2 filaments in vivo by dephosphorylation of RLC-phosphorylated filaments, disassembly of the dephosphorylated filaments to monomers, dimers, and small oligomers, diffusion of these species, and their reassembly into filaments at the new location following rephosphorylation of the RLC.
Keywords: nonmuscle myosin II, polymerization, ATP, light-chain phosphorylation
Abstract
Addition of 1 mM ATP substantially reduces the light scattering of solutions of polymerized unphosphorylated nonmuscle myosin IIs (NM2s), and this is reversed by phosphorylation of the regulatory light chain (RLC). It has been proposed that these changes result from substantial depolymerization of unphosphorylated NM2 filaments to monomers upon addition of ATP, and filament repolymerization upon RLC-phosphorylation. We now show that the differences in myosin monomer concentration of RLC-unphosphorylated and -phosphorylated recombinant mammalian NM2A, NM2B, and NM2C polymerized in the presence of ATP are much too small to explain their substantial differences in light scattering. Rather, we find that the decrease in light scattering upon addition of ATP to polymerized unphosphorylated NM2s correlates with the formation of dimers, tetramers, and hexamers, in addition to monomers, an increase in length, and decrease in width of the bare zones of RLC-unphosphorylated filaments. Both effects of ATP addition are reversed by phosphorylation of the RLC. Our data also suggest that, contrary to previous models, assembly of RLC-phosphorylated NM2s at physiological ionic strength proceeds from folded monomers to folded antiparallel dimers, tetramers, and hexamers that unfold and polymerize into antiparallel filaments. This model could explain the dynamic relocalization of NM2 filaments in vivo by dephosphorylation of RLC-phosphorylated filaments, disassembly of the dephosphorylated filaments to folded monomers, dimers, and small oligomers, followed by diffusion of these species, and reassembly of filaments at the new location following rephosphorylation of the RLC.
Class II myosins, the first of 37 known myosin classes (1, 2) to be discovered and originally thought to be specific for muscle, are now known to occur widely in nonmuscle cells in numerous species. Human nonmuscle cells express three different myosin 2 paralogs: nonmuscle myosins (NM) NM2A, NM2B, and NM2C. Like all class II myosins (3, 4), NM2 monomers are hexapeptides of two identical heavy chains (HC), two essential light chains (ELC), and two regulatory light chains (RLC). The HCs of NM2A, NM2B, and NM2C are encoded by different genes, have 60–80% sequence similarity, and isoforms of each are derived from alternative splicing (4).
Each HC has an N-terminal globular motor domain with an ATPase site and an actin-binding site, followed by a lever arm that binds one ELC and one RLC, and a long tail that homodimerizes to form a coiled-coil α-helix. The HC ends with a short C-terminal nonhelical tailpiece (5). Like most class II myosins, NM2 monomers assemble into bipolar filaments by antiparallel association of their elongated coiled-coil helical tails. The filaments of NM2s are appreciably smaller than filaments of muscle myosins, with lengths of about 300 nm, consisting of ∼30 monomers for filaments of NM2A and NM2B and ∼14 monomers for filaments of NM2C (5).
As described originally for smooth muscle myosin based on light-scattering data (6–8), filaments of unphosphorylated NM2s in physiological buffer are thought to depolymerize extensively to monomers upon addition of ATP, and repolymerize upon kinase-catalyzed phosphorylation of the RLC (5, 9, 10) at Ser-19 or Ser-19 and Thr-18 (11). A plausible explanation (12) of this phenomenon has been that NM2 filaments are in equilibrium with monomers, a mixed population of compact folded structures (10 S monomers, by analytical ultracentrifugation) that are unable to form filaments, and of extended structures (6 S monomers) that can polymerize. Addition of ATP to non-RLC phosphorylated myosin favors the folded monomer, in which the motor domains of the two HCs associate (13, 14), and the helical tail folds back and interacts with the RLC (15). Phosphorylation of the RLC inhibits both the interaction of the two motor domains (16, 17), and the interaction between the motor domain and tail, thereby shifting the monomer equilibrium from folded to unfolded structures, and enhancing filament polymerization in the presence of ATP (12).
This explanation requires that the concentrations of monomers in equilibrium with filaments of RLC-unphosphorylated NM2s be substantially higher in the presence of ATP than in the absence of ATP, but similar for RLC-phosphorylated NM2s in the presence and absence of ATP. To the best of our knowledge, the only report of the effect of ATP on the concentration of monomers in equilibrium with NM2 filaments used NM2s purified from bovine thymus and chicken intestinal brush border (18).
Here we report the effects of ATP on the assembly of RLC-unphosphorylated and RLC-phosphorylated recombinant mammalian NM2A, NM2B, and NM2C assayed by light scattering and sedimentation. We find that the minimum concentrations required for assembly of RLC-unphosphorylated and -phosphorylated NM2A, NM2B, and NM2C in the absence of ATP are only ∼10% of the previously reported values for thymus and brush border myosins. Addition of 1 mM ATP to the polymerization buffer increases the myosin concentration required for polymerization of both RLC-phosphorylated and -unphosphorylated recombinant NM2s, and the difference between them is much too small to explain the substantially lower light scattering of polymerized unphosphorylated NM2s in ATP.
However, we find that addition of ATP to polymerized RLC-unphosphorylated NM2s, but not to polymerized RLC-phosphorylated NM2s, results in the formation of substantial amounts of folded dimers, tetramers, and hexamers, which would explain the difference in light scattering of polymerized unphosphorylated and RLC-phosphorylated NM2s in the presence of ATP. In addition, we find that NM2 monomers, in buffer of physiological ionic strength, are in the folded conformation in both the presence and absence of ATP regardless of the status of RLC phosphorylation. These data suggest that filament assembly proceeds from folded monomers to folded antiparallel dimers, tetramers, and hexamers that unfold as they polymerize into filaments. The relocalization of NM2s in vivo could be explained by dephosphorylation of RLC-phosphorylated filaments, disassembly of RLC-dephosphorylated filaments to folded monomers, dimers, and small oligomers that relocate and reassemble in their new location after RLC-phosphorylation.
Results
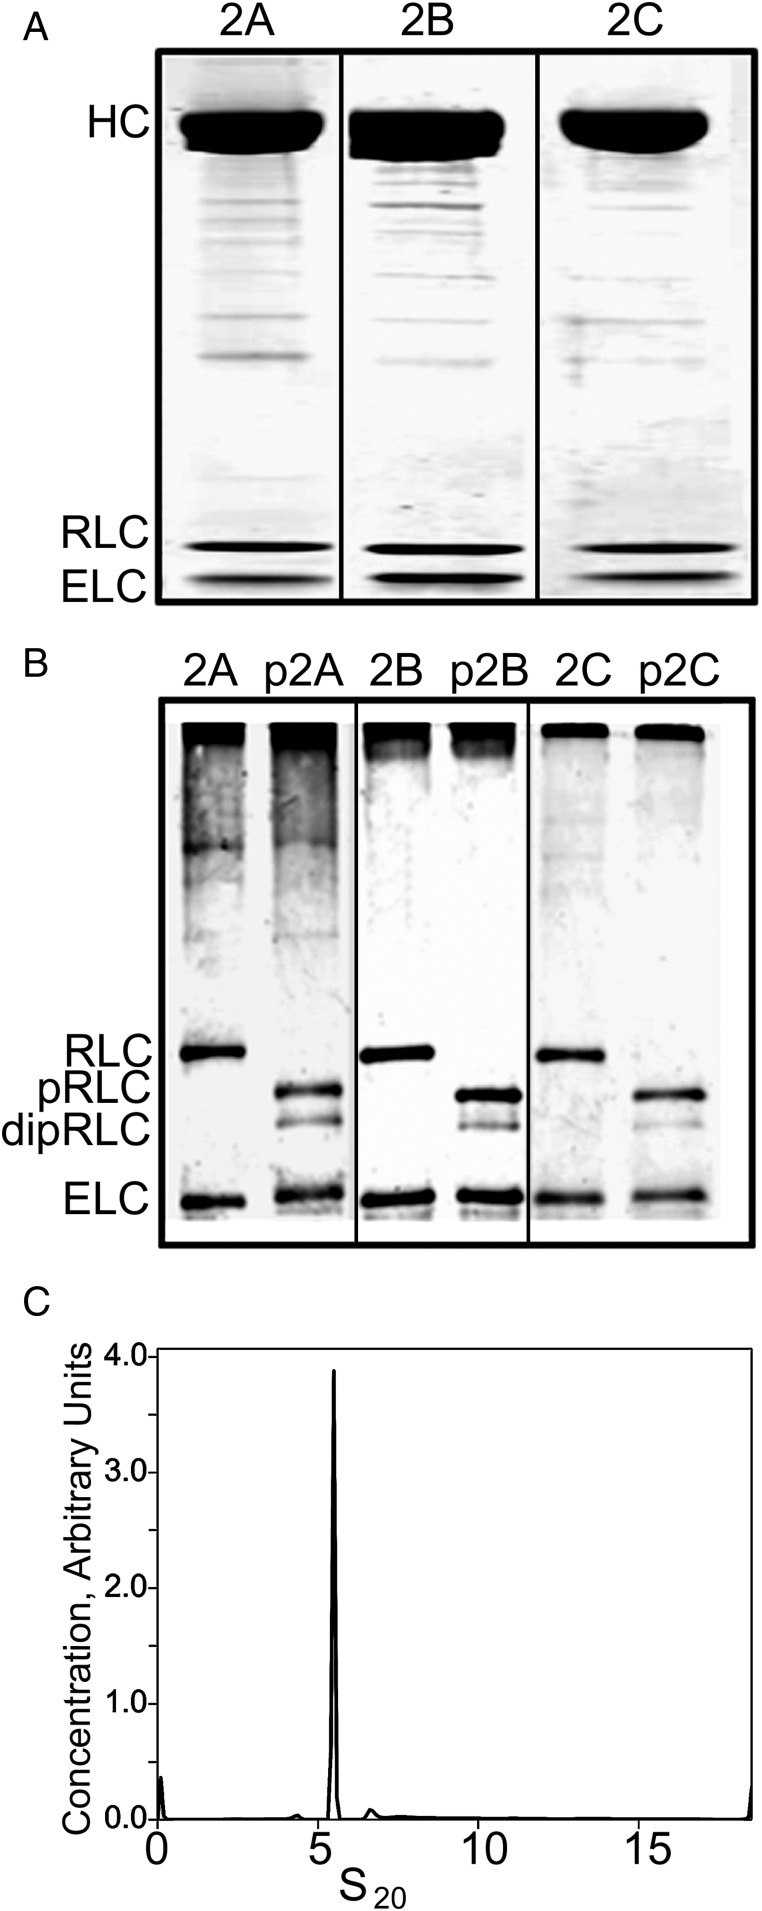
The purity and composition of typical preparations of recombinant NM2A, NM2B, and NM2C before and after phosphorylation of their RLCs were documented by SDS/PAGE (Fig. 1). The RLCs of the three expressed myosins were unphosphorylated (Fig. 1A). After incubation with myosin light-chain kinase (MLCK), Ca2+, and calmodulin, ≈85% of the RLCs became singly phosphorylated and 15% were doubly phosphorylated (Fig. 1B). Monomeric unphosphorylated NM2A in 600 mM NaCl, which was used as a control in some of the polymerization assays, was in an unfolded (5.4 S) conformation (Fig. 1C).
Fig. 1.
Electrophoretic analysis of purified recombinant NM2A, NM2B, and NM2C before and after RLC-phosphorylation. (A) SDS/PAGE of purified NM2A (2A), NM2B (2B), and NM2C (2C). (B) Urea-glycerol gel electrophoresis of RLC-phosphorylated NM2A (p2A), NM2B (p2B), and NM2C (p2C). Positions of the HC, RLC, ELC, monophosphorylated RLC (pRLC), and diphosphorylated RLC (dipRLC) are indicated. (C) Analytical ultracentrifugation of monomeric NM2A (2 µM) in 600 mM NaCl.
Assembly of NM2s Monitored by Light Scattering.
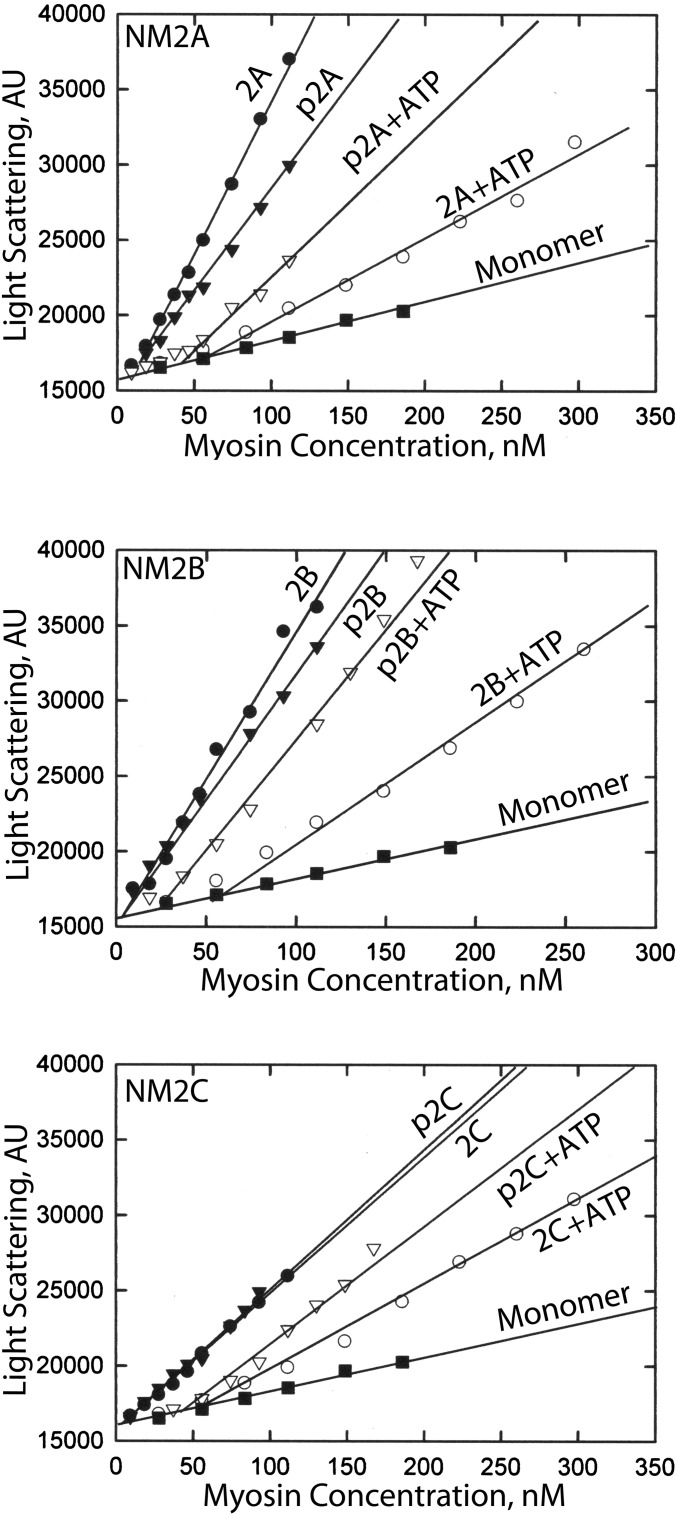
We monitored myosin assembly as a function of myosin concentration, in the absence and presence of 1 mM ATP, by the increase in light scattering compared with the light scattering of equal concentrations of monomeric myosin (Fig. 2). For each of the three NM2s, the light-scattering intensity increased linearly with the total myosin concentration for both unphosphorylated and RLC-phosphorylated myosin in both the presence and absence of ATP. The intercepts of the plots for myosins in assembly buffer with the plot for monomeric myosin identifies the minimal myosin concentration required to initiate association of monomers. This concentration was similar for unphosphorylated (3–10 nM) and RLC-phosphorylated (3–15 nM) myosins in the absence of ATP (Fig. 2 and Table 1). Addition of 1 mM ATP to the buffer increased the minimal concentration of both unphosphorylated (51–78 nM) and RLC-phosphorylated (33–46 nM) myosins required to initiate monomer association (Fig. 2 and Table 1). Notably, however, addition of ATP to the buffer substantially reduced the slopes of the plots of light scattering vs. myosin concentration for the three RLC-unphosphorylated myosins (Fig. 2). ATP had much less effect on the slopes of the plots for RLC-phosphorylated NM2s (Fig. 2).
Fig. 2.
The minimal concentrations required for assembly of unphosphorylated and RLC-phosphorylated NM2A, NM2B, and NM2C with and without 1 mM ATP determined by light scattering. Myosins were incubated overnight on ice in 150 mM NaCl, 10 mM Mops (pH 7.0), 2 mM MgCl2, 0.1 mM EGTA, and 1 mM DTT with or without 1 mM ATP. Only 1.6%, 0.8%, and 2.3% of the ATP was hydrolyzed by NM2A, NM2B, and NM2C, respectively. Myosin monomer was prepared by centrifugation of myosin in buffer containing 600 mM NaCl at 300,000 × g for 15 min. The minimal myosin concentrations required for assembly are the intercepts of the light-scattering plots of the assembled myosins with the light-scattering plot of unphosphorylated monomer. Light-scattering data were plotted by SigmaPlot. Plots 2A, 2B, and 2C are unphosphorylated NM2A, NM2B, and NM2C, respectively; plots p2A, p2B, and p2C are RLC-phosphorylated NM2A, NM2B, and NM2C, respectively. Data are the averages of two assays.
Table 1.
Minimal concentrations of unphosphorylated and RLC-phosphorylated NM2s required to initiate assembly with and without 1 mM ATP
| Myosin | Light scattering, nM | Sedimentation, nM |
| NM2A | 10 | 9 |
| NM2A + ATP | 78 | 64 |
| pNM2A | 15 | |
| pNM2A + ATP | 33 | |
| NM2B | 7 | 7 |
| NM2B + ATP | 51 | 30 |
| pNM2B | 3 | |
| pNM2B + ATP | 33 | |
| NM2C | 3 | 3 |
| NM2C + ATP | 69 | 43 |
| pNM2C | 6 | |
| pNM2C + ATP | 46 |
Addition of ATP to Polymerized Unphosphorylated NM2B.
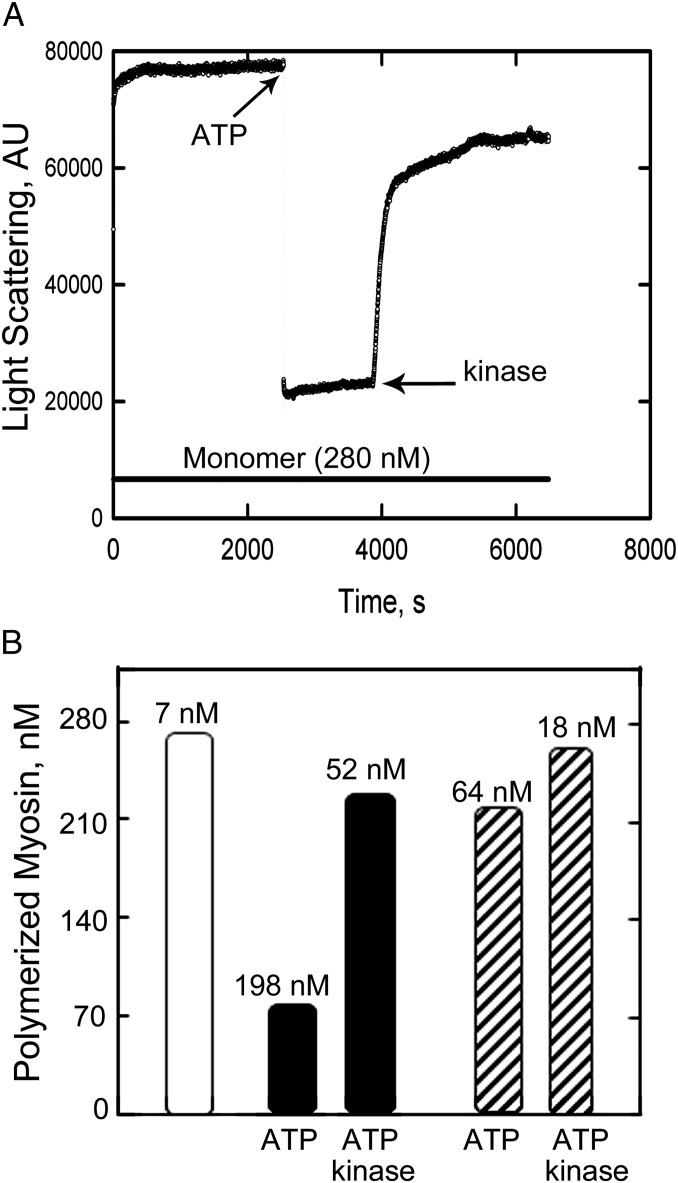
As previously reported by Scholey et al. (9) for purified thymus myosin, and by Billington et al. (5) for recombinant NM2B, addition of 1 mM ATP to RLC-unphosphorylated NM2B polymerized without ATP caused substantial decrease in light scattering that was largely reversed upon phosphorylation of the RLC by addition of MLCK, calmodulin, and Ca2+ (Fig. 3A). If the extensive decreases in light scattering upon addition of 1 mM ATP to 280 nM unphosphorylated NM2B were solely because of depolymerization of myosin filaments to monomers, the calculated concentrations of unpolymerized NM2B would increase from 7 nM to 198 nM (Fig. 3B), substantially higher than the minimal monomer concentration of 51 nM required for assembly determined by light scattering (Fig. 2 and Table 1).
Fig. 3.
The effect of ATP addition and RLC-phosphorylation on the light scattering of assembled NM2B. (A) Assembly at 20 °C of 280 nM NM2B in 125 µL of 150 mM NaCl, 10 mM Mops (pH 7.0), 2 mM MgCl2, and 1 mM DTT was initiated at time 0. At 2,500 s (first arrow), 1.3 µL of 100 mM ATP (final concentration 1 mM) was added, followed at 4,000 s (second arrow) by addition of 3.5 µL of a solution containing CaCl2, calmodulin, and MLCK at final concentrations of 0.2, 50, and 10 nM, respectively. Zero light scattering is the light scattering of buffer alone. (B) Concentration of assembled myosin calculated from the light-scattering data in A. The first column is the concentration of assembled NM2B in the absence of ATP calculated by subtracting the monomer concentrations of nonpolymerized NM2B (7 nM) (Table 2) from the total myosin concentration (280 nM). The next two columns are the filament concentrations after addition of ATP (column 2) and kinase (column 3) calculated from the light scattering relative to column 1. The fourth and fifth columns are the filament concentrations after addition of kinase calculated from the light scattering relative to column 1 after correction for the differences in slopes in Fig. 2 of light scattering as a function of myosin concentration for NM2B in ATP (0.38) and pNM2B in ATP (0.87) relative to the slope for NM2B alone. The number shown at the top of each column is the monomer concentration calculated by subtracting the calculated filament concentration from the total myosin concentration, 280 nM.
This apparent inconsistency can be explained by the fact the slope of the plot of light scattering vs. myosin concentration in 1 mM ATP for NM2B is only 0.38 of the slope in the absence of ATP (Fig. 2). When corrected for these differences in light scattering per nanomole of polymerized myosin, the calculated concentration of polymerized NM2B after addition of ATP increases to 216 nM, and the calculated concentration of unpolymerized NM2B decreases to 52 nM (Fig. 3B), the value determined by light scattering of NM2B in 1 mM ATP (Fig. 3).
There are several possible explanations for the decrease in the slopes of light scattering of RLC-unphosphorylated myosins as a function of total myosin concentration upon addition of ATP: (i) an increase in the equilibrium concentration of monomeric myosin with increasing concentrations of total myosin (19); (ii) a difference in size of nonmonomeric myosins that reduces the light scattering of equal concentrations of the nonmonomeric myosin–light scattering intensity is proportional to the molecular size and weight concentration of the protein (20); and (iii) possibly a different radial distribution of myosin heads in otherwise unaltered bipolar filaments, which would be difficult to quantify.
Assembly of RLC-Unphosphorylated NM2s Determined by Sedimentation.
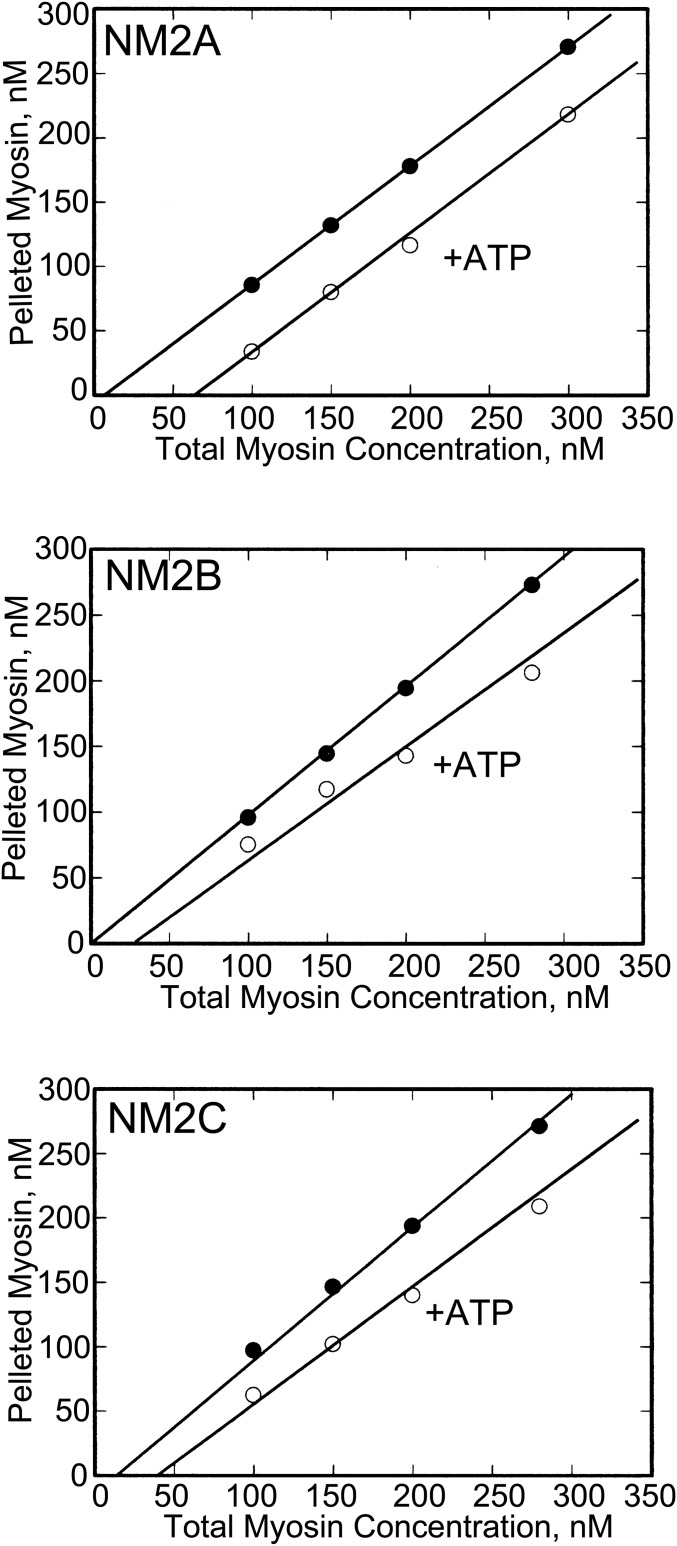
To determine the concentrations of nonmonomeric myosin at different total myosin concentrations with or without 1 mM ATP, the nonmonomeric and monomeric NM2s were separated by centrifugation at 400,000 × g for 20 min. As shown in Fig. 4, the slopes of the plots of pelleted myosins as a function of total myosin concentration plus and minus ATP are much more similar to each other (almost parallel) in Fig. 4 than the light scattering slopes for RLC-unphosphorylated NM2s in Fig. 2. The decreases in slopes in the presence of ATP in Fig. 4 are much too small to explain the large ATP-induced decreases in the slopes of light scattering as a function of myosin concentration in Fig. 2.
Fig. 4.
The concentrations of assembled RLC-unphosphorylated NM2s in the presence and absence of 1 mM ATP as a function of total myosin concentration determined by centrifugation. Myosins were incubated overnight on ice in 150 mM NaCl, 10 mM Mops (pH 7.0), 2 mM MgCl2, 0.1 mM EGTA, and 1 mM DTT with or without 1 mM ATP, and centrifuged for 20 min at 400,000 × g to separate assembled (pellet) and monomeric (supernatant) myosins. The concentration of assembled myosin was determined by quantitative analysis of the pellet by Coomassie blue-stained SDS/PAGE gels. The minimal concentrations required for myosin assembly are the intercepts of the plots with the abscissas.
Moreover, the concentrations of RLC-unphosphorylated NM2A, NM2B, and NM2C required to initiate monomer association determined by sedimentation, in both the presence and absence of ATP, are very similar to the values determined by light scattering (Table 1). Thus, the difference in light scattering of RLC-unphosphorylated NM2s polymerized in the presence and absence of ATP (Fig. 2) is mostly a result of differences in light scattering of equal concentrations of assembled myosin in the presence and absence of ATP. The difference would be the size of the assembled myosin structures with there being mostly small oligomers in the presence of ATP.
Analytical Ultracentrifugation Analysis of RLC-Unphosphorylated NM2B.
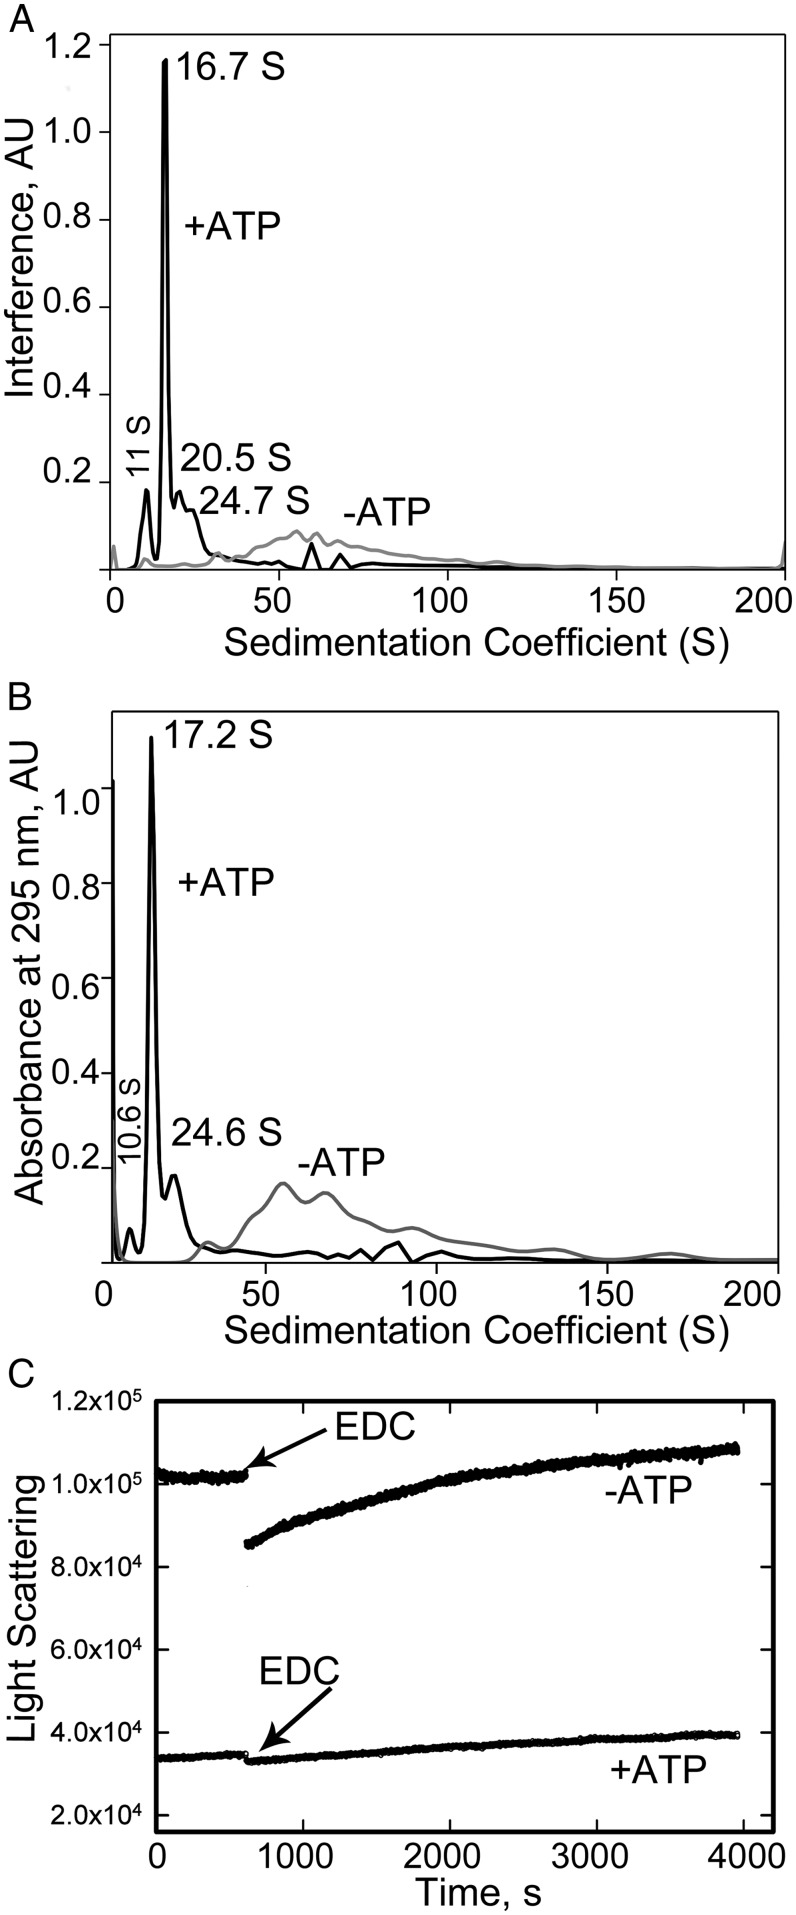
NM2B (260 nM) was incubated overnight on ice in 10 mM Mops (pH 7.0), 150 mM NaCl, 2 mM MgCl2, and 1 mM ATP, or in 10 mM Mops, 185 mM NaCl, 2 mM MgCl2, and no ATP. The higher concentration of NaCl (185 nM rather than 150 nM) in the absence of ATP was necessary to prevent aggregation of the myosin filaments polymerized in the absence of ATP, and did not significantly affect the concentration of nonfilamentous myosin. After incubation, the myosin was cross-linked, by incubation with 1-ethyl-3-(3-dimethylaminopropyl)carbodiimide hydrochloride (EDC) for 30 min, to prevent dissociation of assembled myosins during analytical centrifugation. The oligomeric state of the myosin was not affected by cross-linking, as shown by the minimal change in light scattering after prolonged incubation with EDC (Fig. 5C).
Fig. 5.
Analytical ultracentrifugation of RLC-unphosphorylated NM2B after assembly overnight on ice in the presence and absence of 1 mM ATP. Samples were cross-linked with 1 mM EDC to inhibit disassembly, and centrifuged in a Beckman Optima XL-I analytical ultracentrifuge at 20 °C. The sample with ATP was centrifuged for 1 h at 20,000 rpm (29,000 × g) followed by centrifugation for 1 h at 50,000 rpm (∼182,000 × g); the sample wthout ATP was centrifuged at 15,000 rpm (∼16,000 × g) for 2 h. Peaks were detected by both interference (A) and absorbance at 295 nm, to minimize the contribution from ATP (B), and plotted vs. sedimentation coefficient. As shown by light scattering (C), cross-linking had minimal, if any, effect on the polymerization status of the myosin.
Centrifugation was monitored by both interference (Fig. 5A) and absorbance at 295 nm (Fig. 5B). By interference analysis, the sample containing 1 mM ATP showed a minor peak at 11 S (10% of sample), a major peak at 16.7 S (46% of sample), and a moderate peak at 20.5–24.7 S (22% of sample); 22% of the sample was larger than 30 S. The latter result agrees with the 20% of sample that was pelleted after centrifugation at 20,000 rpm (29,000 × g) for 1 h. The corresponding peaks measured by absorbance accounted for 6%, 42%, 22%, and 30% of the total sample. By analogy to smooth muscle myosin (7, 21), the 11 S peak would be folded monomers, the 16.7 S peak a mixture of dimers and tetramers, and the ∼20.5–24.7 S peak larger oligomers, but smaller than filaments. Thus, 70–80% of the myosin was nonfilamentous in buffer containing 1 mM ATP, of which 85–90% was dimers, tetramers, and small oligomers.
In marked contrast, the sample incubated without ATP showed no evidence, as measured by absorbance at 295 nm (Fig. 5B), for dimers, tetramers, or larger oligomers, but just a broad range of filaments between 30 S and 150 S (89% of sample), and 11% of sample with S values greater than 150 S. By interference optics (Fig. 5A), the sample incubated without ATP showed a small peak at 11 S, and a broad peak ranging from ∼30 S to ∼150 S. Neither sample showed a peak at 6 S, which would be indicative of extended monomers. Thus, the analytical ultracentrifuge data indicate that the most likely cause of the difference in light scattering of RLC-unphosphorylated NM2s assembled in the presence and absence of ATP was the high percentage of small oligomers formed in the presence of ATP.
Electron Microscopy.
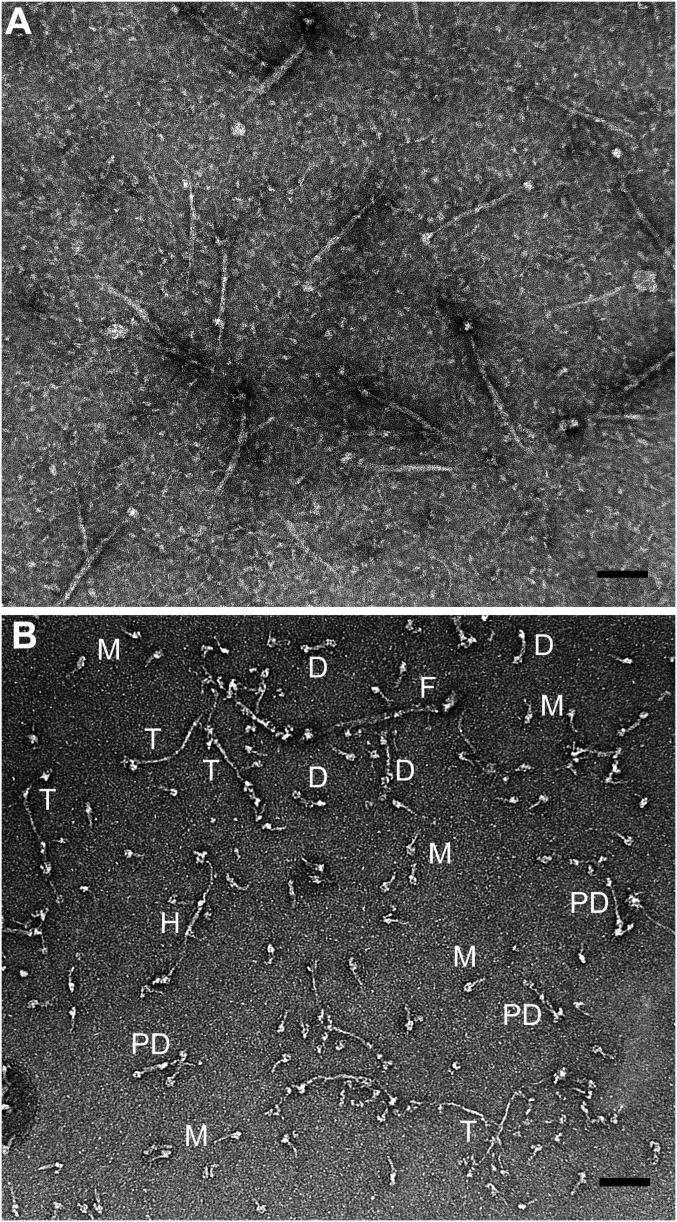
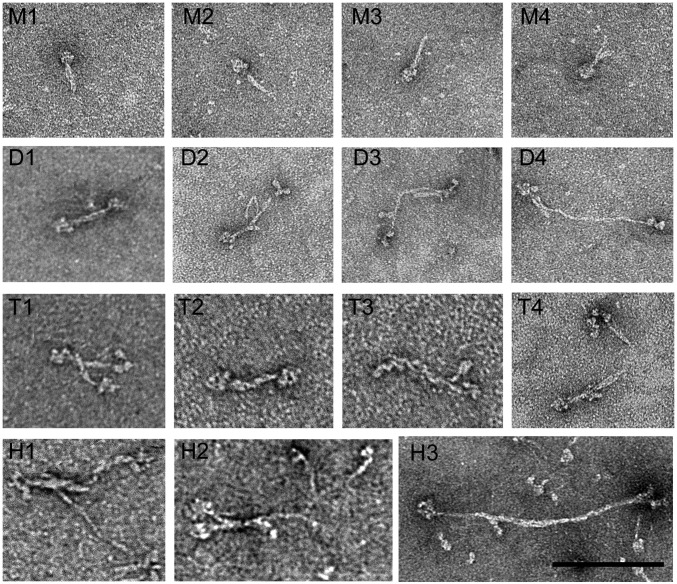
In agreement with the quantitative analytical ultracentrifugation data, negative-staining electron microscopy of RLC-unphosphorylated NM2B polymerized in 1 mM ATP (Fig. 6), and then cross-linked, showed, in addition to a relatively small number of filaments, multiple images of folded monomers (but no extended monomers), and folded and partially extended bipolar dimers, tetramers, and hexamers (Fig. 7).
Fig. 6.
Negative-staining electron microscopy of RLC-unphosphorylated NM2B assembled in the presence of ATP. RLC unphosphorylated NM2B was cleared by centrifugation, assembled overnight on ice in 150 mM NaCl, 10 mM Mops, pH 7.0, 2 mM MgCl2, 0.1 mM EGTA, 1 mM DTT and 1 mM ATP, and cross-linked with glutaraldehyde. (A) A 4-µL sample of 250 nM myosin was applied to a carbon-coated grid, then stained with 1% uranyl acetate and imaged on a JEOL 200EX II electron microscope. (B) The same sample of myosin diluted to 30 nM before application to the carbon-coated grid. Filaments are seen in both samples, and folded monomers (M), folded (D) and partially extended (PD) dimers, partially extended tetramers (T), and a partially extended hexamer (H) are observed at low myosin concentration (B). (Scale bars, 100 nm.)
Fig. 7.
Negative-staining electron microscopy at higher resolution of representative small oligomers of RLC-unphosphorylated NM2B assembled in the presence of ATP. Unphosphorylated NM2B, 250 nM, was assembled overnight on ice in 150 mM NaCl, 10 mM Mops, pH 7.0, 2 mM MgCl2, 0.1 mM EGTA, 1 mM DTT, and 1 mM ATP. Samples were then covalently cross-linked with EDC to inhibit disassembly, diluted to 30 nM, and 4 µL were applied to a carbon-coated grid, stained with 1% uranyl acetate, and imaged on a JEOL 200EX II electron microscope. The first row shows four folded monomers (M1–M4); the second row shows one folded dimer (D1), two partially extended dimers (D2 and D3), and a nearly fully extended dimer (D4); the third row shows two associating folded dimers (T1), one folded tetramer (T2), and two partially extended tetramers (T3 and T4); the fourth row shows two partially extended hexamers (H1 and H2), and one almost fully extended hexamer (H3). (Scale bar, 100 nm.)
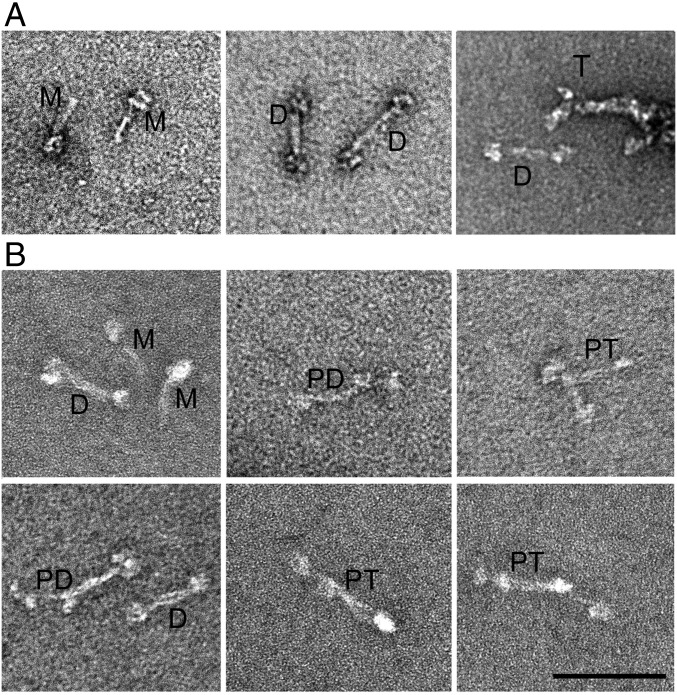
Electron microscopy of RLC-phosphorylated NM2B polymerized in the absence (Fig. 8A) and presence (Fig. 8B) of 1 mM ATP, and then cross-linked, showed, in addition to multiple bipolar filaments (Fig. 9 and Table 2), very small amounts of folded monomers, and folded and partially extended bipolar dimers, tetramers, and hexamers. Notably, extended monomers were not detected in samples of RLC-phosphorylated NM2B polymerized in either the absence or presence of ATP.
Fig. 8.
Negative-staining electron microscopy of representative small oligomers of RLC-phosphorylated NM2B assembled with and without ATP. RLC-phosphorylated NM2B, 250 nM, was assembled overnight on ice in 150 mM NaCl, 10 mM Mops, pH 7.0, 2 mM MgCl2, 0.1 mM EGTA, 1 mM DTT, with and without 1 mM ATP. Samples were then covalently cross-linked with glutaraldehyde to inhibit disassembly, diluted to 20 nM, and 4 µL were applied to a carbon-coated grid, stained with 1% uranyl acetate, and imaged on a JEOL 200EX II electron microscope. (A) Samples polymerized without ATP. (B) Samples polymerized with ATP. Folded monomers (M) and folded dimers (T) are seen in both samples. Partially extended dimers (PD) and partially extended tetramers (PT) are seen only in the presence of ATP. (Scale bar, 100 nm.)
Fig. 9.
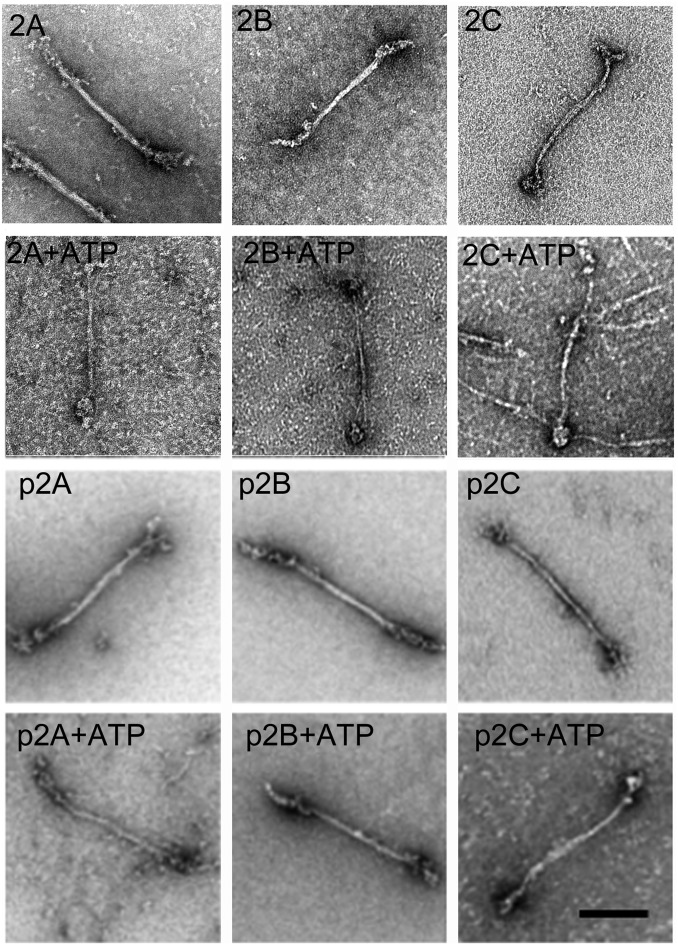
Negative-staining electron microscopy of single representative filaments of RLC-unphosphorylated and -phosphorylated NM2s assembled in the presence and absence of 1 mM ATP. Experimental conditions were the same as in Fig. 7. Samples 2A, 2B, and 2C, and p2A, p2B, and p2C are unphosphorylated and phosphorylated NM2A, NM2B, and NM2C, respectively. Filament widths and lengths (Table 2) were determined with MetaMorph software. (Scale bar, 100 nm.)
Table 2.
Dimensions of filaments of unphosphorylated and RLC-phosphorylated NM2s polymerized with and without 1 mM ATP
| Filament length (nm) | Bare zone length (nm) | Bare zone width (nm) | |
| Myosin | |||
| NM2A | 295.8 ± 33.1 (n = 16) (301 ± 24)* | 167.9 ± 29.7 (n = 30) (167 ± 19)* | 11.4 ± 1.5 (n = 46) (11.2 ± 2.4)* |
| NM2A + ATP | 284.5 ± 34.0 (n = 22) | 231.1 ± 18.9 (n = 20) | 8.9 ± 1.8 (n = 50) |
| pNM2A | 277.5 ± 23.8 (n = 29) | 149.4 ± 18.8 (n = 28) | 10.6 ± 1.3 (n = 90) |
| pNM2A + ATP | 273.8 ± 14.5 (n = 13) | 151.1 ± 15.2 (n = 22) | 9.6 ± 1.1 (n = 25) |
| NM2B | 301.8 ± 25.6 (n = 46) (323 ± 24)* | 151.2 ± 18.6 (n = 78) (166 ± 16)* | 12.6 ± 1.7 (n = 80) (11.5 ± 2.3)* |
| NM2B + ATP | 283.8 ± 34 (n = 36) | 235.7 ± 29.5 (n = 36) | 9.5 ± 2.0 (n = 91) |
| pNM2B | 295.1 ± 24.3 (n = 15) | 133.2 ± 31.5 (n = 23) | 11.0 ± 1.5 (n = 27) |
| pNM2B + ATP | 287.0 ± 19.3 (n = 41) | 137.1 ± 21.2 (n = 18) | 9.9 ± 2.1 (n = 65) |
| NM2C | 289.0 ± 35.2 (n = 84) (293 ± 33)* | 214 ± 16.4 (n = 100) (219 ± 30)* | 8.3 ± 1.6 (n = 56) (7.9 ± 2.1)* |
| NM2C + ATP | 280.4 ± 21.8 (n = 46) | 228.6 ± 16.5 (n = 46) | 5.5 ± 1.1 (n = 90) |
| pNM2C | 300.0 ± 16.7 (n = 131) | 212.4 ± 35 (n = 97) | 8.4 ± 1.6 (n = 173) |
| pNM2C + ATP | 294.6 ± 18.7 (n = 66) | 217.6 ± 22.2 (n = 23) | 7.7 ± 1.3 (n = 93) |
The lengths of the filaments of RLC-phosphorylated and -unphosphorylated NM2A, NM2B, and NM2C were similar and essentially unaffected by the presence of 1 mM ATP in the polymerization buffer (Fig. 9 and Table 2). As reported by Billington et al. (5), the lengths and widths of the bare zones of filaments of RLC-unphosphorylated NM2A and NM2B were similar to each other when polymerized in the absence of ATP. However, addition of 1 mM ATP to the polymerization buffer caused a 40–55% increase in bare-zone length and a 20–25% decrease in bare zone width of the filaments of RLC-unphosphorylated NM2A and NM2B (Fig. 9 and Table 2), suggesting that filaments polymerized in the presence of ATP contain fewer myosin molecules.
The length and width of the bare zones of filaments of RLC-phosphorylated NM2A and NM2B (pNM2A, pNM2B) polymerized in the absence of ATP were not significantly different from the bare zones of RLC-unphosphorylated NM2A and NM2B filaments (Fig. 9 and Table 2). However, in contrast to unphosphorylated NM2A and NM2B filaments, the bare-zone lengths of pNM2A and pNM2B filaments were not increased, and their bare-zone widths were reduced by only ∼10% when polymerized with ATP (Fig. 9 and Table 2).
When polymerized in the absence of ATP, the bare zones of NM2C and pNM2C filaments were ∼25–40% longer, and their widths about 25% shorter, than the bare zones of both RLC-phosphorylated and -unphosphorylated NM2A and NM2B filaments (Fig. 9 and Table 2). However, in contrast to the large increase in length and the decrease in width of the bare zones of RLC-unphosphorylated NM2A and NM2B filaments in ATP, polymerization of NM2C in ATP had minimal effect (∼7%) on the length of the bare zones of RLC-unphosphorylated and -phosphorylated NM2C, but polymerization in ATP did reduce the width of the bare zones of filaments of RLC-unphosphorylated and -phosphorylated NM2C by 34% and 8%, respectively (Fig. 9 and Table 2), similar to the effect of ATP on the polymerization of RLC-unphosphorylated and -phosphorylated NM2A and NM2B.
Discussion
This paper presents data for the minimal monomer concentrations required for the assembly of RLC-unphosphorylated and -phosphorylated NM2A, NM2B, and NM2C in both the absence and presence of ATP. We found that phosphorylation of the RLC does not have a significant effect on the monomer concentration required for assembly of the three recombinant NM2s in the absence of ATP, and that phosphorylation of RLC causes only minor reductions of the monomer concentrations required for assembly in the presence of 1 mM ATP. These differences are much too small to explain the 35–75% decrease in light scattering upon addition of 1 mM ATP to NM2s, and the recovery of light scattering upon phosphorylation of the RLC. Rather, quantitative analytical ultracentrifugation, supported by electron microscopy, demonstrated that, in the presence of ATP, a substantial fraction of RLC-unphosphorylated NM2s—but very little RLC-phosphorylated NM2s—forms dimers, tetramers, hexamers, and other small oligomers. This differential effect of ATP on the assembly of RLC-unphosphorylated and -phosphorylated myosins is the principal cause of the decrease in light scattering when ATP is added to unphosphorylated NM2, and the recovery of light scattering upon phosphorylation of the RLC. Addition of 1 mM ATP to RLC-unphosphorylated NM2s also caused as much as a 55% increase in the length of the filament bare zones and up to a 35% reduction in bare-zone width, indicative of the formation of filaments with fewer molecules, which may contribute to the ATP-induced decrease in light scattering (20).
The myosin concentrations required for assembly of the RLC-unphosphorylated NM2s in the absence of ATP, ∼3–10 nM, are similar to the values of 14 nM reported for Dictyostelium myosin II (22) and ∼5 nM for Acanthamoeba myosin II (23), but only ∼10% of the values previously determined for NM2s purified from thymus and brush border (18). The differences between our data for the three recombinant NM2s and the data for thymus and brush border NM2s are most likely because the earlier values were for the myosin remaining in the supernatant after centrifugation of polymerized myosins at ∼100,000 × g for 20 min, whereas we find it requires centrifugation at ∼400,000 × g for 20 min to sediment the dimers, tetramers, and hexamers that form under polymerization conditions.
Pollard’s group investigated the pathway of polymerization of Acanthamoeba myosin II, demonstrating that extended monomers and extended antiparallel dimers are the basic assembly units for that myosin II (23–26). We now find that, like smooth muscle myosin (27), NM2 monomers are in a folded 10 S structure at physiological ionic strength (150 mM NaCl) irrespective of the status of RLC phosphorylation or the presence of ATP. From the electron microscopic images at steady state, we infer that polymerization is initiated by folded 10 S monomers forming folded antiparallel dimers that then either unfold to form extended bipolar dimers that assemble into filaments, or form folded tetramers and hexamers that unfold and assemble into higher structures (Fig. 10). We speculate that intermolecular interactions within the tail region may be the driving force for opening the folded dimers and higher oligomers. RLC phosphorylation, which is insufficient to unfold 10 S monomers at physiological ionic strength in vitro, may weaken the interaction between the RLC and the folded tail, and thus enhance opening of folded structures (dimers, tetramers, and hexamers) and facilitate polymerization to filaments in the presence of ATP, which will always be present in vivo.
Fig. 10.
Proposed assembly pathway of NM2s in 150 mM NaCl both with and without ATP. Based on the images shown in Figs. 6–8, we propose that, irrespective of the presence or absence of ATP or the status of RLC-phosphorylation, folded monomers form folded dimers and folded tetramers that unfold and associate into filaments. Phosphorylation of the RLC facilitates unfolding.
How much of the nonmuscle myosin II in a cell might be in the folded monomer or oligomer conformation? Several studies have assessed the polymerization state of NM2 in cells using a myosin solubility assay wherein cells are lysed with Triton X-100, and the lysate subjected to sedimentation followed by quantitative measurements of the amount of myosin in the supernatants and pellets (28–30). Those assays typically show that 40–70% of the NM2 remains associated with the Triton-insoluble cytoskeleton, and that modifications of NM2s that might be expected to disrupt or destabilize the folded monomer conformation result in a larger fraction of the myosin in the cytoskeleton. However, those studies typically centrifuged the Triton lysate at only 7,000–20,000 × g, which is unlikely to sediment myosin filaments that are not bound to the cytoskeleton; we have observed filaments of recombinant NM2A in the supernatant after centrifugation at 200,000 × g for 15 min. Therefore, it is not clear what myosin structures are measured in such experiments.
Interpretation of the polymerization status of NM2s in cells is further complicated by several other factors. First, the large actin network associated with the cytoskeleton might bind nonfilamentous myosins. Second, the cytoplasm undergoes considerable dilution upon cell lysis, which is likely to disassemble myosin filaments. Third, the phosphorylation status of the myosin HCs or myosin binding proteins, which affect the polymerization status of NM2s (31), was usually not controlled in those experiments. For these reasons, it is uncertain that the filamentous status of myosins in nonmuscle cells has been appropriately determined using cell lysis methods.
Recent research, using superresolution light-microscopic imaging of living cells by which individual myosin filaments could be discerned, have shown that myosin filaments are very dynamic (32–34). Myosins tagged with fluorescent fusion proteins were imaged as closely spaced “dumbbells” corresponding to the ∼300-nm-long bipolar filaments assembled in vitro. The early stages of myosin filament assembly in vivo were observed as dim punctates in the lamellae of cells near their leading edge. These punctates grew brighter as they appeared to be carried away from the cell periphery by retrograde actin flow. At times, the punctates split into two parts, which then each subsequently grew brighter, presumably as more monomeric myosin added to the filaments (32, 33).
Further evidence of filament dynamicity was shown in an experiment in which NM2A with a photo-convertible tag was transfected into U2OS cells (35). The myosin in a small rectangle of the cell was photo-converted from green to red, and within 1 min red myosin began to coassemble with existing green myosin filaments as far away as 15 µm. The individual myosin filaments that remained in the photo-converted area did not undergo long-range motion, which is consistent with the slow rate at which NM2A translocates actin filaments in vitro, ∼200 nm/s (36); it would not be possible for myosin filaments to move that distance over such a short time using its own motor activity. It is also unlikely that filaments containing much less than the typical 30 myosin molecules of NM2B filaments would constitute a functional unit. Based on the experimentally determined duty ratio for NM2B subfragment-1, it has been proposed (37, 38) that about 10 myosin heads would have to be in position to bind actin filaments to ensure processivity of the NM2B filament. Because NM2B filaments are bipolar, this implies that filaments containing fewer than 10–12 myosin molecules might not be functional in cells. NM2A has even a lower duty ratio and is thus likely to be even less processive as filaments (39). These data strongly suggest that NM2 filaments are in dynamic equilibrium with monomers, dimers, or small oligomers that rapidly diffuse without extensive interaction with the actin network.
The localizations of NM2 filaments do change dramatically when cells undergo mitosis, change direction of migration, or are challenged with external stimuli, such as growth factors or drugs that affect myosin phosphorylation (4). A recent study (33) suggests that there is a limited pool of NM2s in cells, that the two major light-chain kinases, MLCK and ROCK, are differentially localized and compete for this pool, and that inhibition of either of these kinases results in overaccumulation of myosin in the vicinity of the other kinase.
It has been suggested that a dynamic equilibrium between myosin filaments and monomers could be a mechanism that allows cells to alter the localization of NM2 filaments (12, 30). However, with the reasonable assumption that the NM2 concentration in a typical mammalian cell is in the micromolar range, it seems unlikely that the ≤50 nM differences in the monomer concentration in equilibrium with assembled RLC-unphosphorylated NM2s and RLC-phosphorylated NM2s that we describe in the present paper would per se have a significant effect on the filament concentration or cellular distribution of the myosins. However, if dephosphorylation of their RLCs leads NM2s to disassemble to multiple folded oligomers in vivo, as we now show it does in vitro, dephosphorylation could be the mechanism for rapid disassembly of filamentous NM2 to oligomers, relocalization of diffusible oligomeric NM2s, and rapid reassembly of filaments in the new location after rephosphorylation of the RLCs.
Materials and Methods
Cloning of cDNAs.
The cDNAs of NM2A HC (Homo sapiens myosin heavy chain 9), NM2B HC (H. sapiens myosin heavy chain 10 transcript variant 2), and mouse NM2C HC (Mus musculus myosin heavy chain 14 transcript variant 1) were cloned onto pFastbac, the Bac-to-Bac plasmid for expression in Sf-9 cells (Invitrogen). A FLAG tag (DYKDDDDK) was added to the N termini of the HCs for facilitation of purification of the recombinant myosins. The cDNAs of NM2 RLC (H. sapiens nonmuscle myosin II, sequence ID:NP_291024.1) and ELC (M. musculus nonmuscle myosin II, sequence ID:NP_034990.1) were cloned onto pFastbac for expression in Sf-9 cells.
Expression and Purification of Proteins.
The baculoviruses for expressing HCs and LCs were constructed according to the company’s product manual (Invitrogen). Recombinant full-length myosins were produced by coexpression of the HC and two LC baculoviruses in Sf-9 cells. The recombinant NM2s were purified as described by Liu et al. (40) using anti-FLAG resin (Sigma-Aldrich) affinity chromatography. Briefly, cells were harvested 72 h postinfection and washed in 10 mM Tris, pH 7.5. The cells were ruptured in a French press in buffer containing 200 mM NaCl, 10 mM Mops, pH 7.0, 1 mM DTT, 0.1 mM EGTA, 2 mM MgCl2, 1 mM ATP, 0.1 mM PMSF, and one protease inhibitor mixture tablet (Roche) per 100 mL The lysates were cleared by centrifugation at 125,000 × g at 4 °C for 1 h in a Beckman L8-M centrifuge. The supernatants were mixed with pre-equilibrated anti-FLAG resin (Sigma-Aldrich), and the resin was then washed with 600 mM NaCl, 10 mM Mops, pH 7.0, 1 mM DTT, and eluted with the same buffer containing 0.1 mg/mL FLAG peptide (Sigma-Aldrich). The purified myosins were dialyzed against buffer (10 mM Mops, pH 7.0, 600 mM NaCl and 1 mM DTT) to remove the FLAG peptides, and aliquoted and stored in liquid nitrogen until used.
Preparation of Calmodulin and Myosin II RLC Kinase.
Rat calmodulin was expressed and purified from Escherichia coli. FLAG-tagged rabbit smooth muscle MLCK (NP_001075775) was expressed using Baculovirus and purified from Sf-9 cells.
Phosphorylation of Myosins.
Phosphorylation of the RLC was performed as described previously (5). The reaction mixture contained ∼1.0 µM myosin and ∼10 nM MLCK in 150 mM NaCl, 10 mm Mops, pH 7.0, 2 mM MgCl2, 1 mM ATP, 0.2 mM CaCl2, 1 mM DTT, and 50 nM calmodulin. After phosphorylation, the myosin was dialyzed overnight at 4 °C against 1 L of buffer containing 10 mM Mops, pH 7.0, 50 mM NaCl, 5 mM MgCl2, and 1 mM DTT. The phosphorylated myosin was pelleted by centrifugation of the dialyzed sample in a Beckman TL-100 centrifuge at 4 °C. The pellet and centrifuge tube were washed with the dialysis buffer minus MgCl2, and the washed pellet was dissolved in 600 mM NaCl, 10 mM Mops, pH 7.0, and 1 mM DTT. Samples were aliquoted and kept in liquid N2 until used.
Electrophoresis.
Urea-glycerol PAGE was performed according to a modified method as described previously (41). SDS/PAGE was performed by standard procedures on 10% NuPAGE gels (Invitrogen).
Protein Concentration Assay.
Protein concentrations were determined using the Bradford reagent (Bio-Rad) with purified myosin as standard. The concentration of the myosin standard was determined by UV absorbance and calculated according to the formula [myosin] (mg/mL) = (A280 - A320)/0.52 (5).
Light-Scattering Assay of Myosin Assembly.
Myosin samples in 600 mM NaCl were cleared by centrifugation at 300,000 × g for 15 min at 4 °C in a Beckman TL-100 centrifuge before use. Myosins were polymerized overnight on ice after dilution with appropriate buffers, as described in the figure legends. The samples were warmed to room temperature for 30 min and light scattering was measured at 20 °C in a PTI fluorimeter. Excitation was performed at 365 nm (slit width 0.5 nm) and detected at 365 nm (slit width 0.5 nm).
ATP Hydrolysis.
Non–RLC-phosphorylated NM2A, NMB, and NM2C (260 nM) were individually polymerized overnight at 4 °C in 10 mM Mops (pH 7.0), 150 mM NaCl, 0.1 mM EGTA, 1 mM DTT, 2 mM MgCl2, and 1 mM [γ-32P]ATP, and then for 30 min at room temperature. The production of 32Pi was determined as described previously (42).
Sedimentation Assay of Myosin Assembly.
Before use, myosin samples in 600 mM NaCl were cleared by centrifugation at 300,000 × g at 4 °C for 15 min in a Beckman TL-100 centrifuge. Myosins were polymerized overnight on ice by diluting with the buffers identified in the figure legends. The total volume for each assay was 100 µL, and samples were centrifuged for 20 min at 4 °C in a Beckman TL 150 centrifuge at 400,000 × g to separate assembled myosin from monomeric myosin. Under these conditions, which were necessary to sediment the small oligomers formed when RLC-unphosphorylated myosins were assembled in the presence of ATP, 50% of monomeric myosin pelleted. Therefore, in analyzing the polymerization data (Fig. 3), the concentration of monomeric myosin was estimated as twice the myosin concentration in the supernatant, and the myosin concentration in the supernatant was subtracted from the myosin concentration in the pellet to estimate the concentration of assembled myosin. The pellets were suspended in 115 µL of SDS sample buffer, 15 µL of 2 × SDS buffer were added to the supernatants, and the supernatants and pellets were analyzed by SDS/PAGE, the gels stained with Coomassie blue, and protein bands quantified with an Odyssey infrared imaging system (LI-COR Biosciences).
Sedimentation Velocity Analytical Ultracentrifugation.
Purified monomeric NM2B was dialyzed extensively against 10 mM Mops, pH 7.0, 600 mM NaCl and 1 mM DTT, and then polymerized overnight on ice 10 mM Mops, pH 7.0, and 2 mM MgCl2 containing either 150 mM NaCl and 1 mM ATP, or 180 mM NaCl without ATP. The assembled myosins were cross-linked by incubation with EDC at room temperature for 30 min to prevent pressure-induced disassembly (43, 44). Samples of cross-linked NM2B (260 nM) were loaded into double-sector analytical ultracentrifugation cells that were placed in the four-hole rotor, and equilibrated thermally in the Beckman Optima XL-I analytical ultracentrifuge and thermally equilibrated at 20 °C. The samples assembled in the absence of ATP was centrifuged at 15,000 rpm (∼16,000 × g). Samples containing ATP were analyzed by the gravtional sweep method (45), and centrifuged initially for 1 h at 20,000 rpm (∼29,000 × g), immediately followed by centrifugation at 50,000 rpm (∼182,000 × g). Interference (refractive index) and 295-nm absorbance scans were started immediately, and were collected until no further sedimentation boundary movement was observed. The sedimentation data were analyzed by Lamm equation modeling using the SEDFIT software (46). The logarithmically spaced c(S) grid was used to fit the wide sedimentation coefficients range, and the final sedimentation distribution coefficients c(S) had rmsds comparable with the noise of the detection system of the centrifuge.
Electron Microscopy.
Protein samples were cleared before use by centrifugation at 300,000 × g for 15 min at 4 °C in a Beckman TL-100 centrifuge. Myosins (except for RLC-unphosphorylated myosins + ATP) were polymerized at a concentration of 250 nM in 10 mM Mops, pH 7.0, 150 mM NaCl, 2 mM MgCl2, 1 mM DTT, and 0.1 mM EGTA with or without 1 mM ATP. Samples were diluted to the concentrations in the figure legends, and 4 µL applied to a UV light pretreated carbon-coated copper grid and stained with 1% uranyl acetate. For assembly of RLC-unphosphorylated NM2A, NM2B, and NM2C in the presence of ATP, the myosin concentration was about 500 nM and the samples were diluted as stated in the figure legends before being applied to the grid. To observe small oligomers in equilibrium with unphosphorylated NM2A and NM2B, samples were first cross-linked with EDC, as described for analytical ultracentrifugation, or by incubation for 1 min with 0.1% glutaraldehyde in assembly buffer at room temperature, and diluted to 20 nM before applying to the grid. Micrographs were recorded on a JEOL 1200EX II microscope at room temperature. Filament widths and lengths were determined with Metamorph software.
Acknowledgments
We thank the National Heart, Lung, and Blood Institute Electron Microscopy Core for the use of its facilities; Stephanie Zalesak, who performed some of the analytical ultracentrifugation analyses; and Fang Zhang for providing MLCK. The research was supported by the Intramural Research Program of the National Heart, Lung, and Blood Institute.
Footnotes
The authors declare no conflict of interest.
This article is a PNAS Direct Submission.
References
- 1.Odronitz F, Kollmar M. Drawing the tree of eukaryotic life based on the analysis of 2,269 manually annotated myosins from 328 species. Genome Biol. 2007;8:R196. doi: 10.1186/gb-2007-8-9-r196. [DOI] [PMC free article] [PubMed] [Google Scholar]
- 2.Richards TA, Cavalier-Smith T. Myosin domain evolution and the primary divergence of eukaryotes. Nature. 2005;436:1113–1118. doi: 10.1038/nature03949. [DOI] [PubMed] [Google Scholar]
- 3.Sellers JR. Myosins: A diverse superfamily. Biochim Biophys Acta. 2000;1496:3–22. doi: 10.1016/s0167-4889(00)00005-7. [DOI] [PubMed] [Google Scholar]
- 4.Vicente-Manzanares M, Ma X, Adelstein RS, Horwitz AR. Non-muscle myosin II takes centre stage in cell adhesion and migration. Nat Rev Mol Cell Biol. 2009;10:778–790. doi: 10.1038/nrm2786. [DOI] [PMC free article] [PubMed] [Google Scholar]
- 5.Billington N, Wang A, Mao J, Adelstein RS, Sellers JR. Characterization of three full-length human nonmuscle myosin II paralogs. J Biol Chem. 2013;288:33398–33410. doi: 10.1074/jbc.M113.499848. [DOI] [PMC free article] [PubMed] [Google Scholar]
- 6.Suzuki H, Kamata T, Onishi H, Watanabe S. Adenosine triphosphate-induced reversible change in the conformation of chicken gizzard myosin and heavy meromyosin. J Biochem. 1982;91:1699–1705. doi: 10.1093/oxfordjournals.jbchem.a133861. [DOI] [PubMed] [Google Scholar]
- 7.Trybus KM, Huiatt TW, Lowey S. A bent monomeric conformation of myosin from smooth muscle. Proc Natl Acad Sci USA. 1982;79:6151–6155. doi: 10.1073/pnas.79.20.6151. [DOI] [PMC free article] [PubMed] [Google Scholar]
- 8.Ikebe M, Koretz J, Hartshorne DJ. Effects of phosphorylation of light chain residues threonine 18 and serine 19 on the properties and conformation of smooth muscle myosin. J Biol Chem. 1988;263:432–6437. [PubMed] [Google Scholar]
- 9.Scholey JM, Taylor KA, Kendrick-Jones J. Regulation of non-muscle myosin assembly by calmodulin-dependent light chain kinase. Nature. 1980;287:233–235. doi: 10.1038/287233a0. [DOI] [PubMed] [Google Scholar]
- 10.Scholey JM, Smith RC, Drenckhahn D, Groschel-Stewart U, Kendrick-Jones J. Thymus myosin. Isolation and characterization of myosin from calf thymus and thymic lymphocytes, and studies on the effect of phosphorylation of its Mr = 20,000 light chain. J Biol Chem. 1982;257:7737–7745. [PubMed] [Google Scholar]
- 11.Ikebe M, Hartshorne DJ, Elzinga M. Identification, phosphorylation, and dephosphorylation of a second site for myosin light chain kinase on the 20,000-dalton light chain of smooth muscle myosin. J Biol Chem. 1986;261:36–39. [PubMed] [Google Scholar]
- 12.Cross RA. What is 10S myosin for? J Muscle Res Cell Motil. 1988;9:108–110. doi: 10.1007/BF01682153. [DOI] [PubMed] [Google Scholar]
- 13.Wendt T, Taylor D, Messier T, Trybus KM, Taylor KA. Visualization of head-head interactions in the inhibited state of smooth muscle myosin. J Cell Biol. 1999;147:1385–1390. doi: 10.1083/jcb.147.7.1385. [DOI] [PMC free article] [PubMed] [Google Scholar]
- 14.Wendt T, Taylor D, Trybus KM, Taylor K. Three-dimensional image reconstruction of dephosphorylated smooth muscle heavy meromyosin reveals asymmetry in the interaction between myosin heads and placement of subfragment 2. Proc Natl Acad Sci USA. 2001;98:4361–4366. doi: 10.1073/pnas.071051098. [DOI] [PMC free article] [PubMed] [Google Scholar]
- 15.Jung HS, et al. Role of the tail in the regulated state of myosin 2. J Mol Biol. 2011;408:863–878. doi: 10.1016/j.jmb.2011.03.019. [DOI] [PMC free article] [PubMed] [Google Scholar]
- 16.Ni S, et al. Modification of interface between regulatory and essential light chains hampers phosphorylation-dependent activation of smooth muscle myosin. J Biol Chem. 2012;287:22068–22079. doi: 10.1074/jbc.M112.343491. [DOI] [PMC free article] [PubMed] [Google Scholar]
- 17.Taylor KA, et al. Role of the essential light chain in the activation of smooth muscle myosin by regulatory light chain phosphorylation. J Struct Biol. 2014;185:375–382. doi: 10.1016/j.jsb.2013.12.008. [DOI] [PMC free article] [PubMed] [Google Scholar]
- 18.Kendrick-Jones J, Smith RC, Craig R, Citi S. Polymerization of vertebrate non-muscle and smooth muscle myosins. J Mol Biol. 1987;198:241–252. doi: 10.1016/0022-2836(87)90310-x. [DOI] [PubMed] [Google Scholar]
- 19.Smulders MM, et al. How to distinguish isodesmic from cooperative supramolecular polymerisation. Chemistry. 2010;16:362–367. doi: 10.1002/chem.200902415. [DOI] [PubMed] [Google Scholar]
- 20.Attri AK, Minton AP. New methods for measuring macromolecular interactions in solution via static light scattering: Basic methodology and application to nonassociating and self-associating proteins. Anal Biochem. 2005;337:103–110. doi: 10.1016/j.ab.2004.09.045. [DOI] [PubMed] [Google Scholar]
- 21.Trybus KM, Lowey S. Assembly of smooth muscle myosin minifilaments: Effects of phosphorylation and nucleotide binding. J Cell Biol. 1987;105:3007–3019. doi: 10.1083/jcb.105.6.3007. [DOI] [PMC free article] [PubMed] [Google Scholar]
- 22.Kuczmarski ER, Spudich JA. Regulation of myosin self-assembly: Phosphorylation of Dictyostelium heavy chain inhibits formation of thick filaments. Proc Natl Acad Sci USA. 1980;77:7292–7296. doi: 10.1073/pnas.77.12.7292. [DOI] [PMC free article] [PubMed] [Google Scholar]
- 23.Sinard JH, Pollard TD. The effect of heavy chain phosphorylation and solution conditions on the assembly of Acanthamoeba myosin-II. J Cell Biol. 1989;109:1529–1535. doi: 10.1083/jcb.109.4.1529. [DOI] [PMC free article] [PubMed] [Google Scholar]
- 24.Sinard JH, Stafford WF, Pollard TD. The mechanism of assembly of Acanthamoeba myosin-II minifilaments: Minifilaments assemble by three successive dimerization steps. J Cell Biol. 1989;109:1537–1547. doi: 10.1083/jcb.109.4.1537. [DOI] [PMC free article] [PubMed] [Google Scholar]
- 25.Sinard JH, Pollard TD. Acanthamoeba myosin-II minifilaments assemble on a millisecond time scale with rate constants greater than those expected for a diffusion limited reaction. J Biol Chem. 1990;265:3654–3660. [PubMed] [Google Scholar]
- 26.Sinard JH, Rimm DL, Pollard TD. Identification of functional regions on the tail of Acanthamoeba myosin-II using recombinant fusion proteins. II. Assembly properties of tails with NH2- and COOH-terminal deletions. J Cell Biol. 1990;111:2417–2426. doi: 10.1083/jcb.111.6.2417. [DOI] [PMC free article] [PubMed] [Google Scholar]
- 27.Trybus KM, Lowey S. Conformational states of smooth muscle myosin. Effects of light chain phosphorylation and ionic strength. J Biol Chem. 1984;259:8564–8571. [PubMed] [Google Scholar]
- 28.Kiboku T, et al. Nonmuscle myosin II folds into a 10S form via two portions of tail for dynamic subcellular localization. Genes Cells. 2013;18:90–109. doi: 10.1111/gtc.12021. [DOI] [PubMed] [Google Scholar]
- 29.Rosenberg M, Straussman R, Ben-Ya’acov A, Ronen D, Ravid S. MHC-IIB filament assembly and cellular localization are governed by the rod net charge. PLoS One. 2008;3:e1496. doi: 10.1371/journal.pone.0001496. [DOI] [PMC free article] [PubMed] [Google Scholar]
- 30.Breckenridge MT, Dulyaninova NG, Egelhoff TT. Multiple regulatory steps control mammalian nonmuscle myosin II assembly in live cells. Mol Biol Cell. 2009;20:338–347. doi: 10.1091/mbc.E08-04-0372. [DOI] [PMC free article] [PubMed] [Google Scholar]
- 31.Dulyaninova NG, Bresnick AR. The heavy chain has its day: Regulation of myosin-II assembly. BioArchitecture. 2013;3:77–85. doi: 10.4161/bioa.26133. [DOI] [PMC free article] [PubMed] [Google Scholar]
- 32.Fenix AM, et al. Expansion and concatenation of non-muscle myosin IIA filaments drive cellular contractile system formation during interphase and mitosis. Mol Biol Cell. 2016;27:1465–1478. doi: 10.1091/mbc.E15-10-0725. [DOI] [PMC free article] [PubMed] [Google Scholar]
- 33.Beach JR, et al. Actin dynamics and competition for myosin monomer govern the sequential amplification of myosin filaments. Nat Cell Biol. 2017;19:85–93. doi: 10.1038/ncb3463. [DOI] [PMC free article] [PubMed] [Google Scholar]
- 34.Hu S, et al. Long-range self-organization of cytoskeletal myosin II filament stacks. Nat Cell Biol. 2017;19:133–141. doi: 10.1038/ncb3466. [DOI] [PubMed] [Google Scholar]
- 35.Baird MA, et al. Local pulsatile contractions are an intrinsic property of the myosin 2A motor in the cortical cytoskeleton of adherent cells. Mol Biol Cell. 2017;28:240–251. doi: 10.1091/mbc.E16-05-0335. [DOI] [PMC free article] [PubMed] [Google Scholar]
- 36.Wang F, Harvey EV, Conti MA, Wei D, Sellers JR. A conserved negatively charged amino acid modulates function in human nonmuscle myosin IIA. Biochemistry. 2000;39:5555–5560. doi: 10.1021/bi000133x. [DOI] [PubMed] [Google Scholar]
- 37.Nagy A, et al. Kinetic characterization of nonmuscle myosin IIb at the single molecule level. J Biol Chem. 2013;288:709–722. doi: 10.1074/jbc.M112.424671. [DOI] [PMC free article] [PubMed] [Google Scholar]
- 38.Wang F, et al. Kinetic mechanism of non-muscle myosin IIB: Functional adaptations for tension generation and maintenance. J Biol Chem. 2003;278:27439–27448. doi: 10.1074/jbc.M302510200. [DOI] [PubMed] [Google Scholar]
- 39.Kovács M, Wang F, Hu A, Zhang Y, Sellers JR. Functional divergence of human cytoplasmic myosin II: kinetic characterization of the non-muscle IIA isoform. J Biol Chem. 2003;278:38132–38140. doi: 10.1074/jbc.M305453200. [DOI] [PubMed] [Google Scholar]
- 40.Liu X, et al. Regulation of the actin-activated MgATPase activity of Acanthamoeba myosin II by phosphorylation of serine 639 in motor domain loop 2. Proc Natl Acad Sci USA. 2013;110:E23–E32. doi: 10.1073/pnas.1219713110. [DOI] [PMC free article] [PubMed] [Google Scholar]
- 41.Ruppel KM, Uyeda TQ, Spudich JA. Role of highly conserved lysine 130 of myosin motor domain. In vivo and in vitro characterization of site specifically mutated myosin. J Biol Chem. 1994;269:18773–18780. [PubMed] [Google Scholar]
- 42.Pollard TD, Korn ED. Acanthamoeba myosin. I. Isolation from Acanthamoeba castellanii of an enzyme similar to muscle myosin. J Biol Chem. 1973;248:4682–4690. [PubMed] [Google Scholar]
- 43.Josephs R, Harrington WF. An unusual pressure dependence for a reversibly associating protein system; sedimentation studies on myosin. Proc Natl Acad Sci USA. 1967;58:1587–1594. doi: 10.1073/pnas.58.4.1587. [DOI] [PMC free article] [PubMed] [Google Scholar]
- 44.Davis JS. The influence of pressure on the self-assembly of the thick filament from the myosin of vertebrate skeletal muscle. Biochem J. 1981;197:301–308. doi: 10.1042/bj1970301. [DOI] [PMC free article] [PubMed] [Google Scholar]
- 45.Ma J, Zhao H, Sandmaier J, Alexander Liddle J, Schuck P. Variable field analytical ultracentrifugation: II. Gravitational sweep sedimentation velocity. Biophys J. 2016;110:103–112. doi: 10.1016/j.bpj.2015.11.027. [DOI] [PMC free article] [PubMed] [Google Scholar]
- 46.Schuck P. Size-distribution analysis of macromolecules by sedimentation velocity ultracentrifugation and Lamm equation modeling. Biophys J. 2000;78:1606–1619. doi: 10.1016/S0006-3495(00)76713-0. [DOI] [PMC free article] [PubMed] [Google Scholar]


