Significance
Mitochondrial perturbation-associated dysregulation of one organ has been shown to nonautonomously affect the functions of other organs in both vertebrates and invertebrates. Using Drosophila as a genetic model organism, we characterized mitochondrial synchrony dysregulation across organs and uncovered that mitochondrial perturbation caused by complex I disruption in muscles remotely impairs mitochondrial function and lipid mobilization in the fat body, leading to obesity. We further identified that the TGF-β ligand Actβ, which is autonomously increased by muscular mitochondrial perturbation, mediates muscle-to-fat-body communication and synchronized mitochondrial dysregulation.
Keywords: mitochondrial synchrony, Activin-β, complex I perturbation, NF-κB/Relish, lipid metabolism
Abstract
Mitochondrial dysfunction has been associated with obesity and metabolic disorders. However, whether mitochondrial perturbation in a single tissue influences mitochondrial function and metabolic status of another distal tissue remains largely unknown. We analyzed the nonautonomous role of muscular mitochondrial dysfunction in Drosophila. Surprisingly, impaired muscle mitochondrial function via complex I perturbation results in simultaneous mitochondrial dysfunction in the fat body (the fly adipose tissue) and subsequent triglyceride accumulation, the major characteristic of obesity. RNA-sequencing (RNA-seq) analysis, in the context of muscle mitochondrial dysfunction, revealed that target genes of the TGF-β signaling pathway were induced in the fat body. Strikingly, expression of the TGF-β family ligand, Activin-β (Actβ), was dramatically increased in the muscles by NF-κB/Relish (Rel) signaling in response to mitochondrial perturbation, and decreasing Actβ expression in mitochondrial-perturbed muscles rescued both the fat body mitochondrial dysfunction and obesity phenotypes. Thus, perturbation of muscle mitochondrial activity regulates mitochondrial function in the fat body nonautonomously via modulation of Activin signaling.
Individual organs in a multicellular organism, besides performing their respective roles, must communicate with other organs to maintain systemic homeostasis. The central nervous system (CNS) in particular integrates information regarding the status of peripheral metabolic processes via hormonal signaling and directs energy homeostasis and feeding behavior (1). In addition, metabolic changes in a peripheral organ can affect the physiology of other peripheral organs (2, 3). The skeletal muscle system, which is newly recognized as playing endocrine-related roles, produces myokines after exercise to target other metabolic organs (liver, adipose tissue, pancreas, gut, and bone) and modulates systemic energy homeostasis (4).
Mitochondria are semiautonomous organelles that integrate multiple physiological signals. Growing evidence indicates that mitochondrial alterations in one organ leads to abnormalities in biological processes in distal organs through hormonal signaling (5, 6). In addition to exercise, which induces mitochondrial activity and improves muscle performance, mitochondrial perturbation-associated muscle injury is also sufficient to modulate functions of other organs and change systemic outcomes via myokine production. For example, in mammals, mitochondrial dysfunction due to disruption of autophagic function in skeletal muscles results in elevated production of muscular FGF21 that triggers browning of white adipose tissue and increases lipid mobilization (7). Further, in Drosophila, mild mitochondrial distress in adult muscles delays aging via an increase of muscular ImpL2 production and remote suppression of insulin signaling in the fat body and brain (8). Despite these examples, molecular mechanism(s) underlying muscle mitochondrial dysfunction-associated organ communication remains largely unknown. Characterization of this interorgan communication network may deepen our understanding of systemic diseases, such as aging and obesity.
In this study, we performed muscle-specific mitochondrial perturbation in Drosophila and demonstrate that this triggers simultaneous and nonautonomous mitochondrial dysfunction in the fat body. To characterize the affected signaling pathways, we analyzed transcriptome changes in the fat body by using RNA-sequencing (RNA-seq), leading us to implicate TGF-β signaling in muscle-to-fat-body communication. Finally, we show that production of Actβ, a TGF-β ligand, is increased in muscles with mitochondrial dysfunction and that muscle-derived Actβ triggers TGF-β signaling via Babo to decrease mitochondrial activity and increase lipid storage in the fat body. Altogether, our results identify Actβ as a mitochondrial-related hormone involved in “mitochondrial synchrony” regulation in both muscle and fat body.
Results
Muscle Mitochondrial Perturbation Results in Mitochondrial Dysfunction and Lipid Accumulation in the Fat Body.
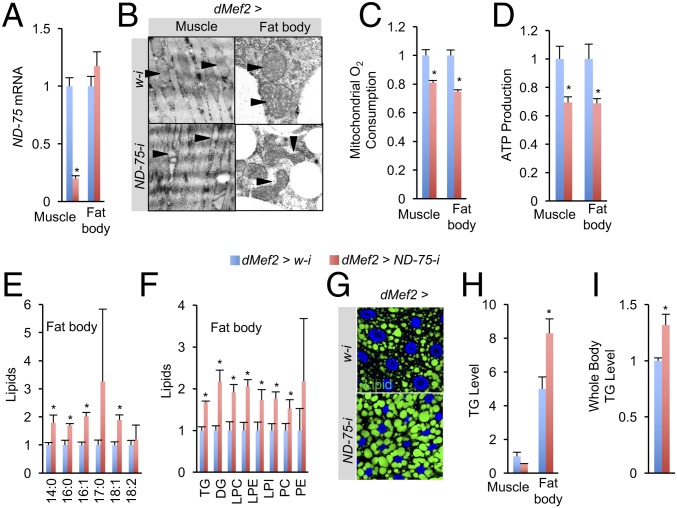
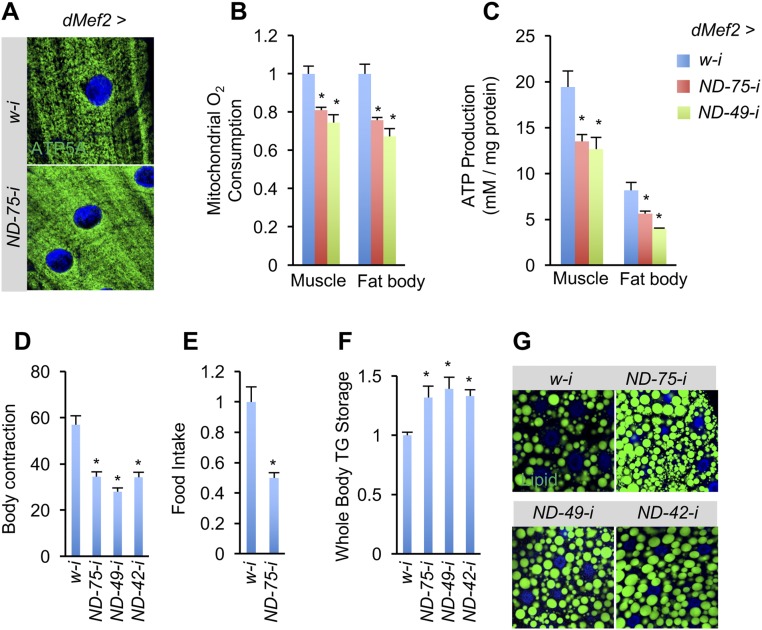
To examine whether perturbing mitochondrial function in muscles affects the function of other organs, we disrupted the activity of mitochondrial complex I NADH:ubiquinone oxidoreductase, which serves as the electron entry point in electron transport chain (ETC), specifically in larval muscles using RNAi. RNAi perturbation of the complex I component ND-75/NDUFS1 in muscle using the dMef2-Gal4 driver resulted in a reduction in ND-75 mRNA levels in dMef2 > ND-75-i larval muscles by ∼80% (relative to controls bearing white [w] RNAi control, dMef2 > w-i), whereas ND-75 mRNA levels were not changed in the fat body (Fig. 1A). We previously reported that ND-75 knockdown does not affect overall muscle integrity although it results in larvae with smaller muscles (8). However, complex I perturbation via ND-75 knockdown in dMef2 > ND-75-i muscle dramatically disrupted the integrity of mitochondria embedded in the myofibers compared with the well-organized, compact mitochondria observed in control dMef2 > w-i larval muscles (Fig. 1B, arrowhead). Note that mitochondrial mass in dmef2 > ND-75-i muscle was elevated in a compensatory manner (Fig. S1A). Consistent with mitochondrial disintegration, dMef2 > ND-75-i larval muscles were associated with a decrease in both ADP-induced O2 consumption of isolated mitochondria and ATP production of muscle tissue (Fig. 1 C and D). Further, larval muscle contraction was significantly reduced (Fig. S1D).
Fig. 1.
Muscle mitochondrial complex I perturbation results in mitochondrial dysfunction and lipid accumulation in the fat body. (A) Relative ND-75 mRNA levels in the muscles and fat bodies of dMef2 > w-i (dMef2-Gal4/UAS-w-i) and dMef2 > ND-75-i (dMef2-Gal4/UAS-ND-75-i) larvae (n = 3, 10 pooled tissues per replicate). (B) Representative electronic microscope images of mitochondria morphology in larval muscles (embedded in myofiber) or fat body. Arrowheads indicate individual mitochondria. (C and D) O2 consumption rates in isolated mitochondria after ADP treatment (C, n = 3, 20 pooled tissues per replicate) and ATP levels (D, n = 3, 5 pooled tissues per replicate) in larval tissues. (E and F) Lipidomic analysis indicating composition changes of short-chain lipids (E) and other lipids (F), including triglyceride (TG), diglyceride (DG), lysophosphatidylcholine (LPC), lysophosphatidylethanolamine (LPE), lysophosphatidylinositol (LPI), phosphatidylcholine (PC), and lysophosphatidylethanolamine (PE), in the larval fat bodies. (G and H) Bodipy staining of intracellular neutral lipid in larval fat body cells (G) and TG levels in larval tissues (H, n = 3, 5 pooled tissues per replicate). (I) TG levels in the third instar larvae (n = 3, 5 pooled larvae per replicate). Data are presented as means ± SEM *P < 0.05.
Fig. S1.
Muscle complex I perturbation remotely decreases mitochondrial activity in the fat body. (A) Representative confocal images of mitochondrial morphology, indicated by ATP5A immunostaining, in larval muscle (green, ATP5A; blue, DAPI). (B and C) ADP-induced mitochondrial O2 consumption rates (B, n = 3, 60 tissues per group) and ATP levels (C, n = 3, 5 pooled tissues per replicate) in indicated third instar larvae. (D–G) Body contraction rates (D, n = 10), food intake rates (E, n = 3, 5 pooled larvae per replicate), whole-body TG levels (F, n = 3, 5 pooled larvae per replicate), and staining of fat body neutral lipids (G) in indicated third instar larvae. Genotype: dMef2 > ND-49-i: dMef2-Gal4/UAS-ND-49-i. dMef2 > ND-42-i: dMef2-Gal4/UAS-ND-42-i. Data are presented as means ± SEM, *P < 0.05.
In addition to muscle mitochondrial abnormalities, we unexpectedly observed uneven and distorted mitochondrial morphology in the fat body in dMef2 > ND-75-i larvae (Fig. 1B), although ND-75 mRNA levels remained unchanged in the fat body (Fig. 1A). Both ADP-induced mitochondrial O2 consumption and ATP production in the fat bodies of dMef2 > ND-75-i larvae were significantly decreased (Fig. 1 C and D), indicating decreased mitochondrial activity in the fat body. Because mitochondrial activity is highly associated with lipid mobilization, which is mainly through lipid β-oxidation in the adipose tissue across species (9, 10), we tested whether mitochondrial dysfunction in the fat body impairs lipid homeostasis in dMef2 > ND-75-i larvae. Thus, we performed quantitative lipidomic analysis to assess lipid composition changes in the fat body of dMef2 > ND-75-i larvae. Interestingly, compared with the control, free fatty acid levels in dMef2 > ND-75-i fat body were significantly increased (Fig. 1E and Dataset S1). Other lipid species, including TG (triglycerides) and DG (diglycerides), were also elevated in dMef2 > ND-75-i fat body (Fig. 1F and Dataset S1). Consistent with these observations, Bodipy staining, which labels intracellular neutral lipids, revealed bigger lipid droplets and more lipid droplet numbers in the fat body of dMef2 > ND-75-i larvae (Fig. 1G). Biochemical assays also confirmed an increase in TG storage in dMef2 > ND-75-i fat body and whole animals, compared with controls (Fig. 1 H and I). Increased lipid storage might be caused by muscle-associated changes in feeding. However, we were able to exclude this possibility, because dMef2 > ND-75-i larvae ate less (Fig. S1C), a change in activity expected to decrease lipid storage. Taken together, our data demonstrate that mitochondrial perturbation caused by complex I disruption in the muscle remotely impairs mitochondrial activity in the fat body and results in lipid accumulation.
In addition to ND-75, we also tested the effects of RNAi reagents targeting other complex I components. As observed with ND-75, knockdown of ND-49/NDUFS2 or ND-42/NDUFA10 in the muscle also decreased mitochondrial activity in both muscle and fat body and resulted in fat body lipid accumulation (Fig. S1 B–G).
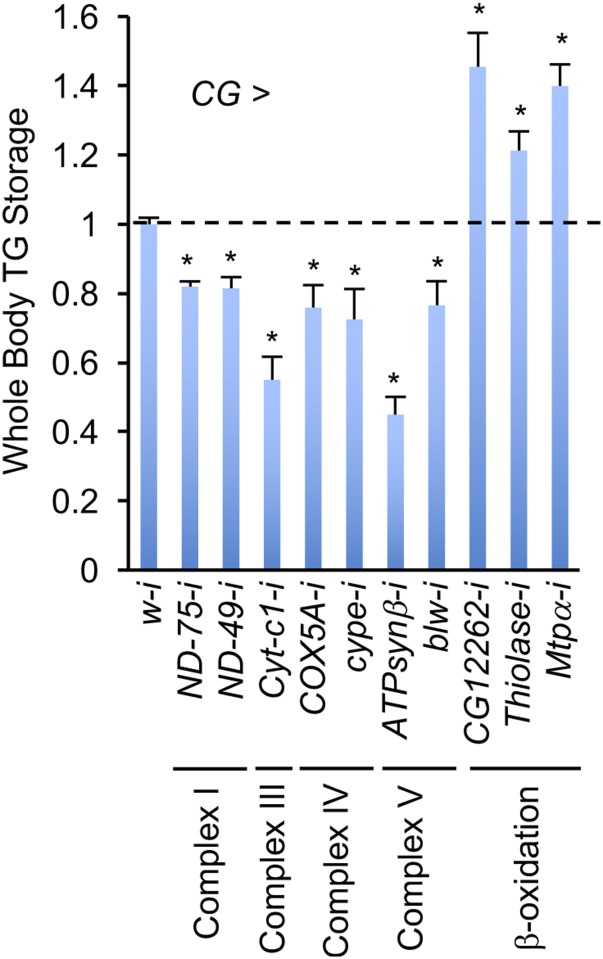
To examine mitochondrial dysfunction in the fat body, we perturbed the components of the ETC (electron transfer chain) or lipid β-oxidation process using RNAi. Surprisingly, perturbation of ETC complex components dramatically depleted whole animal lipid storage (Fig. S2), probably due to disruption of fat body integrity. However, knockdown of components involved in lipid β-oxidation significantly increased TG storage in the fat body (Fig. S2), consistent with the result obtained for complex I perturbation in the muscle. Thus, our results indicate that muscle mitochondrial perturbation remotely suppresses mitochondrial activity and lipid mobilization in the fat body via modulation of lipid β-oxidation.
Fig. S2.
Differential mitochondrial regulation of lipid metabolism in the fat body. TG levels in indicated third instar larvae. UAS-RNAi lines were crossed to CG-Gal4 and progenies were grown at 25 °C until third instar stage (n = 3, 5 pooled larvae per replicate). Data are presented as means ± SEM, *P < 0.05.
Modulation of TGF-β Signaling in the Fat Body upon Muscle Mitochondrial Perturbation.
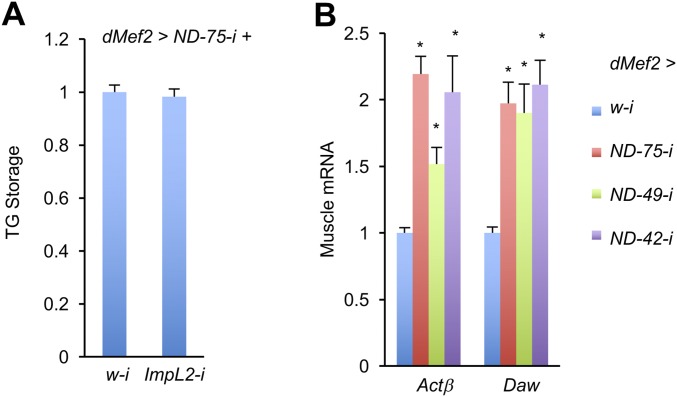
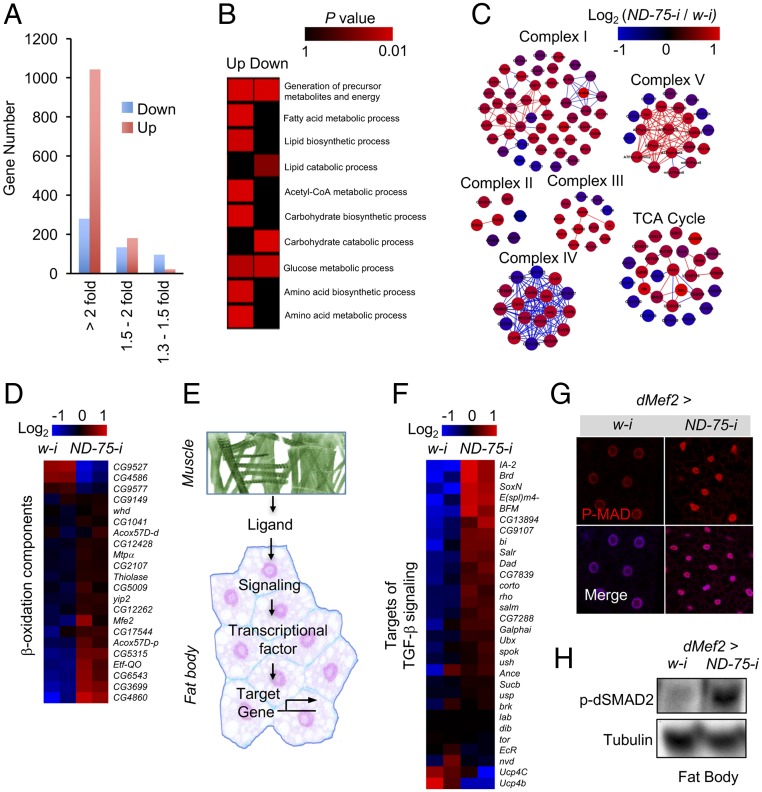
We have shown that muscle-derived ImpL2 results in inhibition of systemic insulin signaling in adult flies (8), suggesting that ImpL2 might also play a role in muscle-to-fat-body communication in larvae. However, ImpL2 knockdown in ND-75–deficient larval muscles (dMef2 > ND-75-i + ImpL2-i) was not sufficient to alleviate TG accumulation caused by complex I perturbation (Fig. S3A), suggesting that additional mechanisms exist in the muscle-to-fat-body regulation. To explore the potential mechanisms, we analyzed changes in the fat body transcriptome in dMef2 > ND-75-i larvae by RNA-seq. Following statistical analyses, 1,592 genes (13% of the transcriptome) were significantly changed (fold change > 1.5) with high confidence; of these, 1,080 are up-regulated and 512 are down-regulated (Fig. 2A and Dataset S2). Gene Ontology (GO) term enrichment analysis of the differentially expressed gene sets revealed that genes involved in amino acid, lipid, carbohydrate, and energy metabolism were preferentially affected (Fig. 2B and Dataset S3). Interestingly, most differentially expressed genes in the GO category “lipid catabolic process” were significantly down-regulated, whereas most genes in “fatty acid metabolic process,” “lipid biosynthetic process,” and “Acetyl-CoA metabolic process” were up-regulated (Fig. 2B). In addition, more than half of the genes that encode mitochondrial proteins, including components of complex I, II, III, IV, V, TCA, and β-oxidation, were up-regulated in dMef2 > ND-75-i larval fat body (Fig. 2 C and D). Altogether, these results suggest that mitochondrial dysfunction in the dMef2 > ND-75-i larval fat body is not caused by overall down-regulation of mitochondrial genes.
Fig. S3.
Muscle expression of TGF-β ligands. (A) TG levels in the third instar larvae with indicated genotypes. UAS-RNAi lines were crossed to UAS-ND-75-i, tub-Gal80; dMef2-Gal4, and the progenies were grown at 29 °C until third instar stage (n = 3, 5 pooled larvae per replicate). (B) Relative mRNA levels of TGF-β ligands in indicated larval muscles (n = 3, 10 pooled larval muscles per replicate). Data are presented as means ± SEM, *P < 0.05.
Fig. 2.
Transcriptome analysis reveals that muscle mitochondrial perturbation enhances TGF-β signaling in the fat body. (A) Gene expression changes in dMef2 > ND-75-i larval fat bodies, compared with dMef2 > w-i. (B) Gene set enrichment analysis indicates that genes involved in metabolic processes are significantly enriched among up and/or down-regulated genes (colors indicate enrichment P values). (C) Expression changes of genes encoding mitochondrial complex components (colors indicate log2 ratio of dMef2 > ND75-i versus dMef2 > w-i. Lines indicate potential protein interactions). (D) Expression changes of genes encoding regulators of β-oxidation process (heat map indicates log2 fold-change of gene expression). (E) Schematic of hormone/ligand-induced muscle-to-fat-body communication. Muscle secretes hormone(s) or ligand(s) to target fat body and affects signaling downstream gene expression. (F) Heat map illustrating the expression changes of target genes of the TGF-β signaling pathway in larval fat bodies. (G) Representative confocal images of p-MAD in third instar larval fat body cells (red, p-MAD; blue, DAPI). (H) Western blots of p-dSMAD2 in larval fat bodies.
Hormone/ligand-induced signaling is essential for interorgan communication. We next sought to characterize the mechanism by which muscle mitochondrial perturbation remotely impairs fat body function. We hypothesized that mitochondrial-injured muscles produce ligands that regulate biological processes in the fat body (Fig. 2E). Because ligands classically trigger intracellular signaling pathways that regulate transcriptional factor-dependent gene expression, monitoring target gene expression should help identify the signaling pathway(s) involved (Fig. 2E). Strikingly, most of the TGF-β signaling pathway target genes (11–13) were significantly up-regulated in the dMef2 > ND-75-i larval fat body (Fig. 2F), indicating that TGF-β signaling was potently increased. Consistent with this indication, immunostaining and immunoblotting revealed that levels of the two major readouts of TGF-β signaling, p-Mad and p-dSmad2, were significantly elevated in the dMef2 > ND-75-i larval fat body (Fig. 2 G and H). We previously found that midgut-induced activation of TGF-β signaling in the fat body leads to metabolic dysregulation (14). Based on this idea, we speculated that nonautonomous activation of TGF-β signaling also participates in muscle-to-fat body communication.
Muscle Mitochondrial Perturbation Remotely Affects Mitochondrial Function in the Fat Body Function via Production of Actβ.
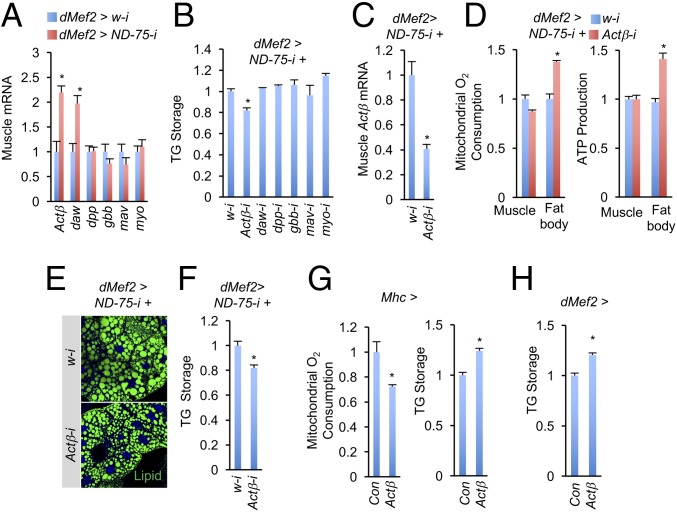
To test whether enhanced TGF-β signaling in the fat body is a response to TGF-β family ligand(s) produced by the muscle, we performed quantitative PCR (qPCR) analysis to examine the expression of Drosophila TGF-β ligands in complex I-perturbed muscle. There are seven TGF-β ligand-encoding genes in the Drosophila genome: four members of the TGF-β/Activin subgroup, namely Actβ, dawdle (daw), maverick (mav), and myoglianin (myo), and three members of the TGF-β/BMP subgroup, namely decapentaplegic (dpp), glass bottom boat (gbb), and screw (scw) (15). The ligands encoded by these genes bind to receptor complexes composed of type I and type II receptors. We found that whereas levels for most ligand-encoding genes were unaffected, mRNA levels for Actβ and daw were dramatically increased in complex I-perturbed muscles (Fig. 3A and Fig. S3B). Note that scw was not included in the analysis because it is not expressed in larvae or adults. We next tested the putative roles of the ligands in muscle-to-fat-body communication by performing RNAi knockdown of each ligand in dMef2 > ND-75-i muscle. Surprisingly, only Actβ knockdown dramatically alleviated TG accumulation in whole animals (Fig. 3 B and C), an event that correlates with mitochondrial perturbation in the muscle.
Fig. 3.
Actβ mediates nonautonomous regulation of mitochondrial dysfunction between muscle and fat body. (A) Relative mRNA levels of TGF-β family ligands in third instar larval muscle (n = 3, 10 pooled tissues per replicate). Note that scw is not expressed in larva or adult. (B) Whole body TG level in third instar larvae. UAS-RNAi lines were crossed to UAS-ND-75-i, tub-Gal80; dMef2-Gal4, and the progenies were grown at 29 °C until third instar stage (n = 3, 5 pooled larvae per replicate). (C–F) Muscle Actβ mRNA levels (C, n = 3, 10 pooled tissues per replicate), ADP-induced mitochondrial O2 consumption rates (D, Left, n = 3, 20 pooled tissues per replicate) and ATP level (D, Right, n = 3, 5 pooled tissues per replicate), and staining of neutral lipids (E) and TG level in the fat body (F, n = 3, 5 pooled tissues per replicate) of dMef2 > ND-75-i+Actβ-i third instar larvae. Genotypes are as in B. (G) Mitochondrial O2 consumption rates (Left, n = 3, 20 pooled fat bodies per replicate) and TG levels (Right, n = 3, 5 pooled fat bodies per replicate) in the fat bodies of Mhc > Con (Mhc-Gal4/+) and Mhc > Actβ (UAS-Actβ/+; Mhc-Gal4/+) third instar larvae. (H) Fat body TG levels (I, n = 3, 5 pooled fat bodies per replicate) in dMef2 > Con (dMef2-Gal4/+) and dMef2 > Actβ (UAS-Actβ/+; dMef2-Gal4/+) third instar larvae. Data are presented as means ± SEM, *P < 0.05.
We next asked whether removal of Actβ in complex I-perturbed muscle could alleviate mitochondrial dysfunction in the muscle or fat body. Interestingly, the ADP-induced O2 consumption rate in isolated mitochondria from dMef2 > ND-75-i+ Actβ-i larval fat bodies, but not muscles, was restored by Actβ knockdown, compared with dMef2 > ND-75-i+w-i (Fig. 3D, Left). dMef2 > ND-75-i+Actβ-i larvae also exhibited higher ATP production in the fat body, but not in muscles (Fig. 3D, Right). We also examined lipid metabolism and found that fewer neutral lipid droplets accumulated and less TG is stored in the dMef2 > ND-75-i+Actβ-i fat body compared with dMef2 > ND-75-i+w-i (Fig. 3 E and F). Altogether, our results indicate that production of TGF-β ligand Actβ is required for complex I-perturbed muscle to remotely cause mitochondrial dysfunction and lipid imbalance in the fat body.
We further investigated whether increased Actβ expression in wild-type muscle is sufficient to impair mitochondrial function and lipid homeostasis in the fat body. We overexpressed Actβ in wild-type larval muscle by using Mhc-Gal4, a driver that induces exogenous expression in the late larval stage. Consistent with our expectation, forced expression of Actβ in the larval muscle significantly lowered ADP-induced O2 consumption rate from isolated mitochondria and increased lipid storage in the fat body (Fig. 3G). Similar results were also obtained by using dMef2-Gal4 (Fig. 3H). Taken together, our gain- and loss-of-function results demonstrate that Actβ is essential for muscle-to-fat-body communication in the context of mitochondrial complex I perturbation.
The ROS/NF-κB Cascade Autonomously Regulates Actβ Expression in Mitochondria-Perturbed Muscle.
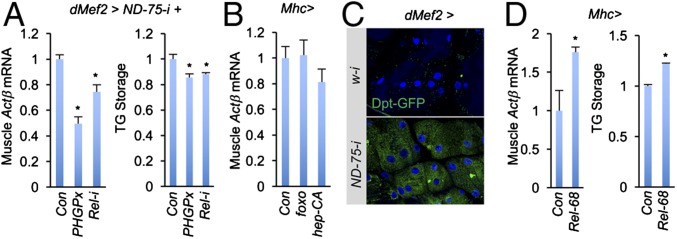
We next analyzed how Actβ is induced in mitochondria-perturbed muscle. Perturbation of the mitochondrial complex I has been shown to robustly increase intracellular production of ROS (reactive oxygen species) signaling molecules and to activate various downstream kinase/transcriptional factor signaling pathways (16–18). We have also shown that complex I perturbation in the larval muscle triggers ROS production and activates transcription factors like FoxO, JNK, and NF-κB/Rel (8). Thus, we hypothesized that mitochondrial perturbation might induce Actβ expression in larval muscles via ROS production and tested the effect of decreasing ROS levels in complex I-perturbed muscles (8). Strikingly, overexpression of a ROS-eliminating enzyme PHGPx (8) significantly down-regulated Actβ levels in larval muscles and TG storage in the fat body (Fig. 4A), indicating that mitochondrial-stressed muscle induces Actβ expression via ROS generation.
Fig. 4.
ROS/NF-κB signaling regulates Actβ expression in complex I-perturbed muscle. (A) Muscle Actβ mRNA levels (Left, n = 3, 10 pooled tissues per replicate) and fat body TG levels (Right, n = 3, 5 pooled tissues per replicate) in indicated third instar larvae. Control or UAS lines were crossed to UAS-ND-75-i, tub-Gal80; dMef2-Gal4, and the progenies were grown at 29 °C until third instar stage. (B) Muscle Actβ mRNA levels in Mhc > foxo (UAS-foxo/+; Mhc-Gal4/+) and Mhc > hep (Mhc-Gal4/UAS-hep-CA) larvae (n = 3, 10 pooled tissues per replicate). (C) Representative images of Relish reporter expression (Dpt-GFP) in larval muscle cells. (D) Muscle Actβ mRNA levels (Left, n = 3, 10 pooled tissues per replicate) and fat body TG levels (Right, n = 3, 5 pooled tissues per replicate) in Mhc > Rel-68 (UAS-Rel-68/+; Mhc-Gal4/+) third instar larvae. Data are presented as means ± SEM, *P < 0.05.
Several signaling pathways are known to act downstream of ROS, including FoxO, JNK, and NF-κB/Rel (8). To explore which of these factors contribute to Actβ induction, we overexpressed the relevant kinases or transcriptional factors in wild-type larval muscles. Interestingly, whereas overexpression of foxO or hep-CA, an active form of Hep, failed to affect Actβ expression (Fig. 4B), overexpression of Rel-68, an active form of Rel, in wild-type muscle significantly elevated Actβ expression and remotely increased the level of TG storage in the fat body (Fig. 4D), suggesting that NF-κB/Rel signaling promotes Actβ production. We also confirmed activation of NF-κB/Rel signaling in complex I-perturbed muscle by using a Diptericin-GFP (Dpt-GFP) reporter (14, 19) (Fig. 4C). Further, we suppressed NF-κB/Rel signaling by knocking down Rel expression in complex I-perturbed muscles and found that both muscle Actβ induction and fat body TG accumulation were at least partially alleviated (Fig. 4A). Collectively, these results strongly suggest that complex I perturbation autonomously activates a ROS-induced NF-κB signaling cascade that induces Actβ expression in the larval muscle.
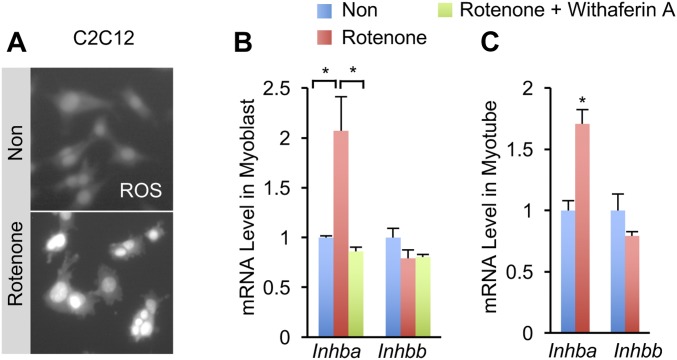
TGF-β/Activin signaling is evolutionarily conserved. For example, activin A is the homolog of Drosophila Actβ and is an important regulator of lipid metabolism and mitochondrial activity (14, 20). To ask whether functional conservation extends to ROS-induced Activin production in mammals, we treated C2C12 myoblasts with rotenone, a well-established complex I inhibitor (21), which resulted in rapid and robust ROS elevation as indicated by CellROX, a dye that specifically detects ROS (Fig. S4A). In addition, rotenone also induced mRNA expression of Inhba, a gene that encodes a subunit of activin A, but not Inhbb, in myoblasts by about two folds (Fig. S4B, Left). Similar results were also obtained in differentiated C2C12 myotubes (Fig. S4B, Right). Because intracellular ROS has been extensively shown to activate NF-κB signaling in muscle cells (16), we wondered whether NF-κB signaling is required for rotenone-induced up-regulation of Inhba. To address this question, we blocked NF-κB signaling by adding Withaferin A, a natural NF-κB inhibitor (22), before rotenone treatment of C2C12 myoblasts and observed that the induction of Inhba in myoblasts was abolished (Fig. S4B, Left). Thus, our data indicate that complex I perturbation autonomously induces activin mRNA expression in mammalian muscle cells in a conserved manner.
Fig. S4.
Mitochondrial complex I perturbation induces Inhba expression via NF-κB activity in C2C12 muscle cells. (A) Representative images of ROS levels in C2C12 myoblasts with or without 100 nM Rotenone treatment for 1 h. (B and C) Relative mRNA levels of Inhba and Inhbb in C2C12 myoblasts (B) and myotubes (C) stimulated or not by 100 nM Withaferin A for 3 h before 100 nM Rotenone treatment for 1 h (n = 3). Data are presented as means ± SEM, *P < 0.05.
The TGF-β Type I Receptor Baboon Regulates Mitochondrial Function and Lipid Homeostasis in the Fat Body.
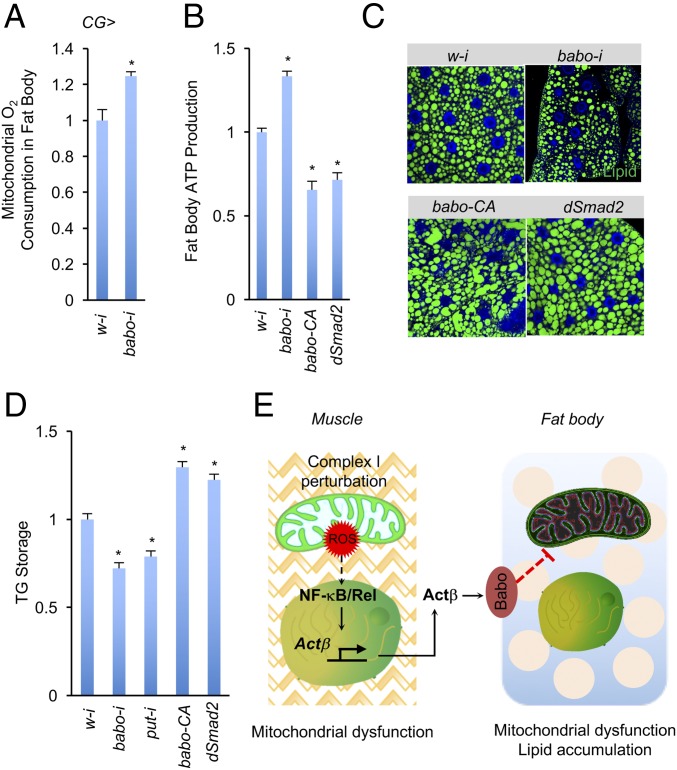
In Drosophila, TGF-β ligands bind to either of two type II receptors, Punt (Put) and Wishful thinking (Wit), and to one of three different type I receptors, to activate distinct downstream signaling events (15). For example, the TGF-β/Activin ligands Actβ and Daw target the type I receptor Baboon (Babo) and activate the downstream transcriptional factor dSmad2, whereas the TGF-β/BMP ligands Dpp, Gbb, and Scw target the type I receptors Saxophone (Sax) and Thickveins (Tkv) and activate Mad (15). To test whether Actβ-associated Babo signaling autonomously regulates lipid metabolism in the fat body, we knocked down fat body babo mRNA levels by using the CG-Gal4 driver. Knockdown of babo robustly enhanced the ADP-induced O2 consumption rate of isolated mitochondria and ATP production in the CG > babo-i fat bodies (Fig. 5 A and B). Conversely, activation of Babo signaling via overexpression in the fat body of babo-CA, an active form of Babo, or of dSmad2, significantly decreased ATP production (Fig. 5B). These data suggest that, consistent with muscle Actβ production, Babo signaling in the fat body autonomously regulates mitochondrial function. Finally, we examined lipid metabolism in the fat body. Decreasing Babo signaling by knocking down babo or put significantly reduced both lipid droplet mass and TG storage in the fat body, whereas activation of Babo signaling by overexpressing babo-CA or dSmad2 increased both lipid droplet mass and TG storage in the fat body (Fig. 5 C and D). Taken together, our results indicate that Babo signaling in the fat body autonomously regulates mitochondrial function and lipid metabolism.
Fig. 5.
Babo signaling regulates mitochondrial activity in the fat body. Mitochondrial O2 consumption rates (n = 3, 20 pooled fat bodies per replicate) (A), ATP levels (n = 3, 5 pooled fat bodies per replicate) (B), staining of neutral lipids (C), and TG levels (D) (n = 3, 5 pooled fat bodies per replicate) in the fat body CG > w-i (UAS-w-i/+, CG-Gal4/+), CG > babo-i (UAS-babo-i/+, CG-Gal4/+), CG > put-i (UAS-put-i/+, CG-Gal4/+), CG > babo-CA (CG-Gal4/UAS-babo-CA), or CG > dSmad2 (CG-Gal4/UAS-dSmad2) third instar larvae. (E) Muscle-to-fat-body communication in regulation of mitochondrial synchrony. Complex I-perturbed larval muscle increases Actβ production via ROS/NF-κB cascade. Muscle-derived Actβ further triggers Babo signaling in the fat body to decrease its mitochondrial activity and increase TG storage. Data are presented as means ± SEM, *P < 0.05.
Discussion
Mitochondria, which are semiautonomous organelles essential for the cellular energy supply, have been shown to integrate metabolic signals and regulate systemic physiology, including aging and energy homeostasis, in both an autonomous and a nonautonomous manner (5, 6, 8). Using Drosophila as a model, we demonstrate that impairment of mitochondrial function via complex I perturbation specifically in the muscle remotely impairs mitochondrial function in another metabolic tissue, the fat body, and causes an obesity phenotype. Using RNA-seq and genetic validation, we further found that complex I-perturbed muscles produce the TGF-β ligand Actβ, which then targets the fat body, affecting mitochondrial function and lipid mobilization in that tissue. The results of our study suggest the possibility of synchronized regulation of mitochondrial activity in distinct organs or tissues.
Evidence that supports this idea of “mitochondrial synchrony” has been reported in mammals. For example, a few myokines are secreted by muscles following exercise to enhance mitochondrial activity in adipose tissue (5, 23). Whether impaired mitochondrial activity in muscles is associated with simultaneous decreased mitochondrial function in other tissues is largely unknown. Here, we characterized Actβ as a myokine involved in mitochondrial synchrony in a mitochondrial dysfunction model.
In addition to acting as a neuropeptide expressed in central or peripheral nerves (24, 25), Actβ also acts as an endocrine peptide derived from enteroendocrine cells to target the fat body via the Babo receptor (14). Actβ is expressed at low levels in wild-type muscle (14); however, we observed a significant induction of Actβ expression when complex I was perturbed in muscle cells, suggesting that mitochondrial injury can turn on Actβ expression in the muscle to subsequently regulate fat body function. Actβ/Babo signaling has been shown to enhance the response to Akh in the larval fat body (14). Consistent with this finding, our RNA-seq data revealed that AkhR expression levels are increased by approximately two folds in the fat body of dMef2 > ND-75 larvae (Dataset S2), an event associated with elevated Actβ production in larval muscles. Akh has been shown to regulate lipid mobilization in the fat body (26). Thus, our observation that Actβ/Babo signaling causes lipid accumulation suggests that Actβ/Babo signaling might impair mitochondria-associated lipid mobilization to overcome the lipolytic effect of Akh. In support of this idea, there is evidence from mammals that activin/TGF-β impairs mitochondrial function and lipid homeostasis via multiple mechanisms (27).
In addition to Actβ, another activin ligand Daw also targets Babo/dSmad2 and regulates systemic carbohydrate metabolism and the aging process, probably via modulation of dILP2 secretion (28, 29). Although Daw is expressed in the muscle, we do not believe that Daw is involved in mitochondrial synchrony between muscle and fat body because Daw knockdown in complex I-perturbed muscles fails to restore normal levels of TG storage. However, Daw is expressed in other tissues beyond muscle, and we cannot rule out the possibility that Daw acts as a secondary hormone to activate Babo signaling in the fat body.
The results of our studies also uncovered that in both fly and mouse muscle cells, complex I disruption increases ROS generation, activating NF-κB/Rel and inducing Activin/Actβ expression. These findings are further supported by the previous observation that NF-κB activity is required to up-regulate Inhba/Activin in human myoblasts (30). Inhba encodes a β-subunit (βA) of disulfide-linked dimeric inhibin/activin, including inhibin A (αβA), activin A (βAβA), and activin AB (βAβB). Inhibin moderately inhibits activin signaling via receptor-binding competition (31). Compared with relatively less-understood activin AB, activin A has been well established as a metabolic regulator of lipid homeostasis and mitochondrial activity. Importantly, levels of activin A, which promote proliferation of human adipocyte progenitors, are significantly elevated in obese patients compared with lean subjects (32, 33). Genetic disruption of Inhba, achieved by replacing the mature domain of Inhba with that of Inhbb, results in significantly diminished activin A production and enhanced mitochondrial function in mouse adipose tissues, leading to lipid loss (20). Because Actβ/Activin exhibits conserved features in metabolic regulation in both flies and mammals (14, 34), our characterization of a mitochondria-ROS-Rel-Actβ axis in Drosophila should help further investigation of nonautonomous mitochondrial regulation between muscle and adipose tissues in mammalian animal models.
Experimental Procedures
Drosophila Strains and Cell Culture.
RNAi and overexpression fly stocks were obtained from the Transgenic RNAi Project (TRiP), National Institute of Genetics at Japan (NIG), and Bloomington Stock Center. See SI Experimental Procedures for more details.
Mitochondrial O2 Consumption and ATP Measurement.
Mitochondria Isolation Kit for Tissue (Abcam; ab110168), Extracellular Oxygen Consumption Reagent (Abcam, ab197242), and ATP Determination Kit (Thermo Fisher, A22066) were used. See SI Experimental Procedures for more details.
Quantitative Lipidomic Analysis and Triglyceride Measurement.
Lipids from third instar larval fat bodies were extracted and submitted for spectrophotometric analysis at the Beth Israel Deaconess Medical Center (BIDMC) Mass Spectrometry Facility (www.bidmcmassspec.org). TG measurement was performed as described (35, 36). See SI Experimental Procedures for more details.
RNA-seq Transcriptome Analysis, Bioinformatics Analysis, and qPCR.
Total RNA from larval fat body was extracted by using TriZol reagent and used for RNA-seq analysis at the Columbia Genome Center as described (37). RNA-seq data were deposited in the Gene Expression Omnibus (GEO, GSE100214). Gene expression indicated by qPCR was normalized to internal control RpL32 (Drosophila) or Actin-β (Actb, mouse). See SI Experimental Procedures for more details.
Statistical Analyses.
Data are presented as the mean ± SEM. Student’s t test was used to compare two groups. EASE Score (38) was used for evaluating the gene enrichment. P < 0.05 was considered statistically significant.
SI Experimental Procedures
Drosophila Strains and Cell Culture.
Late third instar larvae (12 h before wandering) grown in normal food at 25 °C with density control in a mixture of both male and female were used in this study. RNAi lines against w (JF01545), ND-75 (JF02791), ND-49 (HM05059), ND-42 (HMS05104), Actβ (JF03276), daw (HMS01110), dpp (JF02455), gbb (HMS01243), mav (HMS01125), myo (JF01587), Rel (HMS00070), babo (JF01953), put (HMS01944), cyt-c1 (HMS01057), COX5A(JF02700), cype (HMS00815), ATPsynβ (JF02892), blw (JF02896), CG12262 (HMS00434), Thiolase (HMS01017), and Mtpα (HMS00660) were obtained from the TRiP at Harvard Medical School (https://fgr.hms.harvard.edu/fly-in-vivo-rnai), and ImpL2 (15009R-3) were obtained from National Institute of Genetics at Japan (https://shigen.nig.ac.jp/fly/nigfly/). UAS-Actβ, UAS-PHGPx, UAS-foxo, UAS-hep-CA, and UAS-babo-CA have been described (1, 2) and UAS-Rel-68 (BLM 55778) was obtained from Bloomington Stock Center. CG-Gal4, dMef2-Gal4, Mhc-Gal4, w1118, Dpt-GFP, and Tub-Gal80, UAS-ND-75-RNAi; dMef2-Gal4 have been described (1, 2). To knockdown TGF-β family ligands or transcriptional factors in ND-75-deficient muscles, UAS-RNAi lines were crossed to Tub-Gal80, UAS-ND-75-RNAi; dMef2-Gal4 for 24 h at 18 °C to inactivate Gal4. Progenies were grown at 29 °C until the third instar stage (12 h before wandering). Because Mhc-Gal4 is expressed after the second instar larval stage, it was used in most overexpression experiments to avoid potential developmental problems.
Mouse myoblasts C2C12 were purchased from American Type Culture Collection. C2C12 myoblasts (<15 passages) were cultured in DMEM with 10% FBS and antibiotics and differentiated into myotubes in DMEM containing 2% horse serum and antibiotics (Thermo Fisher Scientific) for 5 d at 37 °C in 5% CO2.
Fluorescence Staining, Microscopy, and Western Blot.
Third instar larval fat bodies or muscles were dissected in PBS and fixed for 15 min in PBS containing 4% formaldehyde. After fixation, the tissues were washed with PBS containing 0.2% Triton X-100 and incubated in primary antibodies overnight at 4 °C. Secondary antibodies together with DAPI (1:1,000, Invitrogen) were used to incubate tissues for 1 h at room temperature. Tissues were washed and mounted in Vectashield (Vector). Rabbit anti-human-p-SMAD3 (1:1,000, Epitomics, 1880-1) antibody for detection of Drosophila p-MAD and mouse anti-ATP5A (1:1,000, Mitosciences, MS507) for mitochondria detection were used. Bodipy 493/503 (1 μg/mL, Invitrogen) was used for neutral lipid staining for 30 min at room temperature. C2C12 myoblasts were treated with 100 nM Rotenone (Sigma, R8875) for 1 h and incubated with CellROX Green Reagent (1:1,000, Thermo Fisher, C10444) for 30 min to detect ROS generation. Fluorescent microscopy was performed on a Zeiss Axioskop 2motplus upright, and confocal images were obtained by using a Leica TCS SP2 AOBS system. Ten larval fat bodies and muscles were homogenized with buffer (50 mM Tris⋅HCl [pH 7.5], 5 mM EDTA, 10 mM Na4P2O7, 100 mM NaF, 1 mM phenylmethylsulfonyl fluoride, 1 mM Na3VO4, 10 μg/mL aprotinin, 10 μg/mL leupeptin, 1% Nonidet P-40). Protein extracts were immunoblotted with indicated antibodies: rabbit anti-p-SMAD2 (S465/467, 1:1,000, Cell Signaling, 3108) for p-dSmad2 detection and mouse anti-Tubulin (1:5,000, Sigma).
Mitochondrial O2 Consumption.
Mitochondria from 20 third instar larval fat bodies or muscles were isolated using Mitochondria Isolation Kit for Tissue (Abcam, ab110168) following manufacturer’s protocol. To avoid physical injury to isolated mitochondria, larval tissues were gently homogenized with disposable pellet pestles (Thermo Fisher, 12-141-364). Freshly isolated mitochondria were resuspended in isolation buffer (mitochondrial concentration > 1 mg/mL) and immediately used for next measurements. Mitochondrial O2 consumption rates with or without ADP were measured in 96-well plate using Extracellular Oxygen Consumption Reagent (Abcam, ab197242).
ATP Measurement.
Five muscles or fat bodies from third instar larvae were homogenized in 100 μL of extraction buffer (6 M Guanidine Chloride, 100 mM Tris⋅HCl pH 8.0, 4 mM EDTA), immediately heated at 70 °C for 5 min, then centrifuged at 18,400 × g for 10 min at 4 °C to remove cuticle and cell debris. The levels of ATP were measured by using ATP Determination Kit (Thermo Fisher, A22066) following the manufacturer’s protocol and were further normalized to protein levels that were measured by using Bradford Reagent (Sigma).
Quantitative Lipidomic Analysis.
Five third instar larval fat bodies in triplicate were freshly isolated and homogenized in 200 μL of PBS. Five-microliter homogenates were used to measure protein content of each sample by using Bradford Reagent (Sigma). For lipid profiling, lipids in the remaining homogenates were extracted by following standard protocol from the BIDMC Mass Spectrometry Facility (www.bidmcmassspec.org) and concentrated completely to dryness using a SpeedVac. Spectrophotometric determination was performed at the BIDMC Mass Spectrometry Facility, and lipid concentrations in the samples were normalized to measured protein content.
Triglyceride Measurement.
Five third instar larval fat bodies or five third instar larvae were homogenized in 500 μL of PBS containing 0.2% Triton X, heated at 70 °C for 5 min, and centrifuged at 18,400 × g for 10 min. Ten microliters of supernatant was used to measure TG by using Serum TG determination kits (Sigma, TR0100-1KT). Protein amounts were measured using Bradford Reagent (Sigma). TG storage was normalized to protein amount.
RNA-seq Transcriptome Analysis.
Ten fat bodies from third instar larvae from dMef2 > ND-75-i and control were collected on ice. Total RNA was extracted by using TriZol reagent, whereas RNA integrity was assessed using Agilent Bioanalyzer (RIN > 6.6). Sequencing libraries were constructed using Illumina Hi-seq kits following standard protocol, and 100-bp, single-end reads were generated at the Columbia Genome Center. Sequence reads were mapped back to the Drosophila genome (flybase genome annotation version r5.51) using Tophat. With the uniquely mapped reads, we quantified gene expression levels by using Cufflinks [fragments per kilobase million (FPKM) values] and HTSeq (read counts per gene). Next, we performed data normalization on the read counts and applied a negative binomial statistical framework using the Bioconductor package “DESeq” to quantify differential expression between experimental and control data. Differentially expressed genes were identified with FDR adjusted P values by using Bioconductor package q value of 0.1.
Bioinformatics Analysis.
Differentially expressed genes were selected if 2 or more-fold changes were consistently observed among the replicates. For genes with less than 2 but greater than 1.5-fold changes, only those with an adjusted P value of 0.01 or better were selected. Hits were assigned a confidence value based on both fold changes and P values. Genes with at least twofold changes and adjusted P values ≥0.05 were assigned high confidence. GO enrichment analysis was performed with all differentially expressed genes (up- and down-regulated) using DAVID Bioinformatics Resources (https://david.ncifcrf.gov), and then visually displayed for selected metabolic terms by using heat map representation of FPKM. To obtain the target gene list of specific signaling pathways, we collected published or available microarray or Next-Generation Sequencing datasets of ligand treatment, gain- or loss-of-function of components, and ChIP assay for transcriptional factors (ChIP-seq or DroID [www.droidb.org]). We set the overlapping genes between at least two datasets as “moderate-confident” target genes for a signaling pathway. Then we searched the genes that have been validated by qPCR, immunostaining, chemical binding, reporter assays, or genetic interaction and set them as “high-confident” target genes. In this study, we only showed “high-confident” target genes for TGF-β signaling.
RT-qPCR.
RNAs from 10 third instar larval fat bodies or muscles or treated C2C12 cells were isolated by using TRIzol (Invitrogen), and cDNA was transcribed by using the iScript cDNA Synthesis Kit (Bio-Rad). qPCR was then performed by using iQ SYBR Green Supermix on a CFX96 Real-Time System/C1000 Thermal Cycler (Bio-Rad). Gene expression was normalized to internal control RpL32 (Drosophila) or Actin-β (Actb, mouse). qPCR primers used are as follows:
Drosophila:
RpL32-F: GCTAAGCTGTCGCACAAATG
RpL32-R: GTTCGATCCGTAACCGATGT
Actβ-F: ACGGCAAATTTTGACAAAGC
Actβ-R: TTGGTATCATTCGTCCACCA
daw-F: ATCCTTCGTCCGCATCCTAAG
daw-R: CGGTTCCAGGTGTTTCAGC
dpp-F: GACCAGCACAGCATTAGCAAA
dpp-R: AACTGTCGGTTCGCGTCAC
gbb-F: CATCGACGAGAGCGACATCA
gbb-R: TAGTTGTCGTTGGGCACGTT
mav-F: AGCATTACCACAAACGGATTCA
mav-R: CTGTTCGCCACGTAGTAGGT
myo-F: ATTCTTCCAACAACGATAGTCCG
myo-R: CCCCGGTTTACTTTGTACTTTCA
Mouse:
Inhba-F: GTAAAGTGGGGGAGAACGGG
Inhba-R: CCTGACTCGGCAAAGGTGAT
Inhbb-F: GGAAGGTACGGGTCAAGGTG
Inhbb-R: ATGGGAAAGGTATGCCAGCC
Actb-F: CGGTTCCGATGCCCTGAGGCTCTT
Actb-R: CGTCACACTTCATGATGGAATTGA
Statistical Analyses.
The data are presented as the mean ± SEM. Student’s t tests were used for comparisons between two groups. EASE Score was used for evaluating the gene enrichment. P < 0.05 was considered statistically significant.
Supplementary Material
Acknowledgments
We thank Drs. Young Kwon, Richelle Sopko, Charles Xu, Stephanie Mohr, and Ilia Droujinine for comments on the manuscript; Dr. Rich Binari for assistance with the fly experiments; Dr. Michael O’Connor for reagents, transgenic fly lines, and helpful discussions; and Dr. Richard W. Padgett for sharing the microarray data of TGF-β signaling target genes. This work was supported by NIH Grants 5P01CA120964 and 5R01DK088718 and American Diabetes Association Grant 1-16-PDF-108. N.P. is an Investigator of the Howard Hughes Medical Institute.
Footnotes
The authors declare no conflict of interest.
Data deposition: The data reported in this paper have been deposited in the Gene Expression Omnibus (GEO) database, https://www.ncbi.nlm.nih.gov/geo (accession no. GSE100214).
This article contains supporting information online at www.pnas.org/lookup/suppl/doi:10.1073/pnas.1708037114/-/DCSupplemental.
References
- 1.Lenard NR, Berthoud HR. Central and peripheral regulation of food intake and physical activity: Pathways and genes. Obesity (Silver Spring) 2008;16:S11–S22. doi: 10.1038/oby.2008.511. [DOI] [PMC free article] [PubMed] [Google Scholar]
- 2.Demontis F, Piccirillo R, Goldberg AL, Perrimon N. The influence of skeletal muscle on systemic aging and lifespan. Aging Cell. 2013;12:943–949. doi: 10.1111/acel.12126. [DOI] [PMC free article] [PubMed] [Google Scholar]
- 3.Droujinine IA, Perrimon N. Interorgan communication pathways in physiology: Focus on Drosophila. Annu Rev Genet. 2016;50:539–570. doi: 10.1146/annurev-genet-121415-122024. [DOI] [PMC free article] [PubMed] [Google Scholar]
- 4.Schnyder S, Handschin C. Skeletal muscle as an endocrine organ: PGC-1alpha, myokines and exercise. Bone. 2015;80:115–125. doi: 10.1016/j.bone.2015.02.008. [DOI] [PMC free article] [PubMed] [Google Scholar]
- 5.Boström P, et al. A PGC1-alpha-dependent myokine that drives brown-fat-like development of white fat and thermogenesis. Nature. 2012;481:463–468. doi: 10.1038/nature10777. [DOI] [PMC free article] [PubMed] [Google Scholar]
- 6.Durieux J, Wolff S, Dillin A. The cell-non-autonomous nature of electron transport chain-mediated longevity. Cell. 2011;144:79–91. doi: 10.1016/j.cell.2010.12.016. [DOI] [PMC free article] [PubMed] [Google Scholar]
- 7.Kim KH, et al. Autophagy deficiency leads to protection from obesity and insulin resistance by inducing Fgf21 as a mitokine. Nat Med. 2013;19:83–92. doi: 10.1038/nm.3014. [DOI] [PubMed] [Google Scholar]
- 8.Owusu-Ansah E, Song W, Perrimon N. Muscle mitohormesis promotes longevity via systemic repression of insulin signaling. Cell. 2013;155:699–712. doi: 10.1016/j.cell.2013.09.021. [DOI] [PMC free article] [PubMed] [Google Scholar]
- 9.Vamecq J, et al. Mitochondrial dysfunction and lipid homeostasis. Curr Drug Metab. 2012;13:1388–1400. doi: 10.2174/138920012803762792. [DOI] [PubMed] [Google Scholar]
- 10.Kishita Y, Tsuda M, Aigaki T. Impaired fatty acid oxidation in a Drosophila model of mitochondrial trifunctional protein (MTP) deficiency. Biochem Biophys Res Commun. 2012;419:344–349. doi: 10.1016/j.bbrc.2012.02.026. [DOI] [PubMed] [Google Scholar]
- 11.Yang M, Nelson D, Funakoshi Y, Padgett RW. Genome-wide microarray analysis of TGFbeta signaling in the Drosophila brain. BMC Dev Biol. 2004;4:14. doi: 10.1186/1471-213X-4-14. [DOI] [PMC free article] [PubMed] [Google Scholar]
- 12.Hamaratoglu F, de Lachapelle AM, Pyrowolakis G, Bergmann S, Affolter M. Dpp signaling activity requires Pentagone to scale with tissue size in the growing Drosophila wing imaginal disc. PLoS Biol. 2011;9:e1001182. doi: 10.1371/journal.pbio.1001182. [DOI] [PMC free article] [PubMed] [Google Scholar]
- 13.Gibbens YY, Warren JT, Gilbert LI, O’Connor MB. Neuroendocrine regulation of Drosophila metamorphosis requires TGFbeta/Activin signaling. Development. 2011;138:2693–2703. doi: 10.1242/dev.063412. [DOI] [PMC free article] [PubMed] [Google Scholar]
- 14.Song W, et al. Midgut-derived activin regulates glucagon-like action in the fat body and glycemic control. Cell Metab. 2017;25:386–399. doi: 10.1016/j.cmet.2017.01.002. [DOI] [PMC free article] [PubMed] [Google Scholar]
- 15.Gesualdi SC, Haerry TE. Distinct signaling of Drosophila Activin/TGF-beta family members. Fly (Austin) 2007;1:212–221. doi: 10.4161/fly.5116. [DOI] [PubMed] [Google Scholar]
- 16.Dodd SL, Gagnon BJ, Senf SM, Hain BA, Judge AR. Ros-mediated activation of NF-kappaB and Foxo during muscle disuse. Muscle Nerve. 2010;41:110–113. doi: 10.1002/mus.21526. [DOI] [PMC free article] [PubMed] [Google Scholar]
- 17.Santabárbara-Ruiz P, et al. ROS-induced JNK and p38 signaling is required for unpaired cytokine activation during Drosophila regeneration. PLoS Genet. 2015;11:e1005595. doi: 10.1371/journal.pgen.1005595. [DOI] [PMC free article] [PubMed] [Google Scholar]
- 18.Murphy MP. How mitochondria produce reactive oxygen species. Biochem J. 2009;417:1–13. doi: 10.1042/BJ20081386. [DOI] [PMC free article] [PubMed] [Google Scholar]
- 19.Vodovar N, et al. Drosophila host defense after oral infection by an entomopathogenic Pseudomonas species. Proc Natl Acad Sci USA. 2005;102:11414–11419. doi: 10.1073/pnas.0502240102. [DOI] [PMC free article] [PubMed] [Google Scholar]
- 20.Li L, et al. Activin signaling: Effects on body composition and mitochondrial energy metabolism. Endocrinology. 2009;150:3521–3529. doi: 10.1210/en.2008-0922. [DOI] [PMC free article] [PubMed] [Google Scholar]
- 21.Li N, et al. Mitochondrial complex I inhibitor rotenone induces apoptosis through enhancing mitochondrial reactive oxygen species production. J Biol Chem. 2003;278:8516–8525. doi: 10.1074/jbc.M210432200. [DOI] [PubMed] [Google Scholar]
- 22.Maitra R, Porter MA, Huang S, Gilmour BP. Inhibition of NFkappaB by the natural product Withaferin A in cellular models of Cystic Fibrosis inflammation. J Inflamm (Lond) 2009;6:15. doi: 10.1186/1476-9255-6-15. [DOI] [PMC free article] [PubMed] [Google Scholar]
- 23.Kim KH, et al. Acute exercise induces FGF21 expression in mice and in healthy humans. PLoS One. 2013;8:e63517. doi: 10.1371/journal.pone.0063517. [DOI] [PMC free article] [PubMed] [Google Scholar]
- 24.Ting CY, et al. Tiling of r7 axons in the Drosophila visual system is mediated both by transduction of an activin signal to the nucleus and by mutual repulsion. Neuron. 2007;56:793–806. doi: 10.1016/j.neuron.2007.09.033. [DOI] [PMC free article] [PubMed] [Google Scholar]
- 25.Kim MJ, O’Connor MB. Anterograde Activin signaling regulates postsynaptic membrane potential and GluRIIA/B abundance at the Drosophila neuromuscular junction. PLoS One. 2014;9:e107443. doi: 10.1371/journal.pone.0107443. [DOI] [PMC free article] [PubMed] [Google Scholar]
- 26.Grönke S, et al. Dual lipolytic control of body fat storage and mobilization in Drosophila. PLoS Biol. 2007;5:e137. doi: 10.1371/journal.pbio.0050137. [DOI] [PMC free article] [PubMed] [Google Scholar]
- 27.Casalena G, Daehn I, Bottinger E. Transforming growth factor-beta, bioenergetics, and mitochondria in renal disease. Semin Nephrol. 2012;32:295–303. doi: 10.1016/j.semnephrol.2012.04.009. [DOI] [PMC free article] [PubMed] [Google Scholar]
- 28.Bai H, Kang P, Hernandez AM, Tatar M. Activin signaling targeted by insulin/dFOXO regulates aging and muscle proteostasis in Drosophila. PLoS Genet. 2013;9:e1003941. doi: 10.1371/journal.pgen.1003941. [DOI] [PMC free article] [PubMed] [Google Scholar]
- 29.Ghosh AC, O’Connor MB. Systemic Activin signaling independently regulates sugar homeostasis, cellular metabolism, and pH balance in Drosophila melanogaster. Proc Natl Acad Sci USA. 2014;111:5729–5734. doi: 10.1073/pnas.1319116111. [DOI] [PMC free article] [PubMed] [Google Scholar]
- 30.Trendelenburg AU, Meyer A, Jacobi C, Feige JN, Glass DJ. TAK-1/p38/nNFkappaB signaling inhibits myoblast differentiation by increasing levels of Activin A. Skelet Muscle. 2012;2:3. doi: 10.1186/2044-5040-2-3. [DOI] [PMC free article] [PubMed] [Google Scholar]
- 31.Massagué J, Gomis RR. The logic of TGFbeta signaling. FEBS Lett. 2006;580:2811–2820. doi: 10.1016/j.febslet.2006.04.033. [DOI] [PubMed] [Google Scholar]
- 32.Dani C. Activins in adipogenesis and obesity. Int J Obes (Lond) 2013;37:163–166. doi: 10.1038/ijo.2012.28. [DOI] [PubMed] [Google Scholar]
- 33.Zaragosi LE, et al. Activin a plays a critical role in proliferation and differentiation of human adipose progenitors. Diabetes. 2010;59:2513–2521. doi: 10.2337/db10-0013. [DOI] [PMC free article] [PubMed] [Google Scholar]
- 34.Ueland T, et al. Activin A and cardiovascular disease in type 2 diabetes mellitus. Diab Vasc Dis Res. 2012;9:234–237. doi: 10.1177/1479164111431171. [DOI] [PubMed] [Google Scholar]
- 35.Song W, et al. SH2B regulation of growth, metabolism, and longevity in both insects and mammals. Cell Metab. 2010;11:427–437. doi: 10.1016/j.cmet.2010.04.002. [DOI] [PMC free article] [PubMed] [Google Scholar]
- 36.Song W, Veenstra JA, Perrimon N. Control of lipid metabolism by tachykinin in Drosophila. Cell Reports. 2014;9:40–47. doi: 10.1016/j.celrep.2014.08.060. [DOI] [PMC free article] [PubMed] [Google Scholar]
- 37.Kwon Y, et al. Systemic organ wasting induced by localized expression of the secreted insulin/IGF antagonist ImpL2. Dev Cell. 2015;33:36–46. doi: 10.1016/j.devcel.2015.02.012. [DOI] [PMC free article] [PubMed] [Google Scholar]
- 38.Hosack DA, Dennis G, Jr, Sherman BT, Lane HC, Lempicki RA. Identifying biological themes within lists of genes with EASE. Genome Biol. 2003;4:R70. doi: 10.1186/gb-2003-4-10-r70. [DOI] [PMC free article] [PubMed] [Google Scholar]
Associated Data
This section collects any data citations, data availability statements, or supplementary materials included in this article.


