

Significance
The accumulation of amyloid-β (Aβ) proteins in the brain contributes to Alzheimer´s disease (AD). Reducing Aβ by inhibiting its production with a β-secretase (BACE) inhibitor represents a novel mechanism for treating AD; however, whether this therapeutic strategy is capable of repairing impaired brain circuits associated with AD is unknown. Here we demonstrate that BACE inhibition is beneficial to all levels of impairment in an AD mouse model: cellular, long-range circuitry, and memory. We provide evidence that the rescue is dependent on the reduction of soluble forms of Aβ surrounding amyloid plaques. These results have mechanistic and therapeutic implications for AD, including Aβ-related memory defects.
Keywords: Alzheimer’s disease, amyloid-β, BACE inhibition, in vivo calcium imaging, neural circuit dysfunction
Abstract
Amyloid-β (Aβ) is thought to play an essential pathogenic role in Alzheimer´s disease (AD). A key enzyme involved in the generation of Aβ is the β-secretase BACE, for which powerful inhibitors have been developed and are currently in use in human clinical trials. However, although BACE inhibition can reduce cerebral Aβ levels, whether it also can ameliorate neural circuit and memory impairments remains unclear. Using histochemistry, in vivo Ca2+ imaging, and behavioral analyses in a mouse model of AD, we demonstrate that along with reducing prefibrillary Aβ surrounding plaques, the inhibition of BACE activity can rescue neuronal hyperactivity, impaired long-range circuit function, and memory defects. The functional neuronal impairments reappeared after infusion of soluble Aβ, mechanistically linking Aβ pathology to neuronal and cognitive dysfunction. These data highlight the potential benefits of BACE inhibition for the effective treatment of a wide range of AD-like pathophysiological and cognitive impairments.
Alzheimer´s disease (AD) is the most common cause of dementia globally, with an increasing impact on aging societies (1). Therefore, the prevention and treatment of AD is a major unmet medical need. The amyloid hypothesis posits that the abnormal accumulation of amyloid-β (Aβ) peptides in the brain, and their aggregation, is an essential feature of AD (2, 3); however, results from clinical studies using several Aβ-targeting compounds have called into question the existence of a direct link between a reduction in Aβ and improvement of brain function, particularly in more advanced disease stages (4–6). In addition, recent evidence obtained in mouse models carrying genetic mutations that cause AD in humans revealed that immunotherapy with antibodies against Aβ worsened rather than reversed neuronal dysfunction (7). Despite reducing plaque burden, the anti-Aβ antibodies caused a massive increase in cortical hyperactivity and promoted abnormal synchrony of neurons in a subset of the treated mice. In this context, it is noteworthy that another recent mouse study found an increased risk of sudden death after anti-Aβ antibody treatment, which was attributed to enhanced excitatory neuronal activity culminating in fatal convulsive seizures (8).
To clarify the causal relationship between Aβ and pathophysiology in vivo, we made use of a novel compound that reduces Aβ by inhibiting the β-secretase BACE, the rate-limiting enzyme for Aβ production (9). This approach allowed us to determine how the inhibition of Aβ production affects neural circuit and memory impairments in APP23xPS45 transgenic mice overexpressing mutant human amyloid precursor protein (APP) and presenilin 1 (PS1). The combination of histochemistry, in vivo Ca2+ imaging, and behavioral analysis allowed us to directly link the treatment-related changes in brain Aβ levels to changes in neuronal and cognitive functions in individual mice.
Results
In this study, we used 6- to 8-mo-old APP23xPS45 transgenic mice that exhibit severe cerebral Aβ pathology, neuritic and glial cytopathology, and learning and memory deficits (10, 11). In accordance with a previous protocol (9), we treated the plaque-bearing mice for 6–8 wk with food pellets containing the BACE inhibitor NB-360 (0.25 mg/g of food, corresponding to a daily oral dose of 20 µmol/kg) or control pellets without the inhibitor. NB-360 inhibits the enzymatic activity of BACE, which is required for the generation of Aβ peptides from APP (12). Indeed, quantification of Aβ revealed a substantial reduction of the Aβ plaque burden (Fig. 1 A and B) as well as both insoluble [formic acid (FA)-extracted] and soluble (Triton-X–extracted) Aβ 1–40 and Aβ 1–42 levels (Fig. 1 C–F) after treatment with NB-360. This result confirms and extends previous experimental and clinical studies showing significant lowering of brain Aβ levels by BACE inhibitor treatment (9, 13).
Fig. 1.

BACE inhibition effectively reduces Aβ in APP23xPS45 mice with advanced cerebral Aβ pathology. (A) Representative coronal thioflavin-S–stained sections through the frontal cortex of untreated (control) and NB-360–treated APP23xPS45 mice. (B) Quantitative analysis of Aβ plaque burden in the frontal cortex of untreated (red bar; n = 10) and treated (green bar; n = 15) APP23xPS45 mice. The difference between both groups is highly significant (control: 8.83 ± 0.54% vs. NB-360: 5.47 ± 0.68%; two-sample t test, t = 3.84; df = 22.99; P = 0.0008). (C and D) Summary graph showing the amount of insoluble [formic acid (FA)-extracted (C)] and soluble [Triton-X-100 (TX)-extracted (D)] Aβ 1–40 in forebrains of untreated (red bar; n = 14) and treated (green bar; n = 19) APP23xPS45 mice (insoluble: 21.89 ± 2.10 nmol/g for control vs. 10.18 ± 1.53 nmol/g for NB-360; two-sample t test, t = 4.52; df = 25.30; P = 0.0001; soluble: 19.98 ± 1.39 pmol/g for control vs. 11.89 ± 1.40 pmol/g for NB-360; two-sample t test, t = 4.09; df = 30.27; P = 0.0003). (E and F) Insoluble and soluble Aβ 1–42 in untreated (red bar; n = 14) and treated (green bar; n = 19) APP23xPS45 mice (insoluble: 57.31 ± 3.47 nmol/g for control vs. 37.63 ± 3.21 nmol/g for NB-360; two-sample t test, t = 4.17; df = 29.27; P = 0.0003; soluble: 78.90 ± 8.06 pmol/g for control vs. 50.64 ± 5.70 pmol/g for NB-360; two-sample t test, t = 2.86; df = 24.79; P = 0.0084). Note that Aβ was determined after the physiological measurements, during which animals had no access to food and BACE inhibitor. **P < 0.01, ***P < 0.001. Error bars represent mean ± SEM.
To explore the consequences of BACE inhibition for neuronal function, we carried out in vivo two-photon Ca2+ imaging of large populations of layer 2/3 neocortical neurons. Growing evidence from such cellular-level recordings, as well as brain-wide monitoring of activity with blood oxygen level-dependent functional magnetic resonance imaging and electroencephalography, suggest that neuronal hyperactivity is a key pathophysiological feature in AD-like mouse models and in humans with early-stage AD, underlying behavior-relevant local and long-range circuit dysfunctions (14–16). Our experiments demonstrated that treatment with NB-360 effectively abolished excess neuronal activity in transgenic mice (Fig. 2 A–E; Fig. S1 shows an example of cortical activity in a WT mouse). A detailed analysis of all recorded neurons further showed that the treatment substantially reduced the fractions of abnormally hyperactive neurons (Fig. 2F). Remarkably, on an animal-by-animal basis, there was a close correlation between Aβ level and the fraction of hyperactive neurons (Fig. 2G). Short-term treatment with NB-360 for just 1 wk resulted in only a partial correction of the hyperactivity phenotype (Fig. 2G and Fig. S2).
Fig. 2.

Rescue of neuronal hyperactivity and hypersynchrony. (A and B) (Top) Representative in vivo two-photon fluorescence images of OGB-1 acetoxymethyl ester-labeled layer 2/3 cell populations in the frontal cortex and corresponding activity maps obtained from untreated (A) and NB-360–treated (B) APP23xPS45 mice, illustrating the restoration of normal activity levels by BACE inhibitor treatment. In the activity maps, neurons are color-coded according to their activity status; yellow dashed circles delineate Aβ plaques. Note that plaques are labeled by OGB-1, and that astrocytes appear brighter than the surrounding neurons owing to their higher resting calcium levels. (Bottom) Activity traces from five example neurons marked in the top panel. (C–E) Summary histograms of activity in all recorded neurons from WT mice (C; n = 1,362 cells in 5 mice), untreated APP23xPS45 mice (D; n = 1,822 cells in 8 mice), and treated APP23xPS45 mice (E; n = 2,213 cells in 10 mice), highlighting the marked reduction of abnormal cortical hyperactivity after treatment. Dashed lines indicate the threshold used to identify hyperactive neurons (marked in red). (F) Fractions of hyperactive neurons in WT mice (blue bar; n = 5), untreated APP23xPS45 mice (red bar; n = 8), and treated APP23xPS45 mice (green bar; n = 10) [2.48 ± 1.20% for WT vs. 50.60 ± 9.53% for control vs. 11.15 ± 4.62% for NB-360; F(2,20) = 13.66, P = 0.0002; Tukey´s post hoc comparisons: P < 0.001 for WT vs. control, P < 0.001 for control vs. NB-360, P > 0.05 for WT vs. NB-360]. Gray circles represent individual animals. (G) FA-extracted Aβ levels correlate positively with the fractions of hyperactive neurons in APP23xPS45 mice (n = 22 mice). Untreated and treated (after short-term and long-term treatment) APP23xPS45 mice are color-coded; each circle represents an individual animal. (H) Fractions of hyperactive neurons correlate positively with the degree of synchrony between neurons in APP23xPS45 mice (n = 18 mice). ***P < 0.001. Tg = APP23xPS45 model. ns, not significant. Error bars represent mean ± SEM.
Fig. S1.

Normal activity of cortical neurons in WT mice in vivo. (A, Left) Representative in vivo two-photon fluorescence image of layer 2/3 cell population in the frontal cortex and corresponding activity map obtained from a WT mouse (A, Right). In the activity map, neurons are color-coded according to their activity status. (B) Activity traces from five example neurons marked in A, Left.
Fig. S2.

Fractions of hyperactive neurons after short-term treatment with BACE inhibitor. Fractions of hyperactive neurons relative to all imaged neurons in WT mice (blue bar; n = 5), untreated APP23xPS45 mice (red bar; n = 8), and APP23xPS45 mice after short-term (yellow bar; n = 5) and long-term (green bar; n = 10) NB-360 treatment (2.48 ± 1.20% for WT vs. 50.60 ± 9.53% for control vs. 29.22 ± 9.69% for short-term treatment vs. 11.15 ± 4.62% for long-term treatment; P > 0.05, control vs. short-term treatment). Gray circles represent individual animals. ns, not significant. Error bars represent mean ± SEM.
Although previous experimental results demonstrated that hyperactive neurons are clustered in plaque-rich regions of the cortex (10, 17), we did not observe such clustering in the NB-360–treated mice. For example, Fig. 2B shows that most neurons even in plaque-rich regions exhibit normal activity status. This result suggests that the microenvironment surrounding amyloid plaques became “less toxic” after BACE inhibition. Such a toxicity has been attributed to the presence of prefibrillar Aβ species, including oligomers, which form a diffuse halo around the plaques (18). Applying a recently published protocol for anti-Aβ OC antibody staining (19), we observed a marked reduction in the amount of prefibrillary Aβ in the periphery of plaques (Fig. S3). If such soluble forms of Aβ are indeed crucial for the local circuit dysfunctions, then their reintroduction into APP23xPS45 mice that had been successfully treated with NB-360 should lead to a reemergence of neuronal hyperactivity. Plaques are dimer-rich, and dimers (the smallest Aβ oligomers) are thought to be the principal “cytotoxins” in the AD brain (20, 21). Therefore, we superfused the cortex of NB-360–treated APP23xPS45 mice with synthetic Aβ dimers (21), after which hyperactivity recurred (Fig. S4). Taken together, the foregoing results provide experimental evidence that prefibrillary forms of Aβ, which are highly enriched around plaques, are the key mediators of hyperactivity, and offer a mechanistic explanation for why hyperactive neurons are clustered near plaques.
Fig. S3.

BACE inhibitor treatment reduces the amount of prefibrillar Aβ in the periphery of plaques. (A) Confocal images of cortical sections from untreated (Top) and NB-360-treated (Bottom) APP23xPS45 mice double-labeled with OC antibody (red) and thioflavin-S (cyan). (B) Quantification of the ratio of OC+ prefibrillar Aβ to thioflavin-S+ plaque cores in the untreated mice (control; n = 4) and treated mice (NB-360; n = 6). There was a highly significant reduction in the amount of prefibrillar Aβ around the plaques after treatment with NB-360 (4.16 ± 0.55 for control vs. 2.22 ± 0.21 for NB-360; two-sample t test, t = 3.8; df = 8; P = 0.0050). **P < 0.01. Error bars represent mean ± SEM.
Fig. S4.

Recurrence of neuronal hyperactivity after topical application of Aβ dimers to the cortex of NB-360–treated APP23xPS45 mice. (A) In vivo two-photon fluorescence image of layer 2/3 neurons in a NB-360–treated APP23xPS45 mouse. (B) Ca2+ transients of five neurons, marked in A, before (baseline) and 60 min after superfusion of the cortex with AβS26C cross-linked dimers (1 µM). (C) Average rate of Ca2+ transients in all recorded cortical regions (n = 8 regions in three mice) before and after Aβ application (2.79 ± 0.57 transients/min for baseline vs. 8.98 ± 1.86 transients/min for Aβ; paired t test, t = 3.883; df = 7; P = 0.0060). (D) Fractions of hyperactive neurons from all recorded cortical regions (n = 8 regions in 3 mice) before and after Aβ application (16.62 ± 6.85% for baseline vs. 57.35 ± 9.58% for Aβ; paired t test, t = 5.628; df = 7; P = 0.0008). ***P < 0.001. Error bars represent mean ± SEM.
Previous studies have shown that hyperactivity is often associated with a shift from the normal pattern of neuronal activity to a more synchronous pattern, which could promote local epileptogenesis (14). In line with those observations, when we quantified the pairwise correlations for all recorded neurons, the untreated transgenic mice showed a greater degree of synchrony than seen in wild-type (WT) mice (Fig. S5). In contrast, transgenic mice treated with NB-360 exhibited a significant decrease in neuronal synchrony (Fig. 2H and Fig. S5). To assess the effects of BACE inhibitor treatment in nontransgenic animals, we treated WT mice with NB-360 and monitored neuronal activity levels. As shown in Fig. S6, there was no change in activity after the treatment.
Fig. S5.
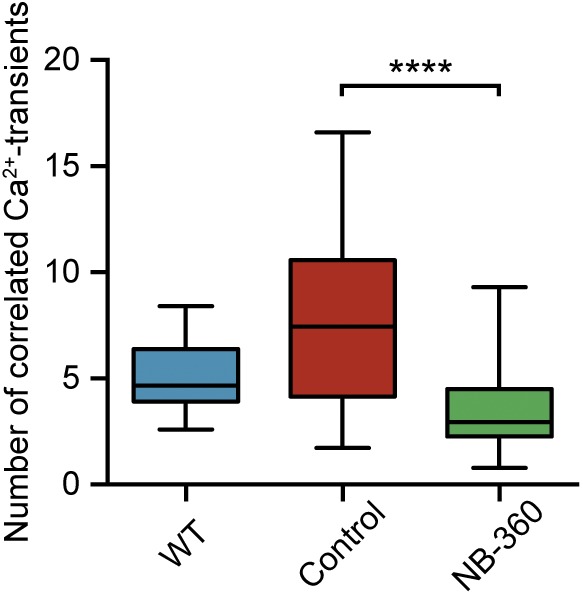
BACE inhibition reduces hypersynchrony of neurons. There was a significantly higher number of correlated Ca2+ transients in untreated APP23xPS45 mice (red; n = 64 recording sites in eight mice) relative to WT mice (blue; n = 47 recording sites in five mice), and a strong decrease in abnormal correlation in NB-360–treated APP23xPS45 mice (green; n = 81 recording sites in 10 mice) [F(2,198) = 39.79, P < 0.0001; Tukey's post hoc comparisons: P < 0.0001 for WT vs. control and P < 0.0001 for control vs. NB-360). In the boxplot, the top bar is the maximum observation, the lower bar is the minimum observation. The box extends from the 25th percentile to the 75th percentile, with the middle bar as the median. ****P < 0.0001.
Fig. S6.

No significant change of neuronal activity patterns after BACE inhibitor treatment in WT mice. (A and B) Summary histograms of activity in all recorded neurons from untreated (A) and NB-360–treated (B) WT mice. (C) Fractions of hyperactive neurons in untreated (red bar, n = 5) and treated (green bar, n = 5) WT mice (1.00 ± 0.44% for untreated vs. 1.44 ± 0.26% for treated; two-sample t test, t = 0.87; df = 6.54; P = 0.4152). Gray circles represent individual animals. ns, not significant. Error bars represent mean ± SEM.
Recently reported evidence indicates that the abnormal accumulation of Aβ in the neocortex of humans with early AD is correlated with an impairment of slow (<1 Hz) brain oscillations and memory consolidation (22). In a previous study using large-scale Ca2+ fluorescence imaging of the cortical surface, our group found remarkably similar impaired slow-wave activity in APP23xPS45 mice as well (11), strengthening the validity of the mouse model for the study of slow-wave activity. In the present study, we used this method and found that in transgenic mice, treatment with NB-360 changed the slow-wave activity from an impaired, disorganized spatial pattern (Fig. 3 A and B) to the WT-like coherent activity pattern (Fig. 3 C–F). Fig. 3G summarizes the results from all recorded mice. Importantly, on an animal-by-animal basis, we found a significant negative correlation between Aβ levels and the degree of restoration of long-range coherence of slow-wave activity (Fig. 3H). To test independently whether Aβ is sufficient to impair slow-wave activity, we superfused the exposed cortex of NB-360–treated transgenic mice with a mixture of synthetic Aβ1–40 and Aβ1–42, the most common isoforms of Aβ. We found that in the NB-360–treated mice, the restored activity was abolished by the topical application of Aβ (Fig. S7). Together, these experiments provide strong evidence that the impairment of long-range communication is directly mediated by Aβ.
Fig. 3.

Recovery of long-range circuit function. (A) Representative traces from frontal (red) and occipital (black) cortex of an untreated APP23xPS45 mouse illustrating the massive impairment of long-range coherence of slow-wave oscillations. The traces are superimposed below. (B) Cross-correlation matrix calculated from the same animal shown in A. Rows and columns are labeled by cortical area: occ, occipital; som, somatosensory; mot, motor; fro, frontal. (C–F) Activity traces and cross-correlation matrices from a WT mouse (C and D) and a NB-360–treated APP23xPS45 mouse (E and F) showing that the impaired long-range coherence of slow-wave activity in APP23xPS45 mice can be recovered by BACE inhibitor treatment. (G) Summary graph of the average correlation strength between frontal and occipital cortex in WT mice (blue bar; n = 3), untreated APP23xPS45 mice (n = 8), and treated APP23xPS45 mice (n = 15) [0.79 ± 0.02 for WT vs. 0.29 ± 0.05 for control vs. 0.53 ± 0.06 for NB-360; F(2,24) = 10.73, P = 0.0005; Tukey´s post hoc comparisons: P < 0.001 for WT vs. control, P < 0.05 for control vs. NB-360, P < 0.05 for WT vs. NB-360]. Gray circles represent individual animals. (H) FA-extracted Aβ levels correlate inversely with the long-range coherence of slow-wave oscillations (n = 22 mice). Untreated and treated APP23xPS45 mice are color-coded; each circle represents an individual animal. *P < 0.05. Tg = APP23xPS45 model. Error bars represent mean ± SEM.
Fig. S7.

Reintroducing Aβ into the cortex reversed the beneficial effects of BACE inhibition on long-range functional connectivity. (A) Representative traces from frontal (red) and occipital (black) cortex of an NB-360–treated APP23xPS45 mouse before (Top), during (Middle), and after (Bottom) superfusion of the cortex with synthetic Aβ 1–40/1–42 (1 µM). (B) Summary graph of the average correlation strength between the frontal and occipital cortex in NB-360–treated APP23xPS45 mice (n = 5 mice) under the three conditions shown in A (0.56 ± 0.05 for baseline vs. 0.32 ± 0.08 for Aβ vs. 0.47 ± 0.09 for washout). There was a significant effect of the treatment [linear mixed-effects model, F(2,11) = 7.07, P = 0.011], and the difference between the baseline condition and the Aβ wash-in was highly significant [F(1,11) = 14.0, P = 0.0032]. **P < 0.01. ns, not significant. Error bars represent mean ± SEM.
To assess whether the treatment with NB-360 had any beneficial effects on learning and memory deficits in the aged transgenic mice, we trained mice in a water maze task to find a fixed, visible platform (10, 11) (Fig. 4A). Compared with WT mice, untreated transgenic mice showed substantially longer escape latencies over all training sessions (Fig. 4 A and B). In contrast, NB-360–treated transgenic mice exhibited significantly improved memory performance relative to the untreated transgenic controls, achieving performance levels not significantly different from those of WT mice (Fig. 4 A and B). To rule out possible motor defects that could interfere with the ability to perform this task, we calculated the swimming speed, and found no significant difference among the three groups (Fig. S8). These results demonstrate that BACE inhibition not only can prevent memory impairment when initiated before the development of Aβ plaques (23, 24), but also has the potential to reverse memory deficits in aged, plaque-bearing mice. We found that, on an animal-by-animal basis, the level of long-range coherence of slow-wave activity was inversely correlated with the degree of memory impairment (Fig. 4C), consistent with recently reported findings (11). In addition, Aβ levels showed a positive correlation with the degree of memory impairment (Fig. 4D). We suggest that inhibiting BACE reduces the Aβ burden as well as neuronal hyperactivity, leading to the reemergence of long-range functional correlations that are required for normal memory function (Fig. 4E). This model is supported by mediation analysis (Fig. S9).
Fig. 4.

Reversal of learning and memory deficits. (A) Sample trajectories at day 5 of the water maze from untreated (Left) and NB-360-treated (Right) APP23xPS45 mice. The different colors represent trajectories for individual mice. (B) Summary graph showing memory performance, assessed by mean water maze escape latency, of WT mice (blue, n = 25), untreated APP23xPS45 mice (red, n = 28), and NB-360–treated APP23xPS45 mice (green, n = 20) [linear mixed-effects model, condition: F(2,358) = 9.6, P = 8.60 × 10⁻⁵; permutation test, P < 0.001; NB-360 vs. WT: t(385) = −1.71, P = 0.0890; permutation test, P = 0.108; NB-360 vs. control: t(358) = 2.35, P = 0.0193; permutation test, P = 0.004]. (C) Long-range coherence of slow-wave activity correlates inversely with memory impairment in APP23xPS45 mice (n = 23 mice). Untreated and treated APP23xPS45 mice are color-coded; each circle represents an individual animal. (D) FA-extracted Aβ levels correlate positively with memory impairment (n = 26 mice). (E) Model summarizing the mechanistic relationship between high Aβ levels and impairment of local and long-range neural circuits and learning and memory deficits. This model incorporates the growing experimental evidence for a feedback loop between Aβ accumulation and neuronal hyperactivity (19, 26, 27). **P < 0.01. Tg = APP23xPS45 model. ns, not significant; p, platform; s, start. Error bars represent mean ± SEM.
Fig. S8.

Different escape latencies in WT as well as untreated and treated APP23xPS45 mice are due to the swimming trajectories, not to differences in swimming speed. (A and B) Bar graphs showing the path length (A) and the swimming speed (B) of WT mice (blue, n = 6), untreated APP23xPS45 mice (red, n = 5), and APP23xPS45 mice after 6 wk of treatment with NB-360 (green, n = 5). Path length: 302.3 ± 66.4 pixels for WT vs. 789.2 ± 59.9 pixels for control vs. 412.1 ± 25.4 pixels for NB-360–treated [F(2,13) = 20.68, P < 0.0001; Tukey's post hoc comparisons: P < 0.0001 for WT vs. control, P = 0.0013 for control vs. NB-360, P = 0.3668 for WT vs. NB-360]. Swimming speed: 140.8 ± 14.6 pixels for WT vs. 145.7 ± 8.4 pixels for control vs. 154.7 ± 9.6 pixels for NB-360–treated [F(2,13) = 0.3577, P = 0.7059; Tukey's post hoc comparisons: P = 0.9522 for WT vs. control, P = 0.8635 for control vs. NB-360, P = 0.6854 for WT vs. NB-360. ***P < 0.01]. ns, not significant. Error bars represent mean ± SEM.
Fig. S9.

Mediation analysis for the model presented in Fig. 4E. Mediation compares the overall effect of a causal variable on an outcome variable with the direct effect computed in the presence of a mediating variable. Mediation occurs when the indirect path through the mediating variable has a significant effect on the outcome variable, so that the direct effect is smaller (or more generally different) than the overall effect. Complete mediation occurs when the direct effect is null. (A–D) Mediation analyses between two of the quantities presented in Fig. 4E, with an intermediate mediating variable. All four possible combinations of causal variable, outcome variable, and mediating variable were tested. The regressions were performed on normalized variables (mean 0, SD 1). The overall effect is given by the coefficient c, and the direct effect is given by coefficient c'. The indirect path through the mediating variable is given by coefficients a and b. In all cases, the indirect path had a significant effect (permutation test, P < 0.05 for all cases), but the direct effect (measured by c') was not significant, suggesting complete mediation. Thus, these results are consistent with the scheme shown in Fig. 4E. (A) Aβ plaque burden and escape latency, mediated by long-range coherence. (B) Aβ plaque burden and escape latency, mediated by neuronal hyperactivity. (C) Aβ plaque burden and long-range coherence, mediated by neuronal hyperactivity. (D) Neuronal hyperactivity and escape latency, mediated by long-range coherence. Aβ burden, Aβ plaque burden; hyperactivity, fraction of hyperactive cells; long-range coherence, coherence of slow-wave activity between the frontal cortex and occipital cortex; escape latency, mean latency to the platform on day 5 of the water maze task.
Discussion
Here we provide mechanistic evidence that the accumulation of Aβ in the brain promotes dysfunction of local neural circuits and long-range network connectivity, leading ultimately to cognitive impairment. We demonstrate that the pharmacologic inhibition of BACE activity can effectively repair the pathophysiological and cognitive consequences of abnormal Aβ accumulation, even when initiated after the development of extensive Aβ pathology. Our results further suggest that neuronal hyperactivity within amyloid plaque-bearing local circuits is likely due to prefibrillary Aβ species, which form a halo around the plaque cores.
The findings are unexpected in view of previous evidence indicating that at such advanced disease stages, many pathological and cellular processes are chronic and mostly irreversible (7, 8, 23–25). In fact, we found that most dysfunctional neurons in the amyloid-plaque bearing neocortex are still viable, and that their “hyperactive phenotype” can be reversed by reducing Aβ in the brain. This correction of excess neuronal activity correlates with a recovery of long-range circuits as well as memory functions. Increasing evidence from animal and human studies indicates that along with contributing to memory impairment, neuronal hyperactivity can worsen Aβ plaque deposition (19, 26–28) and even neurodegeneration (29); thus, the BACE inhibitor-associated normalization of neuronal activity levels may directly modify disease progression.
It is important to note that our present results are in stark contrast to those of two recent studies that investigated the in vivo efficacy of passive immunotherapies and found that anti-Aβ antibody treatment was associated not only with an exacerbation of neuronal circuit dysfunction (7) but also with an increased risk of sudden death, likely due to fatal seizures (8). These discrepant results might be explained by differences in the action profiles of these treatments, in which BACE inhibitors effectively reduce the formation of all Aβ species in the brain, including prefibrillary Aβ surrounding plaques, whereas anti-Aβ antibodies (at least the tested ones) are less effective in neutralizing these most toxic Aβ species. Indeed, the aforementioned studies showed that the anti-Aβ antibodies were incapable of reducing levels of soluble Aβ (7), as well as Aβ oligomers (8).
Based on the high potency of BACE inhibitors in reducing brain Aβ levels (30), several compounds are currently either in preparation for or in use in clinical trials. Although these ongoing clinical trials have not reported any major safety issues so far, there remain some concerns about potential (and perhaps subtler) side effects. For example, although inhibition of BACE reduced Aβ in the brain, it enhances the accumulation of alternative APP products such as Aη-α peptides, which have been shown to be neurotoxic. These peptides can effectively promote neuronal silencing and impair hippocampal long-term potentiation in mice (31). In addition, BACE inhibitors may interfere with physiological functions of the enzyme that are beyond APP processing, such as axon guidance and synapse formation (32). Nonetheless, we stress that in our in vivo recordings, we did not identify any BACE-inhibitor related adverse effects on spontaneous neuronal activity patterns and memory performance in the APP23xPS45 model; in addition, the treatment did not reveal any changes in cortical activity in WT mice (Fig. S6).
Although our results were obtained in a mouse model showing neuronal hyperactivity and impaired slow-wave activity as observed in AD brains in humans (22), their relevance for the human disease remains to be established. Nonetheless, our observations provide strong in vivo evidence, at many levels of brain function, identifying BACE inhibition as a promising disease-modifying anti-Aβ therapeutic strategy for AD, at least in early stages before massive neurodegeneration occurs. Strong support for the relevance of our findings comes from genetic studies showing that human carriers of the A673T mutation, which reduces the enzymatic activity of BACE, are protected against AD (33), whereas humans with the Swedish mutation, which enhances BACE activity, develop AD at an early age (34).
Materials and Methods
Animals.
Experiments were performed on female APP23xPS45 double-transgenic mice aged >6 mo overexpressing the human APP with the Swedish mutation (670/671) and the human G384A-mutated PS1 (7, 10, 11, 17, 35–37). At this age, mice exhibit widespread cerebral Aβ pathology (10, 17, 36), neuropil dystrophy (10), and astrocytic (17, 38) and microglia (39) impairments, as well as learning and memory deficits (10, 11, 17). Age-matched nontransgenic WT littermates were also used where appropriate. All mice were housed in standard mouse cages on wood bedding under conventional laboratory conditions (12-h dark/12-h light cycle, constant temperature, and constant humidity) and provided with food and water ad libitum. Generation, care, and use of the animals, as well as all experimental procedures, were conducted in accordance with local animal welfare regulations and were approved by the state government of Bavaria, Germany.
BACE Inhibitor Treatment.
The BACE inhibitor NB-360 was used in this study. A detailed description of the compound’s in vitro and in vivo efficacy, pharmacokinetics, and brain penetration in various animal models has been described previously (9). Oral treatment with NB-360 was provided by incorporating the drug into food pellets (0.25 g/kg; Provimi Kliba, Kaiseraugst, Switzerland). The APP23xPS45 mice at age 6–8 mo were fed NB-360 or vehicle control food for 6 wk and then analyzed in the water maze task (see below). Treatment was continued during the water maze task. Mice were allocated at random to receive drug or vehicle. After behavioral testing, in vivo imaging experiments were conducted, after which the mice were killed for biochemical and histopathological analyses. Note that the mice had access to food and BACE inhibitor until the imaging experiments started. No obvious behavioral or health problems were observed during the drug treatment except for patchy hair depigmentation, which has been related to BACE inhibition in melanocytes (40).
Behavioral Testing.
We subjected the mice to a discriminatory water maze task as described previously (10, 11). In brief, the mice had to locate a platform that was stable and kept visible in a fixed position (correct choice). The incorrect platform, in a pseudorandom position, sank when a mouse climbed on. The laboratory environment provided distal spatial cues. A trial was terminated if the mouse failed to climb onto one of the platforms within 30 s (error of omission). In the event of an incorrect choice or error of omission, the mouse was placed by the investigator onto the correct platform. All mice remained on this platform for 5 s before being returned to the home cage. Learning was assessed during five training sessions (days 1–5). Each session included five trials separated by 1- to 3-min intermissions. Whether mice used spatial cues to locate the correct platform was validated in an additional session (reversal) after moving the correct platform to the opposite quadrant in the water maze. The latency between the start of the trial and the moment when the correct platform was reached was used to assess memory performance. The experimenter was blinded to the genotype or treatment during the water maze experiments. The behavioral data were analyzed using a linear mixed-effects model [fixed factors: day and treatment (WT mice, untreated APP23xPS45 mice, or treated APP23xPS45 mice), with random intercept within mouse]. Calculations were done with MATLAB (Mathworks) using the function fitlme.
In Vivo Two-Photon Ca2+ Imaging.
After the behavioral testing, in vivo two-photon Ca2+ imaging was performed as described previously (7, 10, 17). In brief, mice were anesthetized with isoflurane 1–1.5% (vol/vol) for induction and during surgery. A reduced concentration of isoflurane (0.8%) was used later during the imaging. The skin above the skull was removed, and a custom-made recording chamber was glued to the skull with cyanoacrylate glue. Then the recording chamber was perfused with warm (37 °C) artificial cerebrospinal fluid (ACSF; 125 mM NaCl, 4.5 mM KCl, 26 mM NaHCO3, 1.25 mM NaH2PO4, 2 mM CaCl2, 1 mM MgCl2, and 20 mM glucose, pH 7.4 when bubbled with 95% O2 and 5% CO2), and a craniotomy was performed over the frontal cortex. The dura was left intact, and extreme care was taken not to damage the cortical tissue. The fluorescent Ca2+-indicator dye Oregon Green 488 BAPTA-1 AM (OGB-1) was bulk-loaded into layer 2/3 of the neocortex. Spontaneous activity of layer 2/3 neurons was monitored by imaging the fluorescence changes with a custom-built two-photon microscope based on a Ti:sapphire pulsing laser operating at a wavelength of 800 nm and resonant galvo mirror system (8 or 12 kHz; GSI) through a 40×, 0.8 NA aperture water immersion objective (Nikon). Full-frame images were acquired at 40 Hz using custom-written software based on LabView (National Instruments).
Image analysis was performed offline as described previously (7, 10, 17, 36). In brief, regions of interest (ROIs) were drawn around individual somata, and then relative fluorescence change (∆F/F) vs. time traces were generated for each ROI. Ca2+ transients were identified as changes in ∆F/F that were three times larger than the SD of the noise band. Astrocytes were excluded from the analysis based on their selective staining by sulforhodamine 101 and their specific morphology. The fact that OGB-1 effectively labels Aβ plaques allowed us to readily identify these plaques in the stained tissue (41). In a subset of NB-360–treated APP23xPS45 mice, AβS26C cross-linked dimers (1 µM; JPT Peptide Technologies) were added to the ACSF used for perfusion in the recording chamber, and neuronal activity was recorded before (baseline) and ∼60 min after application of the dimers.
For the neuronal synchrony analysis (Fig. 2H and Fig. S5), raw Ca2+ traces were smoothed using a binomial filter with a window size of 1.7 s. The mean of the absolute difference between the raw and smoothed traces was taken as the reference noise level (refNoise). The Hilbert transform was used to extract the instantaneous phase of each trace and the phase difference between the two traces. In the next step, correlated sections were calculated by thresholding the instantaneous phase difference smaller than 54 degrees and the instantaneous phase of both traces smaller than 72 degrees. For each correlated section, the energy of both traces was calculated, and only sections with a minimum energy exceeding a threshold (minimum amplitude, 3× refNoise; minimum period, 0.7 s) were preserved as correlated Ca2+ transients.
In Vivo Large-Scale Ca2+ Imaging.
In vivo camera-based large-scale Ca2+ imaging was performed as described previously (11, 42). In brief, at the end of the two-photon imaging session, the craniotomy was enlarged and the cortical tissue was bulk-loaded with OGB-1 at multiple sites, resulting in nearly complete labeling of the entire cortical extent. Recordings were made using a high-speed digital camera (NeuroCCD; RedShirt Imaging) coupled to a macro zoom fluorescence microscope. Images were acquired at 125 Hz (80 × 80 pixels) using a custom LabView data acquisition program (National Instruments).
Data analysis was performed as described previously (11). In brief, Ca2+ signals arising from each camera pixel were first temporally smoothed using a low-pass filter with a corner frequency of 50 Hz. The baseline fluorescence at each pixel was determined every 4 s (500 frames) by selecting the 10th percentile of all fluorescence values from a symmetric 8-s window. These values were then interpolated to form the baseline for transforming the fluorescence into F/F values (typical range, 0–0.1). The data were cleaned of the heart rate artifacts using the denoising source separation (DSS) algorithm (43).
We subdivided the cortex into four domains along the anteroposterior axis (roughly corresponding to occipital, somatosensory, motor, and frontal cortices). To study the long-range spatial coherence of the Ca2+ fluorescence signal, we focused on the fluorescence signal over frontal and occipital cortices. The coherence was estimated by the correlation coefficients of 32-s segments of the average fluorescence in the cortical regions. In a subset of NB-360–treated APP23xPS45 mice, the cortex was superfused with a 1:1 mixture of Aβ1–40 and Aβ1–42 peptides (Bachem). Peptides were added to the recirculating ACSF at a concentration of 1 µM. Slow-wave oscilllations were recorded before (baseline) and ∼60 min after the Aβ application.
Determination of Aβ Plaques.
Coronal brain slices were obtained from brains imaged in vivo, and thioflavin-S (0.05% wt/vol) was used to stain Aβ plaques, as described previously (17, 36). Pictures were taken using a camera (XC10; Olympus) mounted on a light microscope at a magnification of 2× with a 2× objective. To determine the plaque area, quantitative analysis of stained signals was performed using ImageJ software.
Immunhistochemistry and Confocal Imaging.
The prefibrillary Aβ halo surrounding plaques was analyzed as described previously (19). Coronal brain sections (30 µm) were prepared with a vibratome (VT1000s; Leica). OC antibody (AB2286; EMD Millipore) diluted 1:250 in PBS with 0.2% Triton X-100 and 4% goat serum was used as a primary antibody for detecting prefibrillary Aβ species, including oligomers. Sections were stained for 2 d at 4 °C, washed, and then stained with an Alexa Fluor 647-conjugated secondary antibody (A21244; Thermo Fisher Scientific) diluted to 1:500 for 12 h. For staining of the plaque cores, the sections were stained with thioflavin-S (T1892; Sigma-Aldrich) diluted 1:10,000 from 2% stock for 20 min. Confocal imaging was performed using an Olympus FV3000 system. Images were obtained through a 60× oil-immersion objective (NA 1.42) at zoom 1, at a 1,024 × 1,024-pixel resolution with a 3-µm z-step size. Imaging parameters and laser settings were kept constant. Five imaging regions were chosen at random in each brain section, and two brain sections from each animal were used. For analysis, the images were processed using ImageJ with maximal z-projection. The amounts of plaque and prefibrillary Aβ were calculated by multiplying the area and the signal intensity.
Biochemical Determination of Aβ.
Forebrains obtained from brains imaged in vivo were homogenized in 9 volumes of ice-cold Tris-buffered saline (pH 7.4) containing Complete Protease Inhibitor Mixture (Roche Diagnostics) using a Sonifier 450 (Branson Ultrasonics). Soluble Aβ was extracted from 50 μL of homogenate with 50 μL of 2% (vol/vol) Triton X-100 in TBS, followed by ultracentrifugation at 100,000 × g for 15 min. For the extraction of insoluble amyloid peptides, 50 μL of forebrain homogenate was mixed with 117 μL of 100% formic acid, stored for 15 min, and neutralized. The supernatant after centrifugation at 20,300 × g was diluted and used for analysis. Aβ40 and 42 peptides were determined using an electrochemiluminescence immunoassay kit based on antibody 6E10 from Meso Scale Discovery. Samples and standards were prepared according to the manufacturer’s protocol.
Statistics.
Data are presented as mean ± SEM unless specified otherwise. Statistical comparison between two experimental groups was assessed by Welch’s two-tailed t test, and differences between multiple groups were assessed using one-way ANOVA followed by Tukey’s multiple-comparisons test. P < 0.05 was considered statistically significant. When the assumptions of the parametric tests were not met, permutation tests were performed as well. In all cases, the results of the permutation tests conformed with those of the parametric tests.
Acknowledgments
We thank C. Karrer, P. Apostolopoulos, K. Kratz, and I. Brzak for their excellent technical assistance. A.K. was funded by grants from the European Research Council, the European Union FP7 program (Project Corticonic), and the German Research Foundation (Integrated Research Training Group 1373 and Collaborative Research Center 870). M.A.B. was supported by the Alzheimer Forschung Initiative.
Footnotes
Conflict of interest statement: U.N., D.R.S., and M.S. are or have been employees and shareholders of Novartis Pharma AG, Basel, Switzerland. All other authors declare no competing financial interests related to this project.
This article contains supporting information online at www.pnas.org/lookup/suppl/doi:10.1073/pnas.1708106114/-/DCSupplemental.
References
- 1.Masters CL, et al. Alzheimer’s disease. Nat Rev Dis Primers. 2015;1:15056. doi: 10.1038/nrdp.2015.56. [DOI] [PubMed] [Google Scholar]
- 2.Musiek ES, Holtzman DM. Three dimensions of the amyloid hypothesis: Time, space and “wingmen”. Nat Neurosci. 2015;18:800–806. doi: 10.1038/nn.4018. [DOI] [PMC free article] [PubMed] [Google Scholar]
- 3.Selkoe DJ, Hardy J. The amyloid hypothesis of Alzheimer’s disease at 25 years. EMBO Mol Med. 2016;8:595–608. doi: 10.15252/emmm.201606210. [DOI] [PMC free article] [PubMed] [Google Scholar]
- 4.Boche D, Denham N, Holmes C, Nicoll JA. Neuropathology after active Abeta42 immunotherapy: Implications for Alzheimer’s disease pathogenesis. Acta Neuropathol. 2010;120:369–384. doi: 10.1007/s00401-010-0719-5. [DOI] [PubMed] [Google Scholar]
- 5.Salloway S, et al. Bapineuzumab 301 and 302 Clinical Trial Investigators Two phase 3 trials of bapineuzumab in mild-to-moderate Alzheimer’s disease. N Engl J Med. 2014;370:322–333. doi: 10.1056/NEJMoa1304839. [DOI] [PMC free article] [PubMed] [Google Scholar]
- 6.Doody RS, et al. Alzheimer’s Disease Cooperative Study Steering Committee; Solanezumab Study Group Phase 3 trials of solanezumab for mild-to-moderate Alzheimer’s disease. N Engl J Med. 2014;370:311–321. doi: 10.1056/NEJMoa1312889. [DOI] [PubMed] [Google Scholar]
- 7.Busche MA, et al. Decreased amyloid-β and increased neuronal hyperactivity by immunotherapy in Alzheimer’s models. Nat Neurosci. 2015;18:1725–1727. doi: 10.1038/nn.4163. [DOI] [PubMed] [Google Scholar]
- 8.Mably AJ, et al. Anti-Aβ antibodies incapable of reducing cerebral Aβ oligomers fail to attenuate spatial reference memory deficits in J20 mice. Neurobiol Dis. 2015;82:372–384. doi: 10.1016/j.nbd.2015.07.008. [DOI] [PMC free article] [PubMed] [Google Scholar]
- 9.Neumann U, et al. A novel BACE inhibitor NB-360 shows a superior pharmacological profile and robust reduction of amyloid-β and neuroinflammation in APP transgenic mice. Mol Neurodegener. 2015;10:44. doi: 10.1186/s13024-015-0033-8. [DOI] [PMC free article] [PubMed] [Google Scholar]
- 10.Busche MA, et al. Clusters of hyperactive neurons near amyloid plaques in a mouse model of Alzheimer’s disease. Science. 2008;321:1686–1689. doi: 10.1126/science.1162844. [DOI] [PubMed] [Google Scholar]
- 11.Busche MA, et al. Rescue of long-range circuit dysfunction in Alzheimer’s disease models. Nat Neurosci. 2015;18:1623–1630. doi: 10.1038/nn.4137. [DOI] [PubMed] [Google Scholar]
- 12.Vassar R, et al. Beta-secretase cleavage of Alzheimer’s amyloid precursor protein by the transmembrane aspartic protease BACE. Science. 1999;286:735–741. doi: 10.1126/science.286.5440.735. [DOI] [PubMed] [Google Scholar]
- 13.May PC, et al. The potent BACE1 inhibitor LY2886721 elicits robust central Aβ pharmacodynamic responses in mice, dogs, and humans. J Neurosci. 2015;35:1199–1210. doi: 10.1523/JNEUROSCI.4129-14.2015. [DOI] [PMC free article] [PubMed] [Google Scholar]
- 14.Palop JJ, Mucke L. Amyloid β-induced neuronal dysfunction in Alzheimer’s disease: From synapses toward neural networks. Nat Neurosci. 2010;13:812–818. doi: 10.1038/nn.2583. [DOI] [PMC free article] [PubMed] [Google Scholar]
- 15.Busche MA, Konnerth A. Neuronal hyperactivity—A key defect in Alzheimer’s disease? BioEssays. 2015;37:624–632. doi: 10.1002/bies.201500004. [DOI] [PubMed] [Google Scholar]
- 16.Busche MA, Konnerth A. 2016. Impairments of neural circuit function in Alzheimer's disease. Philos Trans R Soc Lond B Biol Sci 371(1700): pii: 20150429.
- 17.Grienberger C, et al. Staged decline of neuronal function in vivo in an animal model of Alzheimer’s disease. Nat Commun. 2012;3:774. doi: 10.1038/ncomms1783. [DOI] [PMC free article] [PubMed] [Google Scholar]
- 18.Koffie RM, et al. Oligomeric amyloid β associates with postsynaptic densities and correlates with excitatory synapse loss near senile plaques. Proc Natl Acad Sci USA. 2009;106:4012–4017. doi: 10.1073/pnas.0811698106. [DOI] [PMC free article] [PubMed] [Google Scholar]
- 19.Yuan P, Grutzendler J. Attenuation of β-amyloid deposition and neurotoxicity by chemogenetic modulation of neural activity. J Neurosci. 2016;36:632–641. doi: 10.1523/JNEUROSCI.2531-15.2016. [DOI] [PMC free article] [PubMed] [Google Scholar]
- 20.Yang T, Li S, Xu H, Walsh DM, Selkoe DJ. Large soluble oligomers of amyloid β-protein from Alzheimer brain are far less neuroactive than the smaller oligomers to which they dissociate. J Neurosci. 2017;37:152–163. doi: 10.1523/JNEUROSCI.1698-16.2016. [DOI] [PMC free article] [PubMed] [Google Scholar]
- 21.Shankar GM, et al. Amyloid-β protein dimers isolated directly from Alzheimer’s brains impair synaptic plasticity and memory. Nat Med. 2008;14:837–842. doi: 10.1038/nm1782. [DOI] [PMC free article] [PubMed] [Google Scholar]
- 22.Mander BA, et al. β-amyloid disrupts human NREM slow waves and related hippocampus-dependent memory consolidation. Nat Neurosci. 2015;18:1051–1057. doi: 10.1038/nn.4035. [DOI] [PMC free article] [PubMed] [Google Scholar]
- 23.Das P, Murphy MP, Younkin LH, Younkin SG, Golde TE. Reduced effectiveness of Abeta1-42 immunization in APP transgenic mice with significant amyloid deposition. Neurobiol Aging. 2001;22:721–727. doi: 10.1016/s0197-4580(01)00245-7. [DOI] [PubMed] [Google Scholar]
- 24.Oddo S, Billings L, Kesslak JP, Cribbs DH, LaFerla FM. Abeta immunotherapy leads to clearance of early, but not late, hyperphosphorylated tau aggregates via the proteasome. Neuron. 2004;43:321–332. doi: 10.1016/j.neuron.2004.07.003. [DOI] [PubMed] [Google Scholar]
- 25.Yan P, et al. Characterizing the appearance and growth of amyloid plaques in APP/PS1 mice. J Neurosci. 2009;29:10706–10714. doi: 10.1523/JNEUROSCI.2637-09.2009. [DOI] [PMC free article] [PubMed] [Google Scholar]
- 26.Yamamoto K, et al. Chronic optogenetic activation augments Aβ pathology in a mouse model of Alzheimer disease. Cell Reports. 2015;11:859–865. doi: 10.1016/j.celrep.2015.04.017. [DOI] [PubMed] [Google Scholar]
- 27.Bero AW, et al. Neuronal activity regulates the regional vulnerability to amyloid-β deposition. Nat Neurosci. 2011;14:750–756. doi: 10.1038/nn.2801. [DOI] [PMC free article] [PubMed] [Google Scholar]
- 28.Leal SL, Landau SM, Bell RK, Jagust WJ. Hippocampal activation is associated with longitudinal amyloid accumulation and cognitive decline. eLife. 2017;6:e22978. doi: 10.7554/eLife.22978. [DOI] [PMC free article] [PubMed] [Google Scholar]
- 29.Putcha D, et al. Hippocampal hyperactivation associated with cortical thinning in Alzheimer’s disease signature regions in non-demented elderly adults. J Neurosci. 2011;31:17680–17688. doi: 10.1523/JNEUROSCI.4740-11.2011. [DOI] [PMC free article] [PubMed] [Google Scholar]
- 30.Kennedy ME, et al. The BACE1 inhibitor verubecestat (MK-8931) reduces CNS β-amyloid in animal models and in Alzheimer’s disease patients. Sci Transl Med. 2016;8:363ra150. doi: 10.1126/scitranslmed.aad9704. [DOI] [PubMed] [Google Scholar]
- 31.Willem M, et al. η-Secretase processing of APP inhibits neuronal activity in the hippocampus. Nature. 2015;526:443–447. doi: 10.1038/nature14864. [DOI] [PMC free article] [PubMed] [Google Scholar]
- 32.Barão S, Moechars D, Lichtenthaler SF, De Strooper B. BACE1 physiological functions may limit its use as a therapeutic target for Alzheimer’s disease. Trends Neurosci. 2016;39:158–169. doi: 10.1016/j.tins.2016.01.003. [DOI] [PubMed] [Google Scholar]
- 33.Jonsson T, et al. A mutation in APP protects against Alzheimer’s disease and age-related cognitive decline. Nature. 2012;488:96–99. doi: 10.1038/nature11283. [DOI] [PubMed] [Google Scholar]
- 34.Citron M, et al. Mutation of the β-amyloid precursor protein in familial Alzheimer’s disease increases β-protein production. Nature. 1992;360:672–674. doi: 10.1038/360672a0. [DOI] [PubMed] [Google Scholar]
- 35.Eichhoff G, Busche MA, Garaschuk O. In vivo calcium imaging of the aging and diseased brain. Eur J Nucl Med Mol Imaging. 2008;35:S99–S106. doi: 10.1007/s00259-007-0709-6. [DOI] [PubMed] [Google Scholar]
- 36.Busche MA, et al. Critical role of soluble amyloid-β for early hippocampal hyperactivity in a mouse model of Alzheimer’s disease. Proc Natl Acad Sci USA. 2012;109:8740–8745. doi: 10.1073/pnas.1206171109. [DOI] [PMC free article] [PubMed] [Google Scholar]
- 37.Maier FC, et al. Longitudinal PET-MRI reveals β-amyloid deposition and rCBF dynamics and connects vascular amyloidosis to quantitative loss of perfusion. Nat Med. 2014;20:1485–1492. doi: 10.1038/nm.3734. [DOI] [PubMed] [Google Scholar]
- 38.Rodríguez-Arellano JJ, Parpura V, Zorec R, Verkhratsky A. Astrocytes in physiological aging and Alzheimer’s disease. Neuroscience. 2016;323:170–182. doi: 10.1016/j.neuroscience.2015.01.007. [DOI] [PubMed] [Google Scholar]
- 39.Brawek B, et al. Impairment of in vivo calcium signaling in amyloid plaque-associated microglia. Acta Neuropathol. 2014;127:495–505. doi: 10.1007/s00401-013-1242-2. [DOI] [PubMed] [Google Scholar]
- 40.Shimshek DR, et al. Pharmacological BACE1 and BACE2 inhibition induces hair depigmentation by inhibiting PMEL17 processing in mice. Sci Rep. 2016;6:21917. doi: 10.1038/srep21917. [DOI] [PMC free article] [PubMed] [Google Scholar]
- 41.Garaschuk O. Imaging microcircuit function in healthy and diseased brain. Exp Neurol. 2013;242:41–49. doi: 10.1016/j.expneurol.2012.02.009. [DOI] [PubMed] [Google Scholar]
- 42.Stroh A, et al. Making waves: Initiation and propagation of corticothalamic Ca2+ waves in vivo. Neuron. 2013;77:1136–1150. doi: 10.1016/j.neuron.2013.01.031. [DOI] [PubMed] [Google Scholar]
- 43.de Cheveigné A, Edeline JM, Gaucher Q, Gourévitch B. Component analysis reveals sharp tuning of the local field potential in the guinea pig auditory cortex. J Neurophysiol. 2013;109:261–272. doi: 10.1152/jn.00040.2012. [DOI] [PubMed] [Google Scholar]