Significance
Cytotoxic T lymphocytes (CTLs) destroy virally infected and tumor cells through the directed secretion of specialized lysosomes called “lytic granules.” Because a single CTL must direct its cytotoxic activities only against specific targets but can sequentially kill multiple cells, granule secretion must be tightly controlled. We demonstrate here that dynamic regulation of the cortical actin cytoskeleton is critical for both the initiation and termination of secretion. We further link actin dynamics with phosphatidylinositol 4,5-bisphosphate (PIP2) levels and provide evidence that lytic granule delivery initiates cortical actin recovery and the cessation of secretion. Our results suggest that actin both regulates and is regulated by secretion, providing a mechanism by which CTLs control their ability to kill targets serially during immune responses.
Keywords: cytotoxic T lymphocytes, actin, lytic granule secretion, PIP2, RAB27a
Abstract
CD8+ cytotoxic T lymphocytes (CTLs) eliminate virally infected cells through directed secretion of specialized lytic granules. Because a single CTL can kill multiple targets, degranulation must be tightly regulated. However, how CTLs regulate the termination of granule secretion remains unclear. Previous work demonstrated that centralized actin reduction at the immune synapse precedes degranulation. Using a combination of live confocal, total internal reflection fluorescence, and superresolution microscopy, we now show that, after granule fusion, actin recovers at the synapse and no further secretion is observed. Depolymerization of actin led to resumed granule secretion, suggesting that recovered actin acts as a barrier preventing sustained degranulation. Furthermore, RAB27a-deficient CTLs, which do not secrete cytotoxic granules, failed to recover actin at the synapse, suggesting that RAB27a-mediated granule secretion is required for actin recovery. Finally, we show that both actin clearance and recovery correlated with synaptic phosphatidylinositol 4,5-bisphosphate (PIP2) and that alterations in PIP2 at the immunological synapse regulate cortical actin in CTLs, providing a potential mechanism through which CTLs control cortical actin density. Our work provides insight into actin-related mechanisms regulating CTL secretion that may facilitate serial killing during immune responses.
Cytotoxic CD8+ T lymphocytes (CTLs) are critical both for the elimination of cells infected with intracellular pathogens and for the surveillance of tumors. CTLs carry out their cytolytic functions through the directed secretion of lytic granules, specialized lysosomes that contain perforin and granzymes that induce death of target cells. Because a single CTL is capable of killing multiple target cells during an immune response (1, 2), CTLs are thought to act as “serial killers” (3). As such, CTLs need to regulate secretion tightly, both to kill only appropriate target cells on contact and to facilitate their ability to carry out serial responses. Data suggest that each CTL releases only a small number of granules per productive killing outcome (4–6). However, how CTLs regulate both the initiation and the termination of granule secretion during an individual CTL–target interaction is still not completely understood.
A dense meshwork of cortical actin abuts the plasma membrane and envelops the cytosol of animal cells. Acute reduction of cortical actin density has been shown to regulate the access of secretory granules to the plasma membrane and to facilitate secretion in a number of cell types (7, 8). Notably, CTL recognition of a target is accompanied by rapid changes in cortical actin, resulting in a dramatic reduction of actin density at the interface between the CTL and its target (9, 10). Moreover, this reduction in cortical actin in CTLs is spatially and temporally correlated with the secretion of lytic granules (10). Conversely, elevated cortical actin density at the immunological synapse has been correlated with defective lytic granule secretion (11, 12). Nonetheless, the extent to which the modulation of actin contributes to the regulation of secretion during later stages of T-cell–target interactions and the termination of secretion is largely unknown.
To explore further the role of the cortical actin cytoskeleton in regulating both the initiation and the termination of secretion of cytolytic granules in CTLs, we used 3D, multicolor, live-cell microscopy and total internal reflection fluorescence (TIRF) microscopy to examine the dynamics of cortical actin directly before, during, and after lytic granule secretion. Our results suggest that cortical actin density is tightly regulated either to permit or restrict access of lytic granules to the plasma membrane during target engagement. Furthermore, our data reveal a correlation between RAB27a-dependent secretion, the recovery of actin, and phosphatidylinositol 4,5-bisphosphate (PIP2) at the synapse, suggesting that the distribution of PIP2 in the membrane represents a potential mechanism by which CTLs regulate the density of cortical actin during cytolysis. Thus, by regulating the actin cytoskeleton, CTLs control both the initiation and termination of secretion, providing a potential mechanism to make them effective serial killers during an immune response.
Results
Cortical Actin Recovers at the Synapse Following Lytic Granule Secretion.
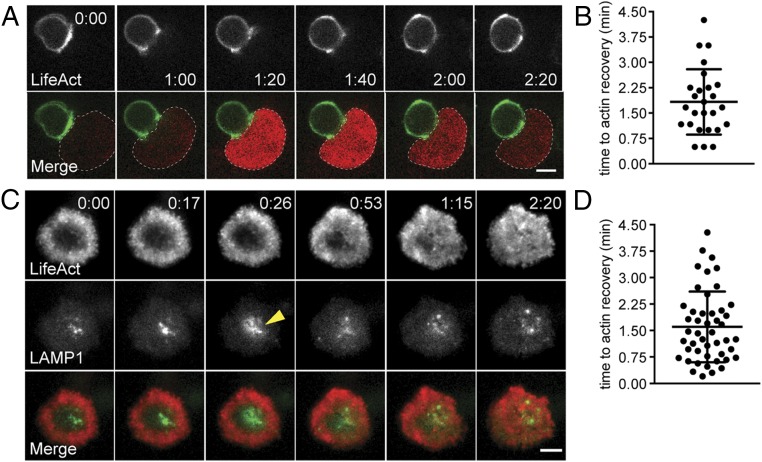
To evaluate cortical actin dynamics in the context of CTL cytolytic activity, we first used live-cell spinning-disk confocal microscopy to follow actin during the entire course of CTL interactions with their targets. CTLs were derived from OT-I T-cell receptor (TCR) transgenic mice that recognize a peptide from ovalbumin (OVA) and were used in conjunction with peptide-pulsed targets expressing the Ca2+ indicator GCaMP6m, whose intensity directly correlates with intracellular calcium ion concentrations (1, 13–15). Previous work has shown that calcium increases are associated with very early loss of membrane integrity, as occurs in target cells after CTLs secrete their lytic granules containing perforin, which leads to the formation of pores in the target cell membrane (15–19). Thus, the increase in GCaMP6 intensity in the targets was used as a surrogate readout of productive lytic granule secretion by CTLs. To visualize actin in real time, CTLs were transfected with Lifeact-mEmerald, a fluorescently labeled actin-binding protein that allows visualization of polymerized actin in live-cell imaging (20). Similar to previous results (6, 10), we saw a rapid reduction in cortical actin density at the synapse after CTL contact with target cells (at 0:00–1:00) (Fig. 1A and Movie S1; Fig. S1A and Movie S2). This reduction in density was followed by increased Ca2+ flux in targets (at 1:20) (Fig. 1A and Movie S1) that is consistent with the effects of the secretion of cytolytic granules by CTLs. Notably, once Ca2+ flux was observed in targets, cortical actin density recovered at the synapse in greater than 90% of the CTL–target conjugates (1:20–2:20) (Fig. 1A) within 1.83 ± 0.96 min (mean time ± SD) following the initiation of GCaMP6 fluorescence (Fig. 1B). Thus, cortical actin appears to recover in CTLs after the directed secretion of cytolytic granules in cell conjugates.
Fig. 1.
Cortical actin recovery at the CTL synapse follows lytic granule secretion. (A) Spinning-disk confocal time-lapse images of an OT-I CTL expressing Lifeact-mApple (pseudocolored in green) in conjugate with an EL4 target cell expressing GCaMP6m pulsed with 1 μM OVA257–26 (highlighted by the dotted line). (Upper Row) Images showing signal from the Lifeact channel in a single slice correspond to the center of the synapse and are shown in gray scale. (Lower Row) GCaMP6m fluorescence (red) corresponds to an increase in Ca2+ in the target cell. Images are representative of n = 26 cells from five independent experiments. Time in figure is shown in minutes:seconds. (Scale bar: 5 μm.) (B) The graph shows the time to actin recovery in CTLs following the initiation of GCaMP6m fluorescence in the targets. (C) TIRF images of an OT-I CTL expressing Lifeact-mApple (red) and LAMP1-EGFP (green) degranulating on anti-CD3–coated glass surfaces. Signal from the Lifeact channel (Top Row) and from the LAMP1-EGFP channel (Middle Row) is shown in gray scale. Merged images are shown (Bottom Row). The yellow arrowhead indicates a degranulation event. Data are representative of n = 65 cells from nine independent experiments. Time in figure is shown in minutes:seconds. (Scale bar: 5 μm.) (D) The graph shows the time to actin recovery in CTLs following fusion of the last granule in TIRF movies.
Fig. S1.
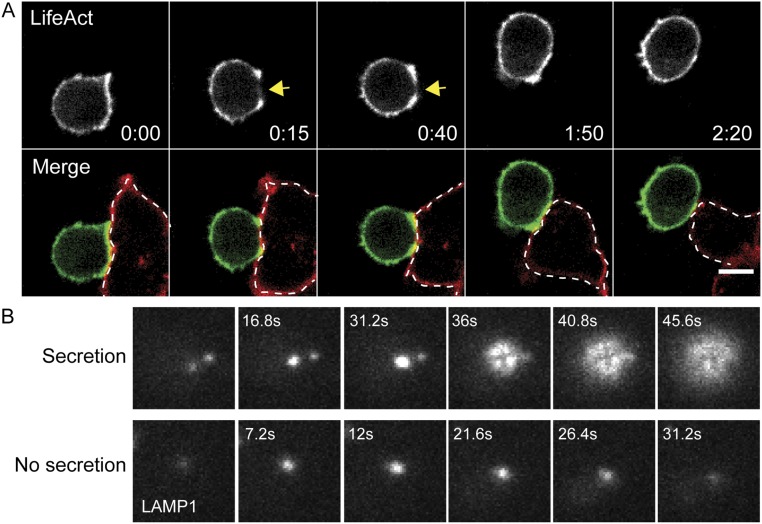
Cortical actin at the synapse during CTL–target interactions and examples of granule fusion in TIRF. (A) Spinning-disk confocal time-lapse images of an OT-I CTL expressing Lifeact-mEmerald (Top, grayscale) interacting with an EL4 target cell expressing TagRFP-MEM pulsed with 1 μM OVA257–26 (merged images, CTL in green, target in red highlighted by dotted line). (Upper Row) Images in gray scale showing signal from the Lifeact (488) channel in a single slice correspond to the center of the synapse. Yellow arrowheads highlight an area of reduced cortical actin density. Images are representative of n = 11 cells from three independent experiments. (B) Time-lapse TIRF images of a CTL expressing LAMP1-EGFP comparing the fluorescence signal of a secreting lytic granule (Upper Row) with a lytic granule in a cell moving into the TIRF field but with no secretion (Lower Row).
Cortical Actin Recovery Correlates with Lytic Granule Secretion.
To evaluate the relationship between actin dynamics and lytic granule secretion more fully, we applied a TIRF-based imaging approach to T-cell activation on a planar surface, permitting a rapid, high-resolution view of the T-cell synapse throughout stimulation; this approach was suitable for imaging granule fusion at the plasma membrane (21). To follow the fate of lytic granules, CTLs were cotransfected with Lifeact-mApple and LAMP1-EGFP, a marker for lytic granules (10). Cells were activated on anti-CD3–coated glass, allowing us to visualize cortical actin density and lytic granule secretion simultaneously over time. Upon engagement by anti-CD3, we observed a rapid reduction in cortical actin density at the center of the synapse, giving rise to a ring-like actin structure (Fig. 1C, Upper Far Left), as previously reported (6, 10). This reduction in actin density was followed by the movement of lytic granules into the TIRF field (Fig. 1C and Movie S3). At various points after the appearance of granules, we observed the rapid diffusion of the LAMP1-EGFP fluorescent signal as the granule fused with the plasma membrane; this fusion appeared as a burst of fluorescence that rapidly diffused and disappeared (Fig. 1C, 0:26 and Movie S3). This phenomenon was distinct from lytic granules moving out of the TIRF field; such movement was not associated with diffusion of the EGFP signal in the plasma membrane (Fig. S1B). Notably, TIRF imaging confirmed that, after degranulation, cortical actin density recovered across the immunological synapse (Fig. 1C, Lower Far Right).
To follow the kinetics of actin and degranulation, we focused on cells that were captured before actin had cleared or early enough after clearance that lytic granules had not yet appeared in the TIRF field. Cells included in our analyses exhibited a contact interface that was large enough so that granule-secretion events were sufficiently spatially separated for accurate quantification. Over time, 78% (51/65) of cells meeting this criteria degranulated, as indicated by the diffusion of LAMP1-EGFP in the plasma membrane, with an average of 3.8 ± 2.9 (mean ± SD) granules fused per cell. Of the 51 cells in which we observed degranulation, 94% (48/51) recovered cortical actin across the synapse within the 20-min window in which they were imaged in TIRF. In contrast, of the 14 cells that had not visibly degranulated, only 14% (2/14) recovered cortical actin within the same time period. The time to actin recovery following fusion of the last granule in TIRF was 1.6 ± 1.0 min (mean ± SD) (Fig. 1D), which closely approximates the time to actin recovery observed in our live-cell imaging (Fig. 1B). This recovery of cortical actin density in the center of the synapse contrasts with studies in Jurkat and CD4+ cells, which do not secrete lytic granules and in which actin rings are maintained for >40 min (21, 22). Interestingly, we noted that although granules could still be seen in the TIRF field behind the recovered cortical actin meshwork, once actin recovered, fusion was no longer observed. Thus, secretion occurred only during the period of actin clearance, actin recovery occurred after secretion, and once actin density recovered, secretion was no longer observed.
High-Resolution Visualization of Recovered Actin at the Synapse.
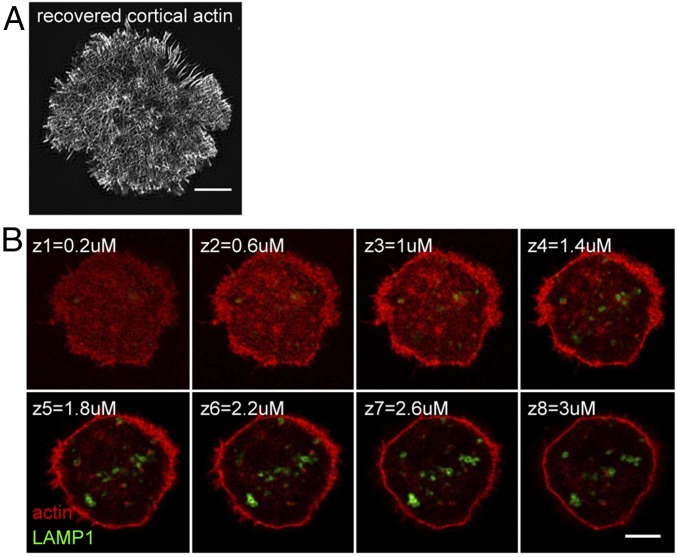
To evaluate the relationship between actin and lytic granules further, we turned to structured illumination microscopy (SIM) in conjunction with a TIRF-based imaging system (TIRF-SIM) (23) to visualize the recovered cortical actin network. OT-I CTLs expressing LAMP1-GFP were plated on anti-CD3–coated coverslips and fixed after 10 min, a time when most cells had already secreted lytic granules and recovered a dense cortical actin network across the synapse, as visualized by phalloidin staining (Fig. 2A). Notably, 3D reconstruction of SIM (3D-SIM) of phalloidin-stained CTLs expressing LAMP1-EGFP revealed that granules were localized behind the rich cortical actin meshwork (Fig. S2 and Movie S4). Granule positioning behind the actin barrier was also evident in successive z stacks obtained using a confocal system fitted with an Airyscan module that increases resolution (Fig. 2B and Movie S5). These results raise the possibility that recovered cortical actin could serve as a physical barrier.
Fig. 2.
High-resolution visualization of recovered actin at the synapse. (A) Representative TIRF SIM image of recovered cortical actin in a phalloidin-stained OT-I CTL fixed 10 min after stimulation on an anti-CD3–coated glass surface. (Scale bar: 3 μm.) (B) Successive 0.4-μm z-stack images obtained via Airyscan of an OT-I CTL expressing LAMP1-EGFP (green) and phalloidin-stained to visualize actin (red), fixed 10 min after stimulation on an anti-CD3–coated glass surface. (Scale bar: 5 μm.) Images are representative of n = 14 from three independent experiments.
Fig. S2.
3D-SIM of recovered actin and lytic granules at the synapse. (A) Representative 3D-SIM projection of recovered cortical actin in a phalloidin-stained OT-I CTL expressing LAMP1-EGFP fixed 10 min after stimulation on an anti-CD3–coated glass surface. (B) 3D SIM image rotated 90° in the z plane to visualize actin (Top, grayscale), LAMP1 (Middle, grayscale), or the merged image (Bottom) showing LAMP1+ granules on the cytosolic side of recovered cortical actin. Granules are highlighted by a yellow dotted line in the LAMP1 panel. (Scale bars: 5 μm.) Dashed white lines numbered 1, 2, and 3 in the merged image of B demarcate the areas of the line scan graphs shown below (dashed line 1 demarcates linescan 1; dashed line 2 demarcates linescan 2; dashed line 3 demarcates linescan 3) showing phalloidin (red) and LAMP1 (green) pixel intensities across the region of interest. Data are representative of n = 5 cells from two independent experiments. AU, arbitrary units.
Cortical Actin Acts as a Barrier to Prevent Secretion.
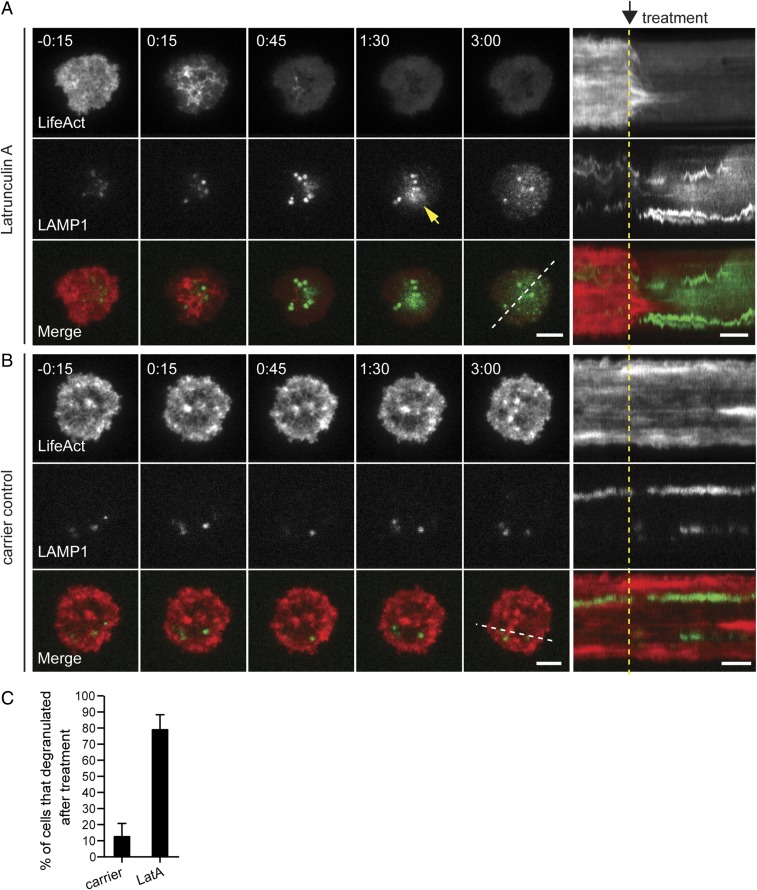
The high-resolution view of cortical actin at the synapse, in conjunction with the temporal correlation between actin recovery and the cessation of secretion, suggested to us that the recovered cortical actin could serve as a mechanism for regulating secretion in CTLs. To test this hypothesis, OT-I CTLs expressing Lifeact-mApple and LAMP1-EGFP were allowed to interact with anti-CD3–coated glass, secrete lytic granules, and recover cortical actin. At this point, cells were treated with a carrier control or with Latrunculin A (LatA) to depolymerize actin and were monitored using time-lapse TIRF microscopy to observe the effects of treatment on lytic granule secretion. After treatment with LatA (0:00) (Fig. 3A and Movie S6), we saw a rapid reduction in the intensity of cortical actin (0:15–0:45), demonstrating disassembly of the actin network. The reduction in cortical actin density was followed by lytic granule movement closer to the plasma membrane in the TIRF field, indicated by an increase in LAMP1-EGFP fluorescence intensity (0:45) (Fig. 3A and Movie S6). Moreover, within 1 min of the increase in EGFP intensity, lytic granule secretion was again observed at the plasma membrane, as indicated by the diffusion of EGFP in the TIRF plane (1:30) (Fig. 3A and Movie S6). Evidence of this diffusion was also seen in the accompanying kymographs, which allowed visualization of fluorescence signal under a region of interest over time in the form of a line drawn across the cell. In contrast, cortical actin density in carrier-treated cells remained relatively stable across the synapse, as demonstrated by the maintenance of the Lifeact-mApple fluorescent signal over time in kymographs. Although granules could be seen moving in and out of the TIRF field, the lack of LAMP1-EGFP diffusion into the plasma membrane throughout the kymograph and movies indicated that granule fusion had not occurred (Fig. 3B and Movie S7). Removal of the cortical actin barrier resulted in secretion in 78.9 ± 9.4% of cells compared with secretion in only 12.5 ± 8.2% of cells treated with a carrier control (Fig. 3C). These results suggest that recovered actin does indeed act as a barrier that effectively prevents sustained lytic granule secretion in CTLs.
Fig. 3.
Removal of cortical actin permits secretion in CTLs. (A and B, Left) Time-lapse TIRF images show an OT-I CTL expressing Lifeact-mApple (gray scale) (Top Rows), LAMP1-EGFP (gray scale) (Middle Rows), and merged channels (Lifeact-mApple: red; LAMP1-EGFP: green) (Bottom Rows) that already had secreted and recovered actin in response to anti-CD3–coated glass (−0:15) and then were treated at 0:00 with 1 μM LatA (A) or with ethanol (EtOH), the carrier control (B). A degranulation event in A is indicated by a yellow arrowhead. (A and B, Right) Kymographs of movies: Fluorescence under a five-pixel-thick region of interest (dashed white line) is displayed over time. Dashed yellow lines indicate the time of treatment addition. (Scale bars: 5 μm in still TIRF images and 2 min in kymographs.) Time is shown in minutes:seconds. (C) The graph depicts the percentage of cells that degranulated after treatment with carrier or LatA (mean ± SD). n = 16 carrier-treated cells and n = 19 LatA-treated cells from three independent experiments.
Pharmacological Inhibition of Phospholipase C Gamma 1 Inhibits Actin Clearance in CTLs.
The regulation of secretion by the actin cytoskeleton raised the question of which factors contribute to the control of actin cytoskeletal dynamics at the CTL–target interface. One factor known to regulate cortical actin density is PIP2 (7, 24–26), which can bind and activate a variety of actin-regulatory proteins (reviewed in ref. 27). We have previously described a correlation between the reduction in cortical actin density at the immunological synapse and decreased levels of PIP2 (10).
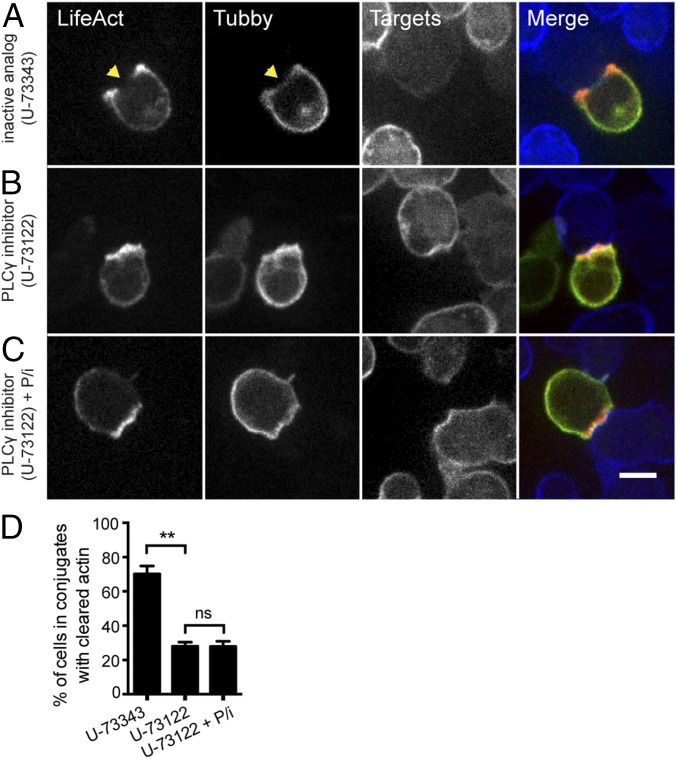
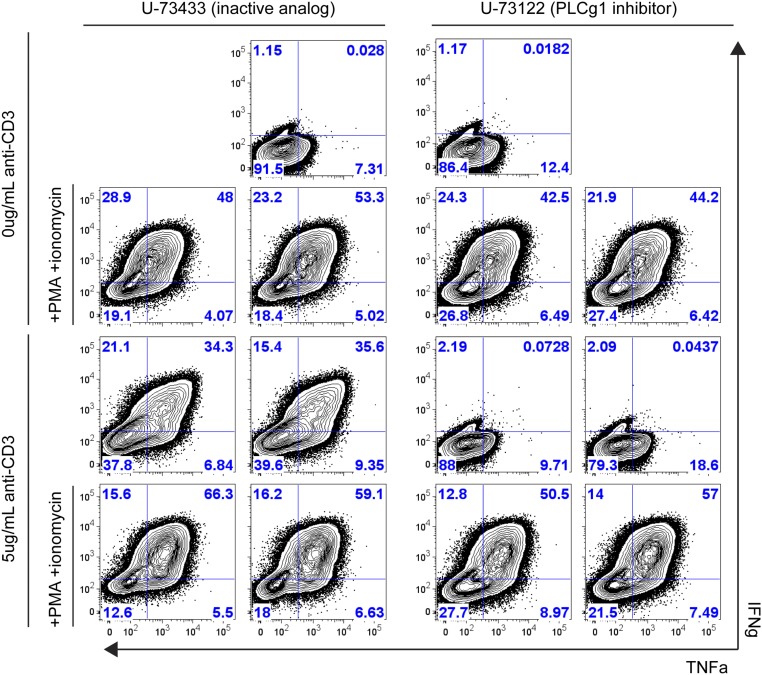
To evaluate whether PIP2 directly affects actin at the synapse, we first tried to alter levels of PIP2 pharmacologically in CTLs. One of the key enzymes downstream of the TCR is phospholipase C gamma 1 (PLCγ1), which cleaves PIP2 into inositol 1,4,5-triphosphate (IP3) and diacylglycerol (DAG), two critical intermediates required for T-cell activation that trigger Ca2+ flux and cell polarization changes, respectively (2, 28, 29). To address whether inhibition of PLCγ1 could modify local levels of its substrate, PIP2, at the synapse, we cotransfected CTLs with Lifeact-mApple and a sensor expressing the PIP2-binding domain of Tubby fused to EGFP (Tubby-EGFP) (30, 31). We then pretreated cells with either U-73122, an inhibitor of PLCγ1 activity, or U-73343, an inactive analog (32), and allowed CTL–target conjugates to form before fixation. Although cells treated with the inactive analog showed reduced Tubby-EGFP fluorescence (Fig. 4A), indicative of decreased PIP2 at the synapse, U-73122–treated cells maintained uniform Tubby-EGFP fluorescence at the CTL–target interface (Fig. 4B). Strikingly, treatment with U-73122, but not the U-73343 control, also prevented clearance of cortical actin at the synapse (Fig. 4 A and B). To rule out the possibility that the effects of PLCγ1 inhibition on cortical actin dynamics were secondary to defective generation of the second messengers IP3 and DAG, we allowed PLCγ inhibitor-treated CTLs to interact with target cells and then added phorbol 12-myristate 13-acetate (PMA) and ionomycin, which pharmacologically rescue DAG and Ca2+ flux-mediated effects, respectively. Incubation with PMA and ionomycin in the presence of U-73122 failed to restore cortical actin clearance in CTLs (Fig. 4C), despite increasing expression of IFNγ and TNFα under the same conditions (Fig. S3). These results suggest that TCR-triggered PLCγ1 activation both decreases PIP2 levels and contributes to the regulation of cortical actin density at the cytolytic synapse.
Fig. 4.
Pharmacological inhibition of PLCγ inhibits actin clearance in CTLs. (A–C) Representative spinning-disk images of OT-I CTLs expressing Lifeact-mApple (red) and Tubby-EGFP (green) interacting with 1 μM OVA257–26 peptide-pulsed EL4-Farnesyl-TagBFP2 target cells (blue) in the presence of 1 μM U-73343 inactive analog control (total n = 175) (A), 1 μM U-73122 PLCγ inhibitor (total n = 184) (B), or 1 μM U-73122 plus PMA and ionomycin (P/i) at 20 ng/mL and 1 μg/mL, respectively (total n = 140) (C). Lifeact-mApple and Tubby-EGFP channels are shown in gray scale. (Scale bar: 5 μm.) Regions of fluorescence depletion are indicated by yellow arrowheads. (D) The graph depicts the percentage of cells in conjugates with recovered actin (mean ± SD) from more than three independent experiments. **P < 0.01, Student’s t test; ns, not significant.
Fig. S3.
CTL function in U-73122–treated CTLs is rescued by PMA/ionomycin. Intracellular cytokine production is inhibited in U-73122–treated CTLs but is rescued by PMA plus ionomycin treatment in the presence of the inhibitor. In vitro-activated OT1 CTLs were treated with either U-73122 or U-73433 control (both at 1 μM final concentration) and were stimulated for 6 h with 5 μg/mL plate-bound anti-CD3 or were left unstimulated as a control ± PMA (20 ng/mL final concentration) and ionomycin (1 μg/mL final concentration). Data shown are representative of two independent experiments.
Acute PIP2 Ablation Results in the Rapid Disassembly of Cortical Actin Meshwork.
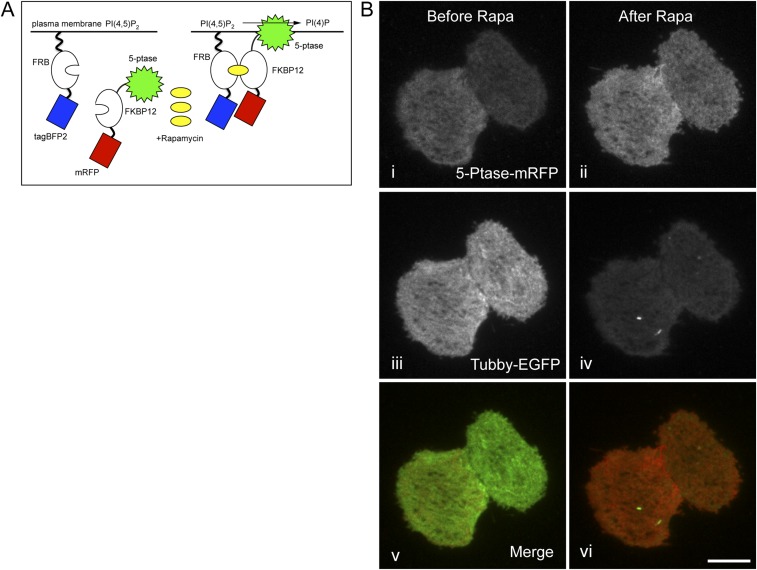
To test more directly whether altering PIP2 levels affects cortical actin density, we used an inducible system that allows the selective ablation of PIP2 from the membrane (33). Rapamycin treatment of cells transfected with components of this system induces dimerization of a membrane-tagged FRB-BFP (FK506-binding protein rapamycin-binding–blue fluorescent protein) with a cytosolic mRFP-FKBP12 (monomeric red fluorescent protein-12 kDa FK506 binding protein) fused to the catalytic domain of inositol lipid-5-phosphatase E (5-ptase), which converts PIP2 into phosphatidylinositol 4-phosphate (PI4P), thereby recruiting the 5-ptase to the plasma membrane and effectively ablating PIP2 there (Fig. S4A). This system has been used previously to look at the effects of PIP2 depletion on actin-mediated membrane ruffling (33) and clathrin-coated pit formation (34) but has not been used in conjunction with Lifeact to examine cortical actin integrity directly in real time.
Fig. S4.
5-Ptase recruited by a rapamycin-inducible dimer system reduces levels of PIP2 in the plasma membrane. (A) Schematic of the inducible dimer system for the manipulation of plasma membrane-localized PIP2. A cytosolic 5-ptase linked to mRFP is recruited to the plasma membrane via rapamycin-dependent heterodimerization of FKBP12 with membrane-bound FRB. (B) Representative TIRF images of COS7 cells expressing mRFP-FKBP12-5-ptase (i and ii), Tubby-EGFP (iii and iv), and tagBFP2-FRB-PM (not pictured) before treatment with rapamycin (i, iii, and v) and after treatment (ii, iv, and vi). Merged before and after images are shown in v and vi, respectively (Scale bar: 10 μm.)
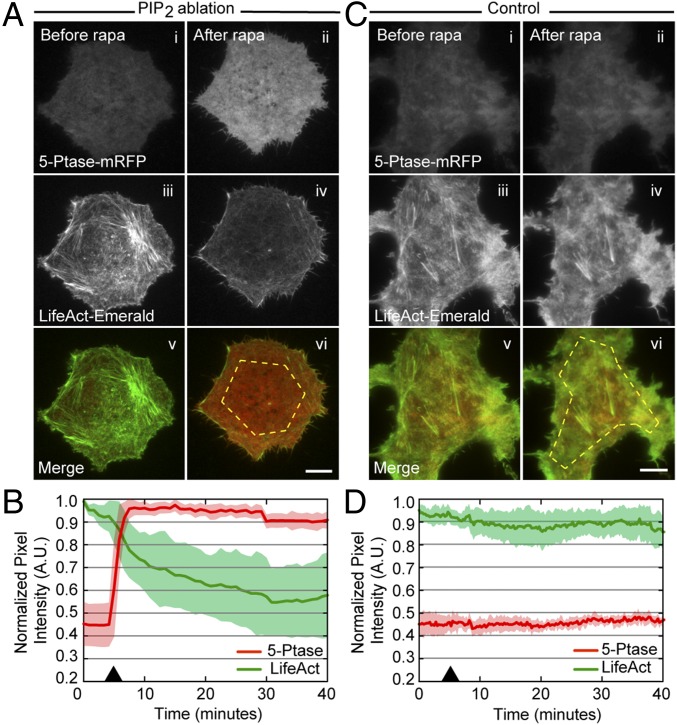
To monitor the effects of acute modulation of PIP2 directly using live-cell imaging, we coexpressed the fluorescent reporters Tubby-EGFP or Lifeact-mEmerald with components of the inducible dimerization system. Because we were unable to obtain sufficient expression levels of these constructs in primary murine OT-I CTLs, we performed these experiments in Cos7 cells, in which we could reproducibly coexpress all components at levels adequate for visualization using TIRF. The addition of rapamycin led to an immediate increase in the intensity of mRFP in the TIRF field, indicating that the 5-ptase was recruited to the plasma membrane (Fig. 5A and Fig. S4B). This increased intensity of 5ptase-mRFP was associated with a rapid reduction in the Tubby-EGFP signal, consistent with lower PIP2 levels (Fig. S4B and Movie S8). Furthermore, in cells coexpressing Lifeact-mEmerald with the inducible system, we observed a rapid loss of cortical actin density following recruitment of the mRFP-tagged 5-ptase to the plasma membrane. (Fig. 5 A and B and Movie S9). In contrast, cells transfected with an FRB construct that failed to recruit the 5-ptase to the plasma membrane did not exhibit changes in cortical actin (Fig. 5 C and D and Movie S10). Thus, acute manipulation of PIP2 results in rapid changes in cortical actin density at the plasma membrane.
Fig. 5.
Ablation of PIP2 at the membrane results in the loss of cortical actin density and integrity. (A and C) Shown are representative TIRF images of Cos7 cells expressing tagBFP2-FRB-PM, mRFP-5-ptase-FKBP12, and Lifeact-mEmerald (A) or tagBFP2-FKBP12-PM, mRFP-5-ptase-FKBP12, and Lifeact-mEmerald (C), either before (Left, i, iii, and v) or after (Right, ii, iv, and vi) rapamycin treatment. Fluorescence signals from mRFP-5-ptase (i and ii), Lifeact-mEmerald (iii and iv), and merged channels (v and vi) are shown. Dashed yellow lines in A, vi and C, vi highlight the area from which the intensity of the cell was measured. (Scale bars: 10 μm.) (B and D) Quantification of the fluorescence intensity of mRFP-5-ptase (red line) and Lifeact-mEmerald (green line) during PIP2 ablation (n = 14) (B) or control conditions (D) (n = 8). Black arrowheads indicate the time of rapamycin addition. The solid line indicates the mean of the data, and the shaded area indicates the SE. A.U., arbitrary units.
PIP2 Levels Correlate with Cortical Actin Recovery at the Synapse.
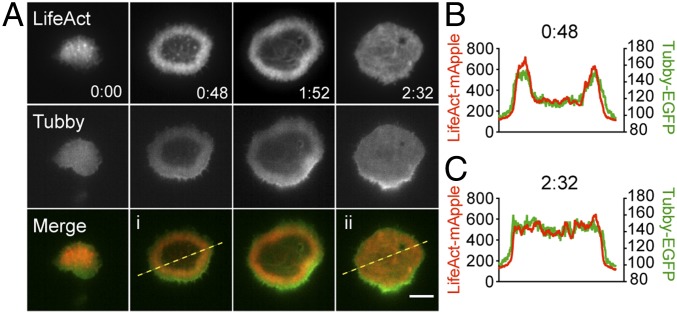
To evaluate whether there was a similar correlation between actin and PIP2 during the recovery of cortical actin density at the synapse, we cotransfected CTLs with Lifeact-mApple and Tubby-EGFP (30, 31) and performed TIRF imaging on CTLs as they formed synapses on a planar activating surface. At early time points during interaction with anti-CD3–coated surfaces, we observed that the reduction in cortical actin density at the center of the synapse was concurrent with a reduction in levels of PIP2, consistent with our previous CTL–target conjugate imaging (Fig. 6A and Movie S11). Moreover, as cortical actin recovered at the synapse, we observed a concomitant recovery of Tubby-EGFP. Line scans confirmed the colocalization of fluorescence intensity for these two markers across the synapse at both early and late time points (Fig. 6). These data suggest that PIP2 levels correlate not only with the reduction in cortical actin density during early interactions but also with the recovery of cortical actin across the synapse over time.
Fig. 6.
PIP2 correlates with cortical actin clearance and recovery at the synapse. (A) Representative TIRF images of an OT-I CTL expressing Lifeact-mApple (red) and Tubby-EGFP (green) interacting with an anti-CD3–coated glass. Lifeact (Top Row) and Tubby-EGFP (Middle Row) are shown in gray scale. Merged images (Bottom Row). (B and C) Dashed yellow lines in Ai and Aii indicate the area from which line scans at 0:48 (B) and at 2:32 (C) are derived, showing Lifeact (red) and Tubby-EGFP (green) intensities across the region of interest. n = 11 cells from four independent experiments. (Scale bar: 5 μm.) Time is shown in minutes:seconds.
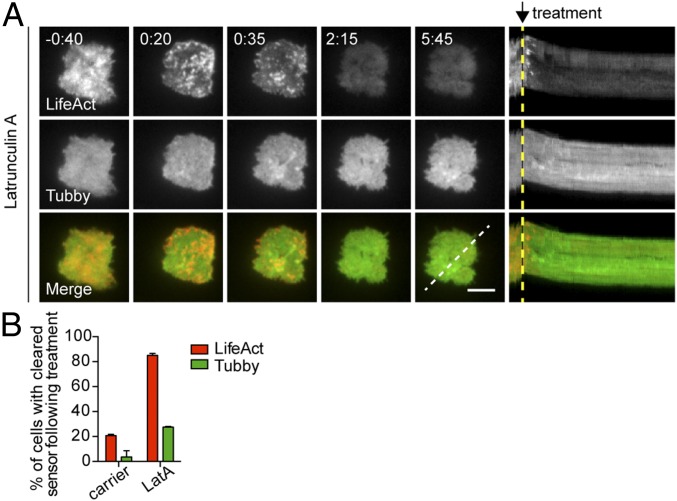
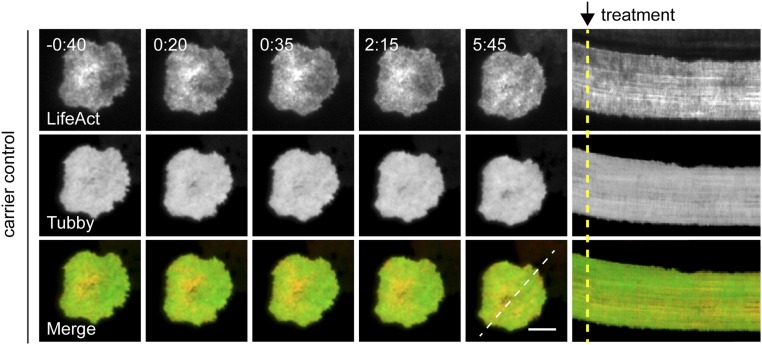
Finally, to confirm that PIP2 recovery was not secondary to actin recovery, we treated CTLs after actin recovery with LatA as previously described in Fig. 3. Although treatment with LatA led to the rapid reduction of intensity of cortical actin, we did not observe changes in PIP2 levels at the synapse (Fig. 7 A and B and Movie S12; also see carrier controls in Fig. S5 and Movie S13). Thus, altering actin did not affect PIP2 levels, whereas manipulation of PIP2 led to dramatic changes in the cortical actin cytoskeleton. Together, these data suggest that PIP2 acts upstream of actin to regulate the cortical actin meshwork.
Fig. 7.
Removal of recovered cortical actin does not affect PIP2 at the synapse. (A, Left) Time-lapse TIRF images of an OT-I CTL expressing Lifeact-mApple (gray scale, Top Row) and Tubby-EGFP (gray scale, Middle Row) or merged channels (Bottom Row) that already had secreted and recovered actin in response to anti-CD3–coated glass surfaces (−0:40) and then were treated at 0:00 with 1 μM LatA. (Right) Kymographs of movies. Fluorescence under a three-pixel-thick region of interest (dashed white line) is displayed over time. Dashed yellow lines indicate the time of treatment addition. (Scale bar: 5 μm.) Time is shown in minutes:seconds. (B) The graph depicts the percentage of cells that cleared reporter (Lifeact, red bars or PIP2, green bars) at the membrane after treatment with carrier or LatA. Data are shown as mean ± SD from three independent experiments; n = 19 for carrier-treated cells; n = 81 LatA-treated cells.
Fig. S5.
Carrier control experiment for LatA treatment of CTLs expressing Lifeact-mApple and Tubby-EGFP. (Left) Time-lapse TIRF images of OT-I CTLs expressing Lifeact-mApple (gray scale, Top Row), Tubby-EGFP (gray scale, Middle Row), or merged channels (Bottom Row) that had already secreted and recovered actin in response to anti-CD3–coated glass surfaces (−0:40) and then were treated at 0:00 with EtOH, the carrier control for LatA. (Right) Kymographs of movies: Fluorescence under a three-pixel-thick region of interest (dashed white line) is displayed over time. Dashed yellow lines indicate the time of treatment addition. (Scale bar: 5 μm.) Time is shown in minutes:seconds.
Secretion-Deficient Rab27aash/ash CTLs Show Impaired Actin Recovery.
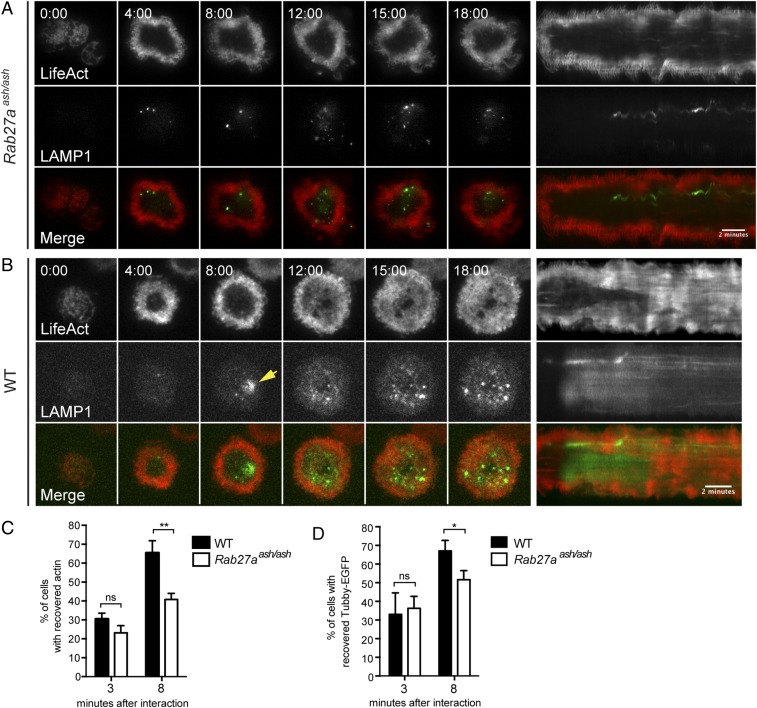
In both live confocal and TIRF imaging of CTLs we noted that cortical actin density recovered within 2 min following lytic granule secretion. These observations suggested to us that granule secretion itself may play a role in actin recovery. To test this hypothesis, we evaluated actin recovery in CTLs that were unable to secrete granules because of a mutation affecting RAB27a, a critical component of lytic granule-docking machinery. Activation of both WT and RAB27a-deficient (Rab27aash/ash) cells on anti-CD3–coated glass led to a rapid reduction in cortical actin density, followed shortly by the appearance of lytic granules within the TIRF field (Fig. 8 A and B and Movies S14 and S15). As expected, degranulation was not observed in Rab27aash/ash CTLs, as evidenced by a lack of diffusion of LAMP1-EGFP in TIRF (Fig. 8A). Remarkably, cortical actin density also did not recover in most RAB27a-deficient cells (Fig. 8A and Movie S14). Kymographic analyses confirmed that in secretion-deficient CTLs the area of reduced actin cortical density persisted throughout the duration of the 20-min movie whereas in WT CTLs cortical actin density recovered following secretion (Fig. 8 A and B, Right).
Fig. 8.
Secretion-deficient Rab27aash/ash CTLs show impaired actin recovery. (A and B) Representative time-lapse TIRF images (Left) and kymographs of movies (Right) of Rab27aash/ash (A) or WT (B) CTLs expressing Lifeact-mApple (red) and LAMP1-EGFP (green) interacting with anti-CD3–coated glass. Gray scale images for Lifeact (Top Rows) and LAMP1 (Middle Rows) are included; Bottom Rows show merged channels. A yellow arrowhead in B highlights the degranulation event in the WT panel. (Scale bar: 2 min in kymographs.) Time is shown in minutes:seconds. n = 6 WT CTLS and n = 9 Rab27aash/ash CTLS from three independent experiments. (C) The graph represents the percentage of WT (black bars) or Rab27aash/ash (white bars) cells with recovered actin at 3 min and 8 min after interaction with an anti-CD3–coated glass. Data are shown as mean ± SD. For the 3-min time point, n = 1,791 WT cells and n = 1,418 Rab27aash/ash cells. For the 8-min time point, n = 3,123 WT and n = 3,054 Rab27aash/ash cells, both from three independent experiments. **P < 0.01; Student’s t test; ns, not significant. (D) The graph represents the percentage of WT (black bars) or Rab27aash/ash (white bars) cells with recovered PIP2 at 3 min and 8 min after interaction with an anti-CD3–coated glass (mean ± SD). For the 3-min time point, n = 282 WT and n = 299 Rab27aash/ash cells. For the 8-min time point, n = 288 WT and n = 248 Rab27aash/ash cells. Actin and PIP2 were quantitated from two different sets of three independent experiments. *P < 0.05, Student’s t test; ns, not significant.
To quantitate actin recovery in the cell population more accurately, WT or Rab27aash/ash CTLs were allowed to interact with anti-CD3–coated glass and were fixed at either an early (3 min, before granule secretion in WT CTLs) or a later (8 min, after granule secretion is expected to have occurred in most WT CTLs) time point. Phalloidin staining of fixed cells revealed that although most WT CTLs had recovered actin across the synapse after 8 min, secretion-deficient Rab27aash/ash CTLs failed to recover actin as well as their WT counterparts (Fig. 8C). Similarly, evaluation of Tubby-EGFP in cells revealed that RAB27a-deficient CTLs did not fully recover PIP2 across the synapse (Fig. 8D). Although we cannot rule out distinct effects of RAB27a, the observation that cortical actin does not recover in these cells suggests that lytic granule secretion might be a controlling mechanism that drives cortical actin recovery in CTLs. Taken together, our results support the idea that actin reorganization may be a critical step in both initiating and limiting CTL secretion.
Discussion
Studies of CTL–target interactions have revealed an exquisite regulation of cortical actin density at the immunological synapse, whereby cortical actin density is rapidly reduced specifically at interfaces between T cells and targets before lytic granule secretion (9, 10). Here, we monitored cortical actin throughout the duration of TCR-triggered responses in the context of secretion and demonstrate that granule fusion in CTLs is consistently followed by the recovery of cortical actin across the immunological synapse. Our results suggest that recovered cortical actin may act as a barrier to limit granule secretion during a discrete CTL–target encounter and, furthermore, that recovery itself is triggered upon granule fusion, providing a mechanism that facilitates serial killing during an immune response. We also show that both clearance and recovery of cortical actin occurs concomitantly with complementary changes in PIP2, suggesting that PIP2 plays a role in tuning cortical actin density at the synapse in CTLs.
The role of actin in secretion has been studied in many cell types specializing in exocytosis, including natural killer (NK) cells (35–37), mast cells (7), pancreatic β cells (38), and adrenal chromaffin cells (39, 40). One model, known as the “barrier model,” suggests that the actin cortex acts physically to prevent vesicles from coming in close enough proximity to the plasma membrane for fusion to occur (38). This model is supported by evidence that actin prevents the access of granules and fusion machinery to the plasma membrane in chromaffin cells (41). Although we have not been able to stabilize actin before lytic granule secretion, because of the effects of actin-stabilizing agents such as Jasplakinolide on TCR signaling (42, 43) and T-cell adhesion (44), our observations suggest that the recovery of actin in CTLs after granule fusion may limit the access of lytic granules to the plasma membrane, thus preventing further secretion. This hypothesis is supported by our experiments showing that the removal of this cortical actin barrier using the actin depolymerization agent LatA resulted in resumed fusion of lytic granules. Thus, as in other cell types, cortical actin may form a barrier that blocks secretion in CTLs.
It has been suggested that actin plays an active role in lytic granule secretion, because lytic granules of NK cells appear preferentially localized in small areas of actin hypodensity but still within a meshwork of actin across the synapse (35, 36). In contrast, live-cell imaging of CTLs shows that granule secretion occurs in an area of actin depletion across the synapse (9); whether remaining actin filaments might play a role in secretion remains to be seen. In this paper we provide evidence that cortical actin density at the synapse recovers in CTLs and acts as a barrier to block the access of granules to the plasma membrane, preventing sustained secretion. Whether dense actin networks also act as a barrier in NK cells is not known. It will be interesting to see whether similar mechanisms for cortical actin regulation of secretion also hold true for directional vs. nondirectional secretion in T cells of other factors, such as cytokines, which rely on similar stimuli but are found in different vesicular compartments.
The observation that cortical actin density recovered across the synapse during CTL–target interactions led us to explore what regulates actin dynamics in CTLs. Studies in macrophages report that the disassembly of actin around newly formed phagosomes correlated with the loss of PIP2 (45). Actin cytoskeletal dynamics during phagocytosis in macrophages has been compared with immunological synapse formation in CTLs (refs. 46 and 47 and reviewed in ref. 48). Indeed, multiple reports suggest that T cells take up surface molecules from the membrane of cells with which they interact (6, 49). We therefore hypothesized that, as in macrophages, PIP2 has a role in regulating actin disassembly in CTLs. In agreement with this hypothesis, we previously showed that loss of cortical actin density at the synapse correlates with a reduction in PIP2 (10). Our study now further suggests that during TCR engagement PIP2 levels at the T-cell synapse can be modulated by PLCγ1 activity. Although we cannot rule out other effects of the PLCγ1 inhibitor U-73122, treatment with PMA and ionomycin failed to rescue actin clearance, suggesting that these observations were independent of DAG- or Ca2+-mediated effects. Indeed, PLCγ1 is recruited to and activated at TCR-triggered signaling complexes at the plasma membrane (50), making PLCγ1-mediated modulation of PIP2 levels an attractive potential mechanism for regulating actin dynamics at the synapse. Moreover, our work now reveals that the recovery of actin also coincides with the recovery of PIP2.
We further provide evidence that processes involved in granule secretion itself may trigger the recovery of cortical actin at the synapse in CTLs. CTLs from ashen mice, which have a mutation leading to the loss of RAB27a, are unable to secrete lytic granules and kill target cells (51–53). In these CTLs, cortical actin density remained reduced at the immunological synapse long after most WT CTLs had degranulated and recovered their cortical actin. Although we cannot rule out a direct effect of RAB27a on actin, these results raise the possibility that secretion itself may play a role in the recovery of actin at the synapse in CTLs. Interestingly, mutations in RAB27A in humans lead to Griscelli syndrome type 2, a primary immunodeficiency associated with defective cytolysis and hemophagocytic lymphohistiocytosis, in which IFNγ from hyperactivated CTLs leads to excessive activation of macrophages. Our observations raise the possibility that the hyperactivation of CTLs in Griscelli syndrome type 2 may result in part from the effects of altered actin dynamics on continued T-cell activation.
Although we demonstrate here that secretion-impaired, RAB27a-deficient CTLs do not recover actin as well as secretion-competent CTLs, it is not clear how granule fusion might trigger actin recovery at the synapse in CTLs. The fusion of lytic granules at the immunological synapse introduces new integral membrane proteins into the plasma membrane, including LAMP1 and LAMP2, which have large, heavily glycosylated ectodomains that could conceivably force apart the membranes between CTLs and their targets and thereby permit inhibitory phosphatases such as CD45 access to abbreviate TCR signaling (54). In turn, the abbreviation of TCR signaling could allow the reaccumulation of PIP2 through enzymatic activity or diffusion. Alternatively, fusion of granules may directly alter enzymes affecting phosphoinositide distribution or generation in the plasma membrane and thereby influence cortical actin density. It is also notable that after lytic granule secretion there is a rapid uptake of lytic granule membrane components, suggesting a coupling of exocytosis and endocytosis. Because endocytosis has been linked to changes in PIP2 and in the distribution of other phosphoinositides in other cell types, our results suggest an intriguing potential linking of exocytosis, endocytosis, and recovery of the cortical actin cytoskeleton.
Based on our data, we propose a model in which, upon CTL encounter with a target, TCR-triggering initiates a signaling cascade that leads to the recruitment of PLCγ1 to signaling complexes at the synapse, where it hydrolyzes PIP2 in a localized fashion, thereby affecting actin-regulatory factors. Polarization of the centrosome to the contact interface then delivers lytic granules to the immunological synapse in a region of reduced cortical actin density where they can fuse efficiently. Following granule secretion, recovery of cortical actin across the synapse then terminates further degranulation. Whether this recovered actin then alters dynamics with target cells, allowing detachment to enable subsequent attack of new target cells, remains an intriguing question. We propose that this secretion-induced cortical actin recovery offers a mechanism through which CTLs could limit secretion and preserve their capacity for serial killing during an immune response.
Materials and Methods
Mice.
OT-I TCR transgenic (55) and C57BL/6 mice (Jackson Laboratories) were maintained in a specific pathogen-free facility. Cells from Rab27aash/ash mice were a generous gift from J. Hammer, National Heart, Lung, and Blood Institute (NHLBI), NIH, Bethesda. Cells were obtained from 6- to 10-wk-old male or female mice. Animal husbandry and experiments were performed in accordance with protocols approved by the National Human Genome Research Institute (NHGRI) Animal Use and Care Committee at the NIH.
DNA Constructs.
The DNA constructs used in this paper were generated as follows. Full-length GCAMP6m (14) was cloned into the pMIG-R1 retroviral vector using BglII and EcoRI restriction sites to generate GCAMP6m-MIG-R1. Cloning of TagRFP-MEM-pMIG and Farnesyl-TagBFP2-pMIG were described previously (10). Lifeact-mApple, Lifeact-mEmerald, and mTagBFP2-Farnesyl-5 were obtained from M. Davidson, Florida State University, Tallahassee, FL. LAMP1-EGFP (human LAMP1 with C-terminal fluorescent protein tags) was a gift from G. Patterson, National Institute of Biomedical Imaging and Bioengineering, NIH, Bethesda and was constructed exactly as described for PA-GFP-lgp120 (56). Constructs coding for the pleckstrin homology (PH)-binding domain of Tubby fused to EGFP (Tubby-EGFP), PM-FRB-mRFP, PM-FKBP-mRFP, and mRFP-5-ptase-FKBP12 were generous gifts from T. Balla, Eunice Kennedy Shriver National Institute of Child Health and Human Development (NICHD), NIH, Bethesda (31, 33). To produce PM-FRB-tagBFP2 and PM-FKBP-tagBFP2, the gene coding for tagBFP2 was removed from mTagBFP2-MAPTau-N10 using the restriction enzymes NotI and AgeI and was exchanged with the gene coding for the mRFP fluorophore in the two plasma membrane-localized recruiter constructs.
Cell Culture.
To generate CTLs from OT-I mice, splenocytes were isolated and stimulated with 10 nM OVA257–264 peptide (AnaSpec) in complete Roswell Park Memorial Institute medium (RPMI 1640 plus 10% FCS, 2 mM l-glutamine, 50 U/mL penicillin/streptomycin, and 50 μM β-mercaptoethanol). After 3 d of stimulation, cells were resuspended in complete RPMI plus 10 IU/mL recombinant human IL-2 (rHIL-2) and were seeded in fresh medium at 0.5 × 10⁶ cells/mL every 48 h. CTLs were used 6–8 d after primary in vitro stimulation. To generate CTLs, purified CD8+ T cells from WT and Rab27aash/ash mice were activated using plate-bound anti-CD3ε (clone 2C11; 1 μg/mL) and anti-CD28 (2 μg/mL) (both from BioXCell) for 48 h in complete medium. Following stimulation, cells were resuspended in fresh medium plus rhIL-2 and were cultured for 4 d before use in assays. To generate EL4-GCAMP6m, retroviral supernatants from 293T cells transfected with the GCAMP6m-MIGR1 vector were used to transduce EL4 cells. FACS was used to isolate the top 10% brightest expressing cells. COS7 cells and EL4 cell lines stably expressing Farnesyl-TagBFP2-pMIG and TagRFP-MEM-pMIG [described previously (10)] or GCAMP6m were maintained in DMEM with 10% FCS, 2 mM l-glutamine, 50 U/mL penicillin/streptomycin, and 50 μM β-mercaptoethanol.
Live-Cell Imaging.
To prepare cells for live imaging, 5 × 10⁶ to 1 × 10⁷ in vitro-activated CTLs were transfected with 2.5 μg DNA using the Mouse T Cell Nucleofector Kit (Lonza) 4–6 h before imaging.
For spinning-disk confocal imaging of CTL–target interactions, specified targets were pulsed with 1 μM OVA peptide for 1 h at 37 °C and were washed once in serum-free DMEM (Gibco). Targets were plated for 5 min in no. 1.5 glass four- or eight-well Lab-Tek imaging chambers (Electron Microscopy Services) previously coated with 0.5 μg/mL murine ICAM-1/FC (R&D Systems). Approximately 2 × 10⁶ CTLs were added dropwise to the chambers containing the targets, and serial confocal 1-μm z stacks were acquired at 15- to 30-s intervals. Imaging began within 5 min after the addition of the CTLs to each chamber. Images were acquired on either a Nikon Ti3 microscope with a Yokogawa spinning-disk scan head (no. CSU-X1; Yokogawa) and a Photometrics EM-CCD camera or an Axio Observer Z1 microscope (Carl Zeiss Inc.) with a Zeiss Yokogawa Spinning Disk system and a Photometrics Evolve EM-CCD camera (Evolve 512).
For live TIRF microscopy of CTLs, no. 1.5 eight-well glass imaging chambers (LabTek) were cleaned and sonicated in 1 M KOH for 15 min, coated with 0.01% poly-l-lysine (Sigma) for 15 min, washed with PBS, and then coated with 2.5 μg anti-CD3ε (clone 2C11; BioXCell) in PBS for 1 h at 37 °C. PBS was replaced with warm RPMI (without phenol red) plus 5% FBS. CTLs (transfected as above) then were plated in chambers. Imaging began within 2 min after the addition of T cells to the chamber with a Nikon Ti-E microscope using a 100×, Apo TIRF 1.49 NA oil-immersion objective (Nikon Instruments) with an iXon3 EM-CCD (DU-897; Andor Technology) or an Axio Observer Z1 microscope (Carl Zeiss Inc.) with a TIRF fiber illuminator, oil immersion 100× TIRF objective, and a complementary metal-oxide semiconductor (cMOS) camera (PCO Edge). For LatA experiments, CTLs were added to anti-CD3ε–coated chambers 15 min prior to the initiation of imaging, then imaged for 1–2 min before the addition of LatA (1 μM final concentration; Cayman Chemicals) or ethanol control. TIRF imaging continued for 10–15 min following treatment.
For the plasma membrane PIP2-depletion experiments, COS7 cells were transfected with expression plasmids coding for PM-FRB-tagBFP2 (or PM-FKBP-tagBFP2) and mRFP-5ptase-FKBP12 at a 2:1 molar ratio. Depending on the experiment, cells were cotransfected with either Tubby-EGFP or Lifeact-mEmerald. Imaging was performed on the following day using eight-well imaging chambers (LabTek) that were coated with 1:400 human fibronectin (Millipore) for 30 min at room temperature. Transfected COS7 cells were trypsinized, washed, and plated into the LabTek chambers 30 min before each experiment. The cells were imaged in TIRF for 5–10 min before the addition of a 3× stock of rapamycin (Sigma) to the chamber (final concentration: 100 nM). The cells were monitored for another 40 min after the addition of the drug to monitor the effects of 5-ptase recruitment to the plasma membrane. TIRF imaging was performed on a Nikon Ti3 TIRF microscope with a brick-and-block system to maintain a temperature of 37 °C and atmosphere at 5% CO2.
Fixed Cell Imaging in TIRF.
For phalloidin experiments, WT or Rab27aash/ash CTLs were plated in no. 1.5 four- or eight-well glass imaging chambers coated with 2.5 μg anti-CD3ε, as described above. At 3 (early) or 8 (late) minutes after CTLs were added to wells, the medium in the chambers was replaced with 4% paraformaldehyde (PFA) for 10 min at room temperature. Then the cells were washed with PBS. Cells in chambers were stained for 10 min with Alexa Fluor 568 phalloidin (Thermo Fisher Scientific) and were washed again with PBS. Samples were imaged using a 100×, Apo TIRF 1.49 NA oil-immersion objective with an iXon3 EM-CCD (DU-897).
For Lifeact-mApple plus Tubby-EGFP imaging of fixed cells in TIRF, cells were cotransfected with Lifeact-mApple and Tubby-EGFP and were added to #1.5 4- or 8-well glass imaging chambers coated with 2.5 μg anti-CD3ε, as described above. After 3 or 8 min, cells in chambers were fixed with 4% PFA for 10 min at room temperature, washed with PBS, and imaged on an Axio Observer Z1 microscope with a TIRF fiber illuminator and an oil immersion 100× TIRF objective, using a cMOS camera (PCO Edge).
Immunofluorescence Confocal Microscopy.
Peptide-pulsed targets and transfected CTLs pretreated for 10 min at 37 °C with the indicated compounds (U-73122 or U-73343, final concentration 1 μM; Sigma) were added dropwise to no. 1.5 four-well glass imaging chambers previously coated with 0.5 μg/mL murine ICAM-1/FC and were allowed to interact with targets for 5 min. Then cells were fixed in 4% PFA for 10 min or PMA (final concentration, 20 ng/mL; Sigma) and ionomycin (final concentration, 1 μg/mL; Sigma) were added for an additional 5 min, and then cells were fixed with 4% PFA. Cells in chambers were washed with PBS and were left in PBS before imaging on an Axio Observer Z1 or the Nikon Ti3 spinning-disk microscopes described above.
For Airyscan imaging, confocal images were collected using a Zeiss LSM 880 confocal system fitted with an Airyscan module, mounted on an inverted Zeiss Axio Observer Z1 microscope with an oil immersion Plan-Apochromat 63×/1.40 differential interference contrast (DIC) objective lens (Carl Zeiss Inc.). All images were acquired in Airyscan mode (super-resolution) using a 32-channel GaAsP-PMT detector. Excitation wavelengths of 488 nm (2.2%) and 561 nm (0.3%) were used for detection of LAMP1-EGFP and Alexa Fluor 568 phalloidin; emissions were collected in a BP 420/480 or a BP 495/620 filter, respectively. The Zeiss ZEN 2.3 (black) software package was used for collection and postprocessing of the images. Airyscan processing was done using a 6.3-strength 3D method.
SIM.
WT CTLs previously transfected with LAMP1-EGFP were added to no. 1.5 eight-well glass chambers coated with 2.5 μg anti-CD3ε, as described. After 10 min at 37 °C, cells were fixed with 4% PFA, stained with Alexa Fluor 568 phalloidin for 10 min at room temperature, washed, and maintained in PBS. 3D-SIM of these cells was performed on a GE DeltaVision OMX SR (Applied Precision Ltd.; GE Healthcare) equipped with a 60× 1.42 NA objective (Olympus). Raw data from 3- to 6-μm z stacks were reconstructed using Softworx (Applied Precision Ltd.; GE Healthcare) and values between 0.001 and 0.003 for the Wiener filter constant.
Image Acquisition and Analysis Software and Statistics.
Image acquisition on systems was controlled using Nikon NIS-Elements, Zeiss Zen Blue Software, and OMX Master Control Software AcquireSR. Data were analyzed with Imaris Scientific Image Processing and Analysis Software (Bitplane Scientific Software) and ImageJ software (NIH). All statistical analyses were performed using Microsoft Excel or GraphPad Prism software. P values less than 0.05 were considered statistically significant.
Supplementary Material
Acknowledgments
We thank members of the G.M.G., P.L.S., and J.L.-S. laboratories, including A. Weigel and C. Obara (Howard Hughes Medical Institute-Janelia Research Campus) and Y. Asano [Cambridge Institute for Medical Research (CIMR)] for assistance with data analysis; Y. Asano, C. Gawden-Bone, J. C. Stinchcombe (CIMR), L. Samelson (NICHD) for critical reading of the manuscript and helpful discussions; S. Wincovitch (NHGRI) for assistance with imaging; T. Balla (NICHD) and M. W. Davidson (deceased, formerly of Florida State University) for DNA constructs; and J. Hammer (NHLBI) for Rab27aash/ash cells and helpful discussion. This work was supported by Wellcome Trust Grants 103930 and 100140 (to G.M.G.) and by intramural funding of the NICHD (J.L.-S. and A.T.R.), NHGRI (S.M.K. and P.L.S.), and NHLBI (S.M.).
Footnotes
The authors declare no conflict of interest.
This article contains supporting information online at www.pnas.org/lookup/suppl/doi:10.1073/pnas.1710751114/-/DCSupplemental.
References
- 1.Halle S, et al. In vivo killing capacity of cytotoxic T cells is limited and involves dynamic interactions and T cell cooperativity. Immunity. 2016;44:233–245. doi: 10.1016/j.immuni.2016.01.010. [DOI] [PMC free article] [PubMed] [Google Scholar]
- 2.Quann EJ, Merino E, Furuta T, Huse M. Localized diacylglycerol drives the polarization of the microtubule-organizing center in T cells. Nat Immunol. 2009;10:627–635. doi: 10.1038/ni.1734. [DOI] [PubMed] [Google Scholar]
- 3.Bossi G, et al. The secretory synapse: The secrets of a serial killer. Immunol Rev. 2002;189:152–160. doi: 10.1034/j.1600-065x.2002.18913.x. [DOI] [PubMed] [Google Scholar]
- 4.Ming M, Schirra C, Becherer U, Stevens DR, Rettig J. Behavior and properties of mature lytic granules at the immunological synapse of human cytotoxic T lymphocytes. PLoS One. 2015;10:e0135994. doi: 10.1371/journal.pone.0135994. [DOI] [PMC free article] [PubMed] [Google Scholar]
- 5.Lyubchenko TA, Wurth GA, Zweifach A. Role of calcium influx in cytotoxic T lymphocyte lytic granule exocytosis during target cell killing. Immunity. 2001;15:847–859. doi: 10.1016/s1074-7613(01)00233-3. [DOI] [PubMed] [Google Scholar]
- 6.Stinchcombe JC, Bossi G, Booth S, Griffiths GM. The immunological synapse of CTL contains a secretory domain and membrane bridges. Immunity. 2001;15:751–761. doi: 10.1016/s1074-7613(01)00234-5. [DOI] [PubMed] [Google Scholar]
- 7.Wollman R, Meyer T. Coordinated oscillations in cortical actin and Ca2+ correlate with cycles of vesicle secretion. Nat Cell Biol. 2012;14:1261–1269. doi: 10.1038/ncb2614. [DOI] [PMC free article] [PubMed] [Google Scholar]
- 8.Porat-Shliom N, Milberg O, Masedunskas A, Weigert R. Multiple roles for the actin cytoskeleton during regulated exocytosis. Cell Mol Life Sci. 2013;70:2099–2121. doi: 10.1007/s00018-012-1156-5. [DOI] [PMC free article] [PubMed] [Google Scholar]
- 9.Stinchcombe JC, Majorovits E, Bossi G, Fuller S, Griffiths GM. Centrosome polarization delivers secretory granules to the immunological synapse. Nature. 2006;443:462–465. doi: 10.1038/nature05071. [DOI] [PubMed] [Google Scholar]
- 10.Ritter AT, et al. Actin depletion initiates events leading to granule secretion at the immunological synapse. Immunity. 2015;42:864–876. doi: 10.1016/j.immuni.2015.04.013. [DOI] [PMC free article] [PubMed] [Google Scholar]
- 11.Tsun A, et al. Centrosome docking at the immunological synapse is controlled by Lck signaling. J Cell Biol. 2011;192:663–674. doi: 10.1083/jcb.201008140. [DOI] [PMC free article] [PubMed] [Google Scholar]
- 12.Zhao F, Cannons JL, Dutta M, Griffiths GM, Schwartzberg PL. Positive and negative signaling through SLAM receptors regulate synapse organization and thresholds of cytolysis. Immunity. 2012;36:1003–1016. doi: 10.1016/j.immuni.2012.05.017. [DOI] [PMC free article] [PubMed] [Google Scholar]
- 13.Keefe D, et al. Perforin triggers a plasma membrane-repair response that facilitates CTL induction of apoptosis. Immunity. 2005;23:249–262. doi: 10.1016/j.immuni.2005.08.001. [DOI] [PubMed] [Google Scholar]
- 14.Chen TW, et al. Ultrasensitive fluorescent proteins for imaging neuronal activity. Nature. 2013;499:295–300. doi: 10.1038/nature12354. [DOI] [PMC free article] [PubMed] [Google Scholar]
- 15.Sneller MC, et al. Clincal, immunologic, and genetic features of an autoimmune lymphoproliferative syndrome associated with abnormal lymphocyte apoptosis. Blood. 1997;89:1341–1348. [PubMed] [Google Scholar]
- 16.Dennert G, Podack ER. Cytolysis by H-2-specific T killer cells. Assembly of tubular complexes on target membranes. J Exp Med. 1983;157:1483–1495. doi: 10.1084/jem.157.5.1483. [DOI] [PMC free article] [PubMed] [Google Scholar]
- 17.Masson D, Tschopp J. Isolation of a lytic, pore-forming protein (perforin) from cytolytic T-lymphocytes. J Biol Chem. 1985;260:9069–9072. [PubMed] [Google Scholar]
- 18.Henkart P, et al. The role of cytoplasmic granules in cytotoxicity by large granular lymphocytes and cytotoxic T lymphocytes. Adv Exp Med Biol. 1985;184:121–138. doi: 10.1007/978-1-4684-8326-0_9. [DOI] [PubMed] [Google Scholar]
- 19.Poenie M, Epel D. Ultrastructural localization of intracellular calcium stores by a new cytochemical method. J Histochem Cytochem. 1987;35:939–956. doi: 10.1177/35.9.3611737. [DOI] [PubMed] [Google Scholar]
- 20.Riedl J, et al. Lifeact: A versatile marker to visualize F-actin. Nat Methods. 2008;5:605–607. doi: 10.1038/nmeth.1220. [DOI] [PMC free article] [PubMed] [Google Scholar]
- 21.Bunnell SC, Kapoor V, Trible RP, Zhang W, Samelson LE. Dynamic actin polymerization drives T cell receptor-induced spreading: A role for the signal transduction adaptor LAT. Immunity. 2001;14:315–329. doi: 10.1016/s1074-7613(01)00112-1. [DOI] [PubMed] [Google Scholar]
- 22.Barda-Saad M, et al. Dynamic molecular interactions linking the T cell antigen receptor to the actin cytoskeleton. Nat Immunol. 2005;6:80–89. doi: 10.1038/ni1143. [DOI] [PubMed] [Google Scholar]
- 23.Li D, et al. Advanced imaging. Extended-resolution structured illumination imaging of endocytic and cytoskeletal dynamics. Science. 2015;349:aab3500. doi: 10.1126/science.aab3500. [DOI] [PMC free article] [PubMed] [Google Scholar]
- 24.Shibasaki Y, et al. Massive actin polymerization induced by phosphatidylinositol-4-phosphate 5-kinase in vivo. J Biol Chem. 1997;272:7578–7581. doi: 10.1074/jbc.272.12.7578. [DOI] [PubMed] [Google Scholar]
- 25.Gilmore AP, Burridge K. Regulation of vinculin binding to talin and actin by phosphatidyl-inositol-4-5-bisphosphate. Nature. 1996;381:531–535. doi: 10.1038/381531a0. [DOI] [PubMed] [Google Scholar]
- 26.Apgar JR. Activation of protein kinase C in rat basophilic leukemia cells stimulates increased production of phosphatidylinositol 4-phosphate and phosphatidylinositol 4,5-bisphosphate: Correlation with actin polymerization. Mol Biol Cell. 1995;6:97–108. doi: 10.1091/mbc.6.1.97. [DOI] [PMC free article] [PubMed] [Google Scholar]
- 27.Yin HL, Janmey PA. Phosphoinositide regulation of the actin cytoskeleton. Annu Rev Physiol. 2003;65:761–789. doi: 10.1146/annurev.physiol.65.092101.142517. [DOI] [PubMed] [Google Scholar]
- 28.Weiss A, Samelson LE. T-lymphocyte activation. In: Paul WE, editor. Fundamental Immunology. Lippincott-Raven; New York: 2003. pp. 321–363. [Google Scholar]
- 29.Rhee SG. Regulation of phosphoinositide-specific phospholipase C. Annu Rev Biochem. 2001;70:281–312. doi: 10.1146/annurev.biochem.70.1.281. [DOI] [PMC free article] [PubMed] [Google Scholar]
- 30.Balla T, Varnai P. Visualization of cellular phosphoinositide pools with GFP-fused protein-domains. Curr Protoc Cell Biol. 2009;Chapter 24:Unit 24.4. doi: 10.1002/0471143030.cb2404s42. [DOI] [PMC free article] [PubMed] [Google Scholar]
- 31.Szentpetery Z, Balla A, Kim YJ, Lemmon MA, Balla T. Live cell imaging with protein domains capable of recognizing phosphatidylinositol 4,5-bisphosphate; a comparative study. BMC Cell Biol. 2009;10:67. doi: 10.1186/1471-2121-10-67. [DOI] [PMC free article] [PubMed] [Google Scholar]
- 32.Bleasdale JE, et al. Inhibition of phospholipase C dependent processes by U-73, 122. Adv Prostaglandin Thromboxane Leukot Res. 1989;19:590–593. [PubMed] [Google Scholar]
- 33.Varnai P, Thyagarajan B, Rohacs T, Balla T. Rapidly inducible changes in phosphatidylinositol 4,5-bisphosphate levels influence multiple regulatory functions of the lipid in intact living cells. J Cell Biol. 2006;175:377–382. doi: 10.1083/jcb.200607116. [DOI] [PMC free article] [PubMed] [Google Scholar]
- 34.Zoncu R, et al. Loss of endocytic clathrin-coated pits upon acute depletion of phosphatidylinositol 4,5-bisphosphate. Proc Natl Acad Sci USA. 2007;104:3793–3798. doi: 10.1073/pnas.0611733104. [DOI] [PMC free article] [PubMed] [Google Scholar]
- 35.Clark RH, et al. Adaptor protein 3-dependent microtubule-mediated movement of lytic granules to the immunological synapse. Nat Immunol. 2003;4:1111–1120. doi: 10.1038/ni1000. [DOI] [PubMed] [Google Scholar]
- 36.Rak GD, Mace EM, Banerjee PP, Svitkina T, Orange JS. Natural killer cell lytic granule secretion occurs through a pervasive actin network at the immune synapse. PLoS Biol. 2011;9:e1001151. doi: 10.1371/journal.pbio.1001151. [DOI] [PMC free article] [PubMed] [Google Scholar]
- 37.Brown AC, et al. Remodelling of cortical actin where lytic granules dock at natural killer cell immune synapses revealed by super-resolution microscopy. PLoS Biol. 2011;9:e1001152. doi: 10.1371/journal.pbio.1001152. [DOI] [PMC free article] [PubMed] [Google Scholar]
- 38.Orci L, Gabbay KH, Malaisse WJ. Pancreatic beta-cell web: Its possible role in insulin secretion. Science. 1972;175:1128–1130. doi: 10.1126/science.175.4026.1128. [DOI] [PubMed] [Google Scholar]
- 39.Giner D, et al. Real-time dynamics of the F-actin cytoskeleton during secretion from chromaffin cells. J Cell Sci. 2005;118:2871–2880. doi: 10.1242/jcs.02419. [DOI] [PubMed] [Google Scholar]
- 40.Villanueva J, et al. The F-actin cortex in chromaffin granule dynamics and fusion: A minireview. J Mol Neurosci. 2012;48:323–327. doi: 10.1007/s12031-012-9718-4. [DOI] [PubMed] [Google Scholar]
- 41.Torregrosa-Hetland CJ, et al. The F-actin cortical network is a major factor influencing the organization of the secretory machinery in chromaffin cells. J Cell Sci. 2011;124:727–734. doi: 10.1242/jcs.078600. [DOI] [PubMed] [Google Scholar]
- 42.Yi J, Wu XS, Crites T, Hammer JA., 3rd Actin retrograde flow and actomyosin II arc contraction drive receptor cluster dynamics at the immunological synapse in Jurkat T cells. Mol Biol Cell. 2012;23:834–852. doi: 10.1091/mbc.E11-08-0731. [DOI] [PMC free article] [PubMed] [Google Scholar]
- 43.Beemiller P, Jacobelli J, Krummel MF. Integration of the movement of signaling microclusters with cellular motility in immunological synapses. Nat Immunol. 2012;13:787–795. doi: 10.1038/ni.2364. [DOI] [PMC free article] [PubMed] [Google Scholar]
- 44.Babich A, et al. F-actin polymerization and retrograde flow drive sustained PLCγ1 signaling during T cell activation. J Cell Biol. 2012;197:775–787. doi: 10.1083/jcb.201201018. [DOI] [PMC free article] [PubMed] [Google Scholar]
- 45.Scott CC, et al. Phosphatidylinositol-4,5-bisphosphate hydrolysis directs actin remodeling during phagocytosis. J Cell Biol. 2005;169:139–149. doi: 10.1083/jcb.200412162. [DOI] [PMC free article] [PubMed] [Google Scholar]
- 46.Martínez-Martín N, et al. T cell receptor internalization from the immunological synapse is mediated by TC21 and RhoG GTPase-dependent phagocytosis. Immunity. 2011;35:208–222. doi: 10.1016/j.immuni.2011.06.003. [DOI] [PMC free article] [PubMed] [Google Scholar]
- 47.Goodridge HS, et al. Activation of the innate immune receptor Dectin-1 upon formation of a ‘phagocytic synapse’. Nature. 2011;472:471–475. doi: 10.1038/nature10071. [DOI] [PMC free article] [PubMed] [Google Scholar]
- 48.Niedergang F, Di Bartolo V, Alcover A. Comparative anatomy of phagocytic and immunological synapses. Front Immunol. 2016;7:18. doi: 10.3389/fimmu.2016.00018. [DOI] [PMC free article] [PubMed] [Google Scholar]
- 49.Huang JF, et al. TCR-mediated internalization of peptide-MHC complexes acquired by T cells. Science. 1999;286:952–954. doi: 10.1126/science.286.5441.952. [DOI] [PubMed] [Google Scholar]
- 50.Braiman A, Barda-Saad M, Sommers CL, Samelson LE. Recruitment and activation of PLCgamma1 in T cells: A new insight into old domains. EMBO J. 2006;25:774–784. doi: 10.1038/sj.emboj.7600978. [DOI] [PMC free article] [PubMed] [Google Scholar]
- 51.Wilson SM, et al. A mutation in Rab27a causes the vesicle transport defects observed in ashen mice. Proc Natl Acad Sci USA. 2000;97:7933–7938. doi: 10.1073/pnas.140212797. [DOI] [PMC free article] [PubMed] [Google Scholar]
- 52.Stinchcombe JC, et al. Rab27a is required for regulated secretion in cytotoxic T lymphocytes. J Cell Biol. 2001;152:825–834. doi: 10.1083/jcb.152.4.825. [DOI] [PMC free article] [PubMed] [Google Scholar]
- 53.Haddad EK, Wu X, Hammer JA, 3rd, Henkart PA. Defective granule exocytosis in Rab27a-deficient lymphocytes from Ashen mice. J Cell Biol. 2001;152:835–842. doi: 10.1083/jcb.152.4.835. [DOI] [PMC free article] [PubMed] [Google Scholar]
- 54.Davis SJ, van der Merwe PA. The kinetic-segregation model: TCR triggering and beyond. Nat Immunol. 2006;7:803–809. doi: 10.1038/ni1369. [DOI] [PubMed] [Google Scholar]
- 55.Hogquist KA, et al. T cell receptor antagonist peptides induce positive selection. Cell. 1994;76:17–27. doi: 10.1016/0092-8674(94)90169-4. [DOI] [PubMed] [Google Scholar]
- 56.Patterson GH, Lippincott-Schwartz J. A photoactivatable GFP for selective photolabeling of proteins and cells. Science. 2002;297:1873–1877. doi: 10.1126/science.1074952. [DOI] [PubMed] [Google Scholar]
Associated Data
This section collects any data citations, data availability statements, or supplementary materials included in this article.


