Abstract
Computed tomography (CT) has contributed substantially to our understanding of COPD over the past decade. Visual and quantitative assessments of CT in COPD are complementary. Visual assessment should provide assessment of centrilobular, panlobular and paraseptal emphysema, airway wall thickening, bronchiectasis, findings of respiratory bronchiolitis, and enlargement of the pulmonary artery. Quantitative CT permits evaluation of severity of emphysema, airway wall thickening, and expiratory air trapping, and is now being used for longitudinal evaluation of the progression of COPD. Innovative techniques are being developed to use CT to characterize the pattern of emphysema and smoking- related respiratory bronchiolitis. Magnetic resonance imaging (MRI) and positron emission tomography PET-CT are useful research tools in the evaluation of COPD.
Keywords: COPD, computed tomography, emphysema, quantification, biomarker
Introduction:
The morphologic manifestations of the group of obstructive diseases collectively labeled COPD, as seen on CT, vary widely. Individuals with similar levels of physiologic impairment or Global Obstructive chronic Lung Disease (GOLD) stage may have substantial, little, or no emphysema. Discrete subphenotypes of COPD include emphysema of varying morphologic appearance, large airway abnormality and small airway obstruction. Increasing awareness of the heterogeneity of COPD has led to increased use of CT to characterize COPD for purposes of genetic evaluation and identification of specific subgroups which may be amenable to therapeutic trials.1-3 While visual assessment is important in determining the presence and character of emphysema, the last decade has been characterized by increasing use of quantitative imaging to provide precise estimates of the severity and distribution of emphysema, gas trapping and airway wall thickening. Several large cohorts of cigarette smokers have now been quite extensively characterized by CT, resulting in increased knowledge of the clinical correlates of quantitative CT parameters.4-6 The purpose of this paper is to present the substantial contribution that imaging has made to our understanding of COPD over the past 10 years.
Imaging Techniques
On the chest radiograph, emphysema, airway wall thickening and hyperinflation are useful signs of COPD, but are neither sensitive nor specific. Therefore, the chest radiograph cannot be used to characterize COPD; its primary role in COPD is to detect complications such as pneumonia. CT is currently the most effective modality for characterizing and quantifying COPD, but there is emerging information on positron emission tomography (PET)-CT and magnetic resonance imaging (MRI), as discussed below.
CT: Optimal Technique
Appropriate CT technique is critical for assessment of COPD.7,8 The cornerstone of CT assessment is a volumetric acquisition obtained at maximal inspiration. The CT technologist has a pivotal role in ensuring that the patient takes a maximally deep inspiration, and standardized breathing instructions are helpful in this regard.
The CT technique should be tailored for specific tasks. Precise characterization and quantification of emphysema requires thin CT reconstructions (1.25 mm or less in thickness). Although these thin section images are associated with relatively high image noise, particularly at lower CT dose, visual characterization of emphysema may be achieved with relatively low CT dose, as used for lung cancer screening. Emphysema may also be effectively quantified using reduced dose, though the increased image noise at lower CT doses may cause relative increase in threshold-based measures of emphysema. For measuring the airways, higher CT doses may be required, because multiplanar reconstructions, reconstructed from submillimeter sections, are necessary to ensure precise cross-sectional measurements. The higher CT dose is needed to reduce the effect of image noise on the reconstructions.
Novel techniques such as iterative reconstruction are increasingly used to optimize CT reconstructions, enabling further reductions in CT dose. However, the effect of these techniques on visual and quantitative evaluation remains unclear. 9>-12
Expiratory CT is increasingly recognized as an important part of the assessment of COPD, 13,14 to facilitate visual and quantitative assessment of the presence and distribution of air trapping. Expiratory images may be obtained at relatively low CT dose. If visual assessment is performed, non-contiguous images spaced at 10 mm or 20 mm will suffice, but volumetric acquisition is generally necessary for quantitative assessment. Coaching by the technologist, and standardized breathing instructions are important to ensure that the patient expires to an appropriate level. The patient may be asked to expire to the end of a normal expiration (functional residual capacity), 1 or to residual volume. 3 There is no clear evidence as to which technique is preferable.
CT: Visual Evaluation
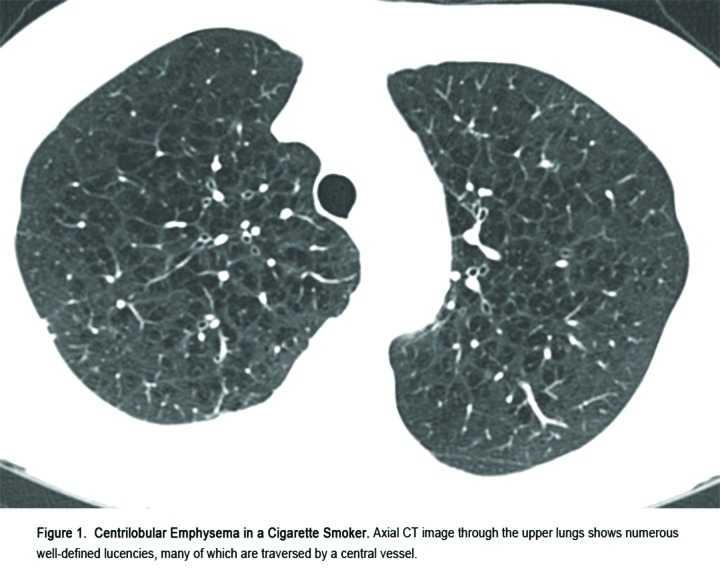
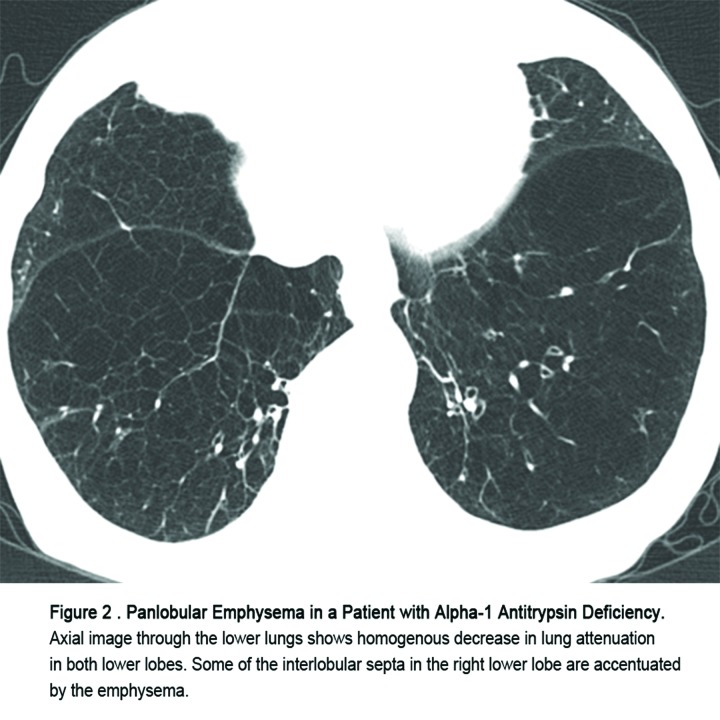
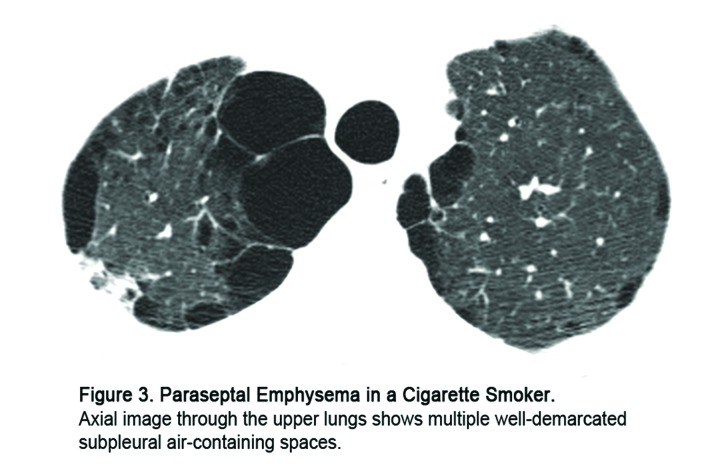
Comprehensive visual assessment of CT in COPD should include assessment of the pattern of emphysema, presence of airway wall-thickening or bronchiectasis, findings of inflammatory and obstructive small airways disease, and pulmonary artery size. For optimal classification, thin section, high resolution CT images should be viewed at standardized window settings, usually with a window level of -700, and window width of 1000 to 1500. Emphysema is classified as centrilobular, panlobular, and paraseptal (Figures 1, 2, 3). (A cicatricial form is also described, which occurs in relationship to lung fibrosis such as progressive massive fibrosis, but this is not relevant to COPD). The patterns of emphysema identified on CT correlate quite well with the patterns recognized on pathology. Visual assessment of severity of emphysema and airway wall thickening correlates quite well with physiologic impairment.15 However, observer agreement with regard to severity of emphysema on visual assessment has been quite variable and quantitative CT is preferred for assessing disease severity.16 Bronchial wall thickening is commonly identified in heavy cigarette smokers, and is often a sign of chronic bronchitis. However, identification of bronchial wall thickening is subjective, with considerable observer variation. Bronchiectasis is common in individuals with COPD,17,18 and may be a marker for severe airflow obstruction and risk for exacerbation.19
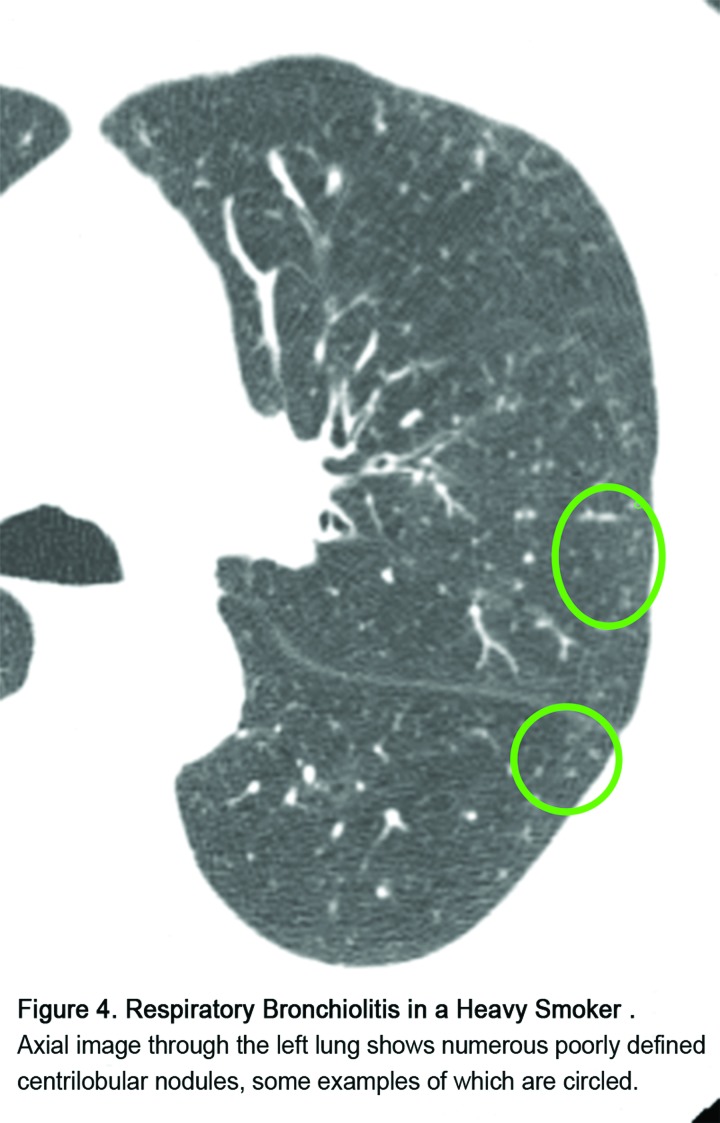
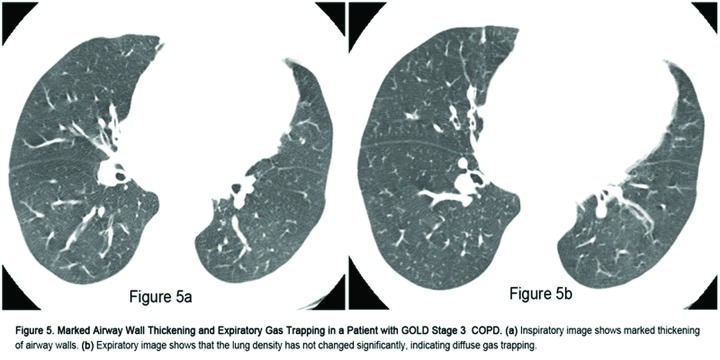
CT can show two distinct patterns of small airways disease in cigarette smokers: inflammatory small airways disease (respiratory bronchiolitis) is characterized by poorly defined centrilobular nodularity (Figure 4), while obstructive small airways disease is characterized by expiratory gas trapping (Figure 5). Interstitial lung abnormalities may be seen in up to 10% of heavy cigarette smokers,20,21 most commonly, ground glass abnormality indicating an inflammatory abnormality, though a fibrotic-appearing abnormality may be found in 1-2% of cases. 21 Evaluation of the pulmonary vasculature is important in individuals with COPD, because enlargement of the central pulmonary arteries is associated with increased risk of exacerbation. 22
CT: Quantitative Evaluation
The past 10 years have seen substantial increase in our understanding of the use of quantitative CT (QCT) to characterize COPD. Some of the information below is adapted from a recent review of these important advances. 23
Emphysema
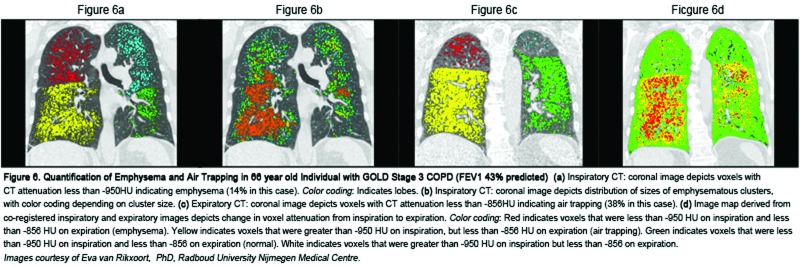
Emphysema results in replacement of normal lung (which has a typical attenuation of about -850 Hounsfield Units [HU] on inspiratory CT) by air-containing spaces, with CT attenuation around -1000 HU. The pioneering work by Müller, et al, 24 validated the density mask technique, in which CT pixels with attenuation below a certain threshold value (initially -910 HU) were defined as emphysema. Quantitative CT measurements were subsequently shown to correlate better than visual CT scoring with macroscopic measurements of emphysema25; more recent studies using thin section CT and multidetector scanners showed that the highest correlation between QCT metrics and histology is found when the CT threshold is set at -960 or -970 HU.26 However, because these higher thresholds may be more sensitive to noise, the threshold of -950 HU is now most commonly used (Figure 6a).1,6,27 An alternative approach to emphysema quantification uses the CT attenuation at a given percentile along the frequency histogram of lung attenuation (e.g. first or 15th percentile).27 The percentile approach may be more robust for longitudinal evaluation of emphysema, and less sensitive to change in lung volumes.28-30 The first percentile value is optimal for correlation with histology.26 However, because of concern regarding artifact from image noise and truncation artifact at the first percentile level, most studies have used the 15th percentile threshold. 30,31
It is important to remember that the measurement of the percentage of low attenuation areas (%LAA), while it correlates moderately well with histologic severity of emphysema (with r values between 0.5 and 0.6), is not a direct measurement of emphysema. The term percentage of emphysema (% emphysema) is widely used to refer to such CT measurements, but is imprecise and may give rise to confusion. The annotation %LAA-950 (or %LAA-910, etc.) is preferred because it is more precise. The term RA950 is also sometimes used to indicate the relative area of lung less than -950 HU.
The D value or alpha value represents the slope of the log-log plot of the cumulative frequency-size distributions of the %LAA-950. , and has been used as an index of the relative size of emphysematous clusters. Mishima, et al, found that smokers with normal %LAA had lower D values than nonsmokers, suggesting that the D value might be a sensitive method for detecting early emphysema.32 However, Madani, et al, found that the D value did not correlate with macroscopic or microscopic indices of emphysema.33 More work is needed to identify the best measures of the size of emphysematous clusters or holes (Figure 6b).
Sources of Variation
Major sources of variation in quantification of emphysema include variation in lung volume, technical CT parameters, and cigarette smoking. Measures of emphysema change significantly when scans are obtained at 100%, 90%, 80%, 70%, and 50% of vital capacity.34 However, the change between 100% and 90% of vital capacity is relatively slight. While several studies have used spirometers to standardize inspired lung volume, 35,36 such systems are not widely available, and the strong physiologic correlations obtained without lung volume control suggest that it may not be necessary. In the absence of a spirometer, careful coaching of the patient by the technologist is important to achieve total lung capacity.
Decreasing slice thickness and decreasing CT dose (tube current) both result in increasing %LAA-960, presumably because of decreasing image noise.37 Differences in reconstruction algorithm (in particular the use of over-enhancing reconstruction algorithms) have a large effect on measurement of low attenuation areas, because they result in increased image noise simulating emphysema.38 For this reason, a smooth reconstruction algorithm is generally used in quantitative CT evaluation of emphysema (e.g. B35 for Siemens scanners, Standard for GE scanners, B kernel for Phillips scanners, and FC01 for Toshiba scanners).39
Several authors have shown that current smokers appear to have lower levels of emphysema than former smokers.40,41 Even more intriguingly, the extent of emphysema appears to increase quite rapidly following smoking cessation, reflecting a fall in lung attenuation.42,43 This effect is presumed to be due to a smoking-induced increase in inflammatory cells in the lung in current smokers, resulting in increased lung attenuation, so that partial volume averaging masks the areas of low-attenuation emphysema. Therefore, smoking status should always be taken into account when assessing severity of emphysema by quantitative CT.
Longitudinal Evaluation
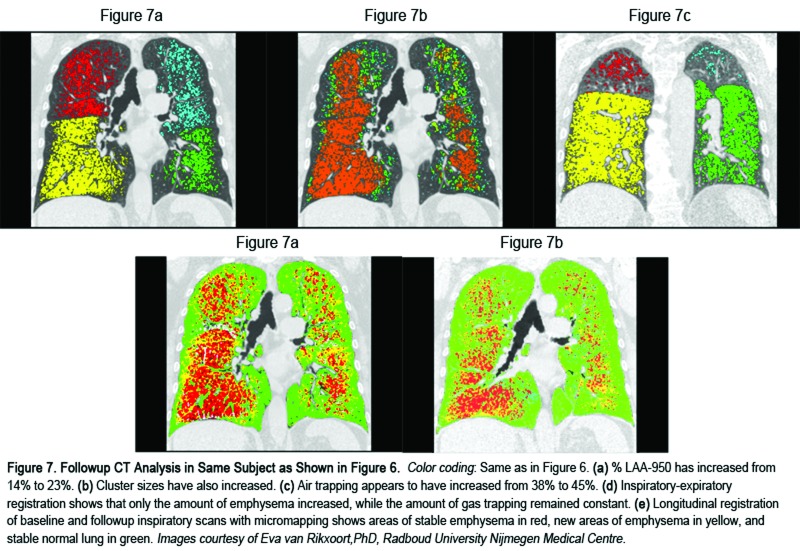
Several studies have evaluated the ability of CT to detect progression of emphysema on longitudinal evaluation (Figure 7). The main source of variation is related to change in lung volume. Correction for lung volume may be performed using a sponge model, where the % emphysema on the follow-up scan is corrected using the achieved lung volume on the baseline scan.44 Correction for lung volume reduces the variability in emphysema quantification by a factor of two.45 In a randomized controlled study of individuals with alpha-1 antitrypsin deficiency, change in 15th percentile CT density (corrected for lung volume) was found to be more sensitive as an index of progression than measures of physiology or health status.46 Combined analysis of 2 clinical trials of intravenous alpha-1 antitrypsin augmentation showed that this medication significantly reduces the decline in lung density in individuals with alpha-1 antitrypsin deficiency.47
In individuals with smoking-related emphysema, Gietema, et al, evaluated 157 individuals enrolled in a lung cancer screening study, who underwent repeat CT scans within 3 months, and found that the limits of agreement for %LAA-950 were from -1.3% to +1.1%, suggesting that CT can detect a change of 1.1% in extent of emphysema with 95% probability. In 1,928 individuals enrolled in the Evaluation of COPD Longitudinally to Identify Predictive Surrogate Endpoints (ECLIPSE study), Coxson, et al, found an average annual decline in lung density of 1.13g/L, after correction for lung volume, in a group of 1,928 current and former smokers.6 The decline was more rapid in women than in men, and in current smokers than in former smokers. Similarly, a study of 3,670 individuals enrolled in the Dutch-Belgium randomized lung cancer screening trial, NELSON (Dutch acronym), showed that former smokers (who had quit more than 5 years before) had an annual rate of progression of emphysema (LAA-950) of 1.07%, compared with 1.12% in current smokers (p<0.001).48 The progression rate was greater in those with more severe COPD at baseline.
Most recently, Staring, et al, have proposed a method to evaluate local changes in lung density using image registration and a modification of the sponge model, and validated it in a pilot study of 21 individuals with emphysema.49 If this method can be validated in larger populations of COPD individuals, it could prove to be a major advance in measuring the rate of local emphysema progression, independent of changes of lung volume.
Air Trapping
End-expiratory CT, whether obtained at functional residual capacity or at residual volume, is an excellent way to assess gas trapping in COPD. Most studies have evaluated the presence of gas trapping by evaluating the % LAA at a threshold of -856 or -850 HU (LAAexp856 or LAAexp850) (see Figures 6c, 7c). This value is chosen because it is the attenuation of a normally inflated lung on inspiration: it is assumed that a normal expiratory lung should always have higher attenuation than this. Murphy, et al, in a study of 216 cigarette smokers showed that LAAexp850 provided remarkably high correlations (r=0.85-0.90) with forced expiratory in 1 second to forced vital capacity (FEV1/FVC) ratio and with FEV1 percent predicted.50 Schroeder, et al,13 found similar levels of correlation in a study of 4,062 COPDGene® participants with and without COPD. Quantitative CT evaluation of severity of emphysema and expiratory gas trapping provides a simple way to assign individual COPD patients to subgroups characterized by predominant emphysema, mixed emphysema and gas trapping, and predominant gas trapping.23
Other authors have used other indices of gas trapping, including the ratio of inspiratory to expiratory lung volume, inspiratory-expiratory lung attenuation ratio, and the expiratory to inspiratory relative volume change of voxels with attenuation values between -860 and -950. Mets ,et al, found that the inspiratory-expiratory lung attenuation ratio provided the strongest correlation with physiologic air trapping.51 The same group studied 1,140 individuals enrolled in a lung cancer screening study, and found that a diagnostic model that included LAA-950insp, ratio of inspiratory to expiratory lung volume, body mass index, smoking pack years and smoking status permitted accurate diagnosis of COPD.14 As screening CT becomes more widely implemented for lung cancer detection, it is possible that routine expiratory CT may become part of the algorithm to permit detection of unrecognized COPD, and to evaluate subtle abnormalities of lung function.52
One of the challenges with evaluation of expiratory gas trapping in COPD is that a simple threshold measurement does not distinguish between gas trapping due to emphysema and small airways disease. Several authors have used deformation techniques to register the inspiration image to the expiration image, and calculate a voxel-by-voxel ventilation map, based on the change in CT attenuation between expiration and inspiration (Figures 6d, 7d).50,53,54 Galban, et al, with this technique generated a parametric response map, based on the assumption that voxels of lung with inspiratory CT attenuation less than -950 HU were emphysematous, while voxels that were greater than -950 HU on inspiration, but less than -856 HU on expiration represented non-emphysematous functional small airways disease.54 Murphy, et al, using a similar technique, found that measures based on expiratory CT provided the best correlations with FEV1/FVC ratio and with presence or absence of COPD, while measures based on co-registered inspiratory and expiratory images provided better classification of the GOLD stages of COPD.50
Airway Abnormality
Radiologic evaluation of the airways is helpful in COPD to provide an index of bronchial inflammation and remodeling, to correlate with exacerbation and other symptoms, and to provide a window into abnormalities of the small airways. There have been substantial recent advances in quantitative evaluation of the segmental and subsegmental airways. Currently, available software permits multiplanar reconstruction of airways from thin section volumetric datasets, permitting measurement of luminal diameter and wall thickness to the level of subsegmental or subsubsegmental airways. Parameters available for evaluating the airways include absolute measures (bronchial luminal diameter or area, bronchial wall thickness or area, and total bronchial area), and relative measures (e.g. bronchial wall area %). A commonly used summary measure of bronchial wall area is the square root of wall area of a hypothetical bronchus of internal perimeter 10 mm, calculated from linear regression of all measured bronchi, referred to as Pi10.55
Nakano, et al, showed that there was a correlation between wall area of the small airways, measured using histology, and wall area of the large airways, measured using CT.56 Han, et al, showed that CT-quantified bronchial wall thickness and severity of emphysema were independently associated with exacerbation frequency, and could be used to define bronchial predominant and emphysema predominant subtypes of COPD.5 Grydeland, et al, showed that the Pi10 was independently related to symptoms of dyspnea, cough and wheezing in individuals with COPD.57 There are modest correlations between airway wall area % and physiologic impairment.13,58 Additionally, Washko, et al,58 showed that on multivariate analysis, wall area % and peak airway attenuation appeared to be independent predictors of FEV1 % predicted.
Advanced Computerized Analysis Methods
There is increasing interest in using more sophisticated analysis to evaluate smoking-related lung injury, including emphysema. Ginsburg, et al, showed that a texture-based approach could discriminate quite effectively between the lungs of never-smokers, smokers without emphysema and smokers with emphysema.59 This suggests that textural analysis may be able to identify the early phase of smoking-related lung injury, prior to the development of emphysema. Castaldi, et al, used a local histogram-based technique to characterize and quantify distinct patterns of low attenuation in 9,313 smokers in the COPDGene® Study.60 They found that these patterns were more predictive than threshold-based emphysema measurement for lung function, dyspnea, quality of life, and health care use, and were strongly associated with pulmonary functional impairment even after adjustment for %LAA-950.
Concordance Between QCT And Visual Evaluation
Although quantitative CT measures correlate with severity of visually assessed emphysema, the level of correlation is not strong. In the COPDGene® workshop, where 58 observers independently scored CT scans of 294 individuals, agreement on pattern and extent of emphysema was poor to moderate, and concordance between visual and quantitative assessment of the presence of emphysema was only 75%.61 Gietema, et al, found that in those with less severe categories of emphysema, radiologists tended to visually underestimate extent of emphysema compared with quantitative measures, while in those with more severe emphysema, the radiologists tended to relatively overestimate emphysema extent. Thus, QCT and visual evaluation may provide complementary, independent assessments of severity of emphysema, particularly in those with less severe abnormality. Interestingly, although the presence of emphysema on visual assessment is associated with lung cancer,62,63 quantitative CT measurement of emphysema has not been shown to be independently associated with lung cancer. 64-66
Normal Values
A limitation in the implementation of quantitative CT has been the lack of understanding of the normal range of CT parameters, 67 and the factors that influence these measurements. A study of 92 healthy individuals aged between 45 and 80 showed that inspired lung volume was an important determinant of LAA-950 and of several airway parameters.68 Although the parameters also differed by age and sex, these differences did not persist when adjusted for inspired lung volume. Larger studies of healthy individuals are being performed, with the goal of developing prediction equations.69 It is important to be aware that the range of normal for quantitative CT parameters will vary depending on the CT acquisition technique.
PET-CT
PET-CT using 19F-flourodeoxyglucose can quantify metabolic activity in lungs with COPD. Increased metabolic activity is presumed to be related to neutrophilic infiltration, and correlates with the severity of pulmonary functional impairment.70 Correction for lung volumes is helpful in quantitative analysis of 19F FDG activity.71 However, this remains largely a research tool, at least in part because of the relatively large radiation dose associated with PET-CT.
MRI
Hyperpolarized helium-3 is a remarkable tool for imaging emphysema.72-75 On MRI following inhalation of this gas, its diffusivity can be used to estimate measures of the size of lung microstructure including alveolar ducts and alveoli. In cigarette smokers with absent or mild spirometric abnormality, this technique showed significant decrease in alveolar depth and enlargement of alveolar ducts.75 Most recently, this technique has shown subtle changes in apparent diffusion coefficient of 11 of 37 individuals who were exposed to secondhand smoke.76 Despite these unique and valuable properties, use of hyperpolarized helium for research or clinical applications has been limited by increasing scarcity and high cost of this isotope. Because of these limitations, attention is turning to other gases such as 129Xe gas.77-80 Although this agent is more abundant and less expensive, several technical challenges must be overcome before its role in the evaluation of emphysema can be properly understood.80 Other potential agents include oxygen, Carbon-13 and perflouropropane.81
In addition to the use of inhaled gases, there may be a role for conventional (proton) MRI in evaluation of emphysema.82-85 Advances in MRI imaging of the lung can result in visualization of low-proton areas of emphysema in at least 50% of cases.84
Abbreviations
computed tomography, CT; magnetic resonance imaging, MRI; positron emission tomography, PET; Global Initiative for chronic Obstructive Lung Disease, GOLD; quantitative CT, QCT; Hounsfield Units, HU; percentage of low attenuation area, %LAA; relative area of lung less than -950 HU, RA950; Evaluation of COPD Longitudinally to Identify Predictive Surrogate Endpoints, ECLIPSE; forced expiratory volume in 1 second, FEV1; forced vital capacity, FVC
References
- 1. Regan EA,Hokanson JE,Murphy JR,et al. Genetic epidemiology of COPD (COPDGene®) study design. COPD. 2010;7(1):32-43. doi: http://dx.doi.org/10.3109/15412550903499522 [DOI] [PMC free article] [PubMed] [Google Scholar]
- 2. Vestbo J,Anderson W,Coxson HO,et al. Evaluation of COPD Longitudinally to Identify Predictive Surrogate End-points (ECLIPSE). Eur Respr J. 2008;31(4):869-873. doi: http://dx.doi.org/10.1183/09031936.00111707 [DOI] [PubMed] [Google Scholar]
- 3. Couper D,Lavange LM,Han M,et al. Design of the Subpopulations and Intermediate Outcomes in COPD Study (SPIROMICS). Thorax. 2014;69:492-495. doi: http://dx.doi.org/10.1136/thoraxjnl-2013-203897 [DOI] [PMC free article] [PubMed] [Google Scholar]
- 4. Gietema HA,Schilham AM,van Ginneken B,van Klaveren RJ,Lammers JW,Prokop M. Monitoring of smoking-induced emphysema with CT in a lung cancer screening setting: detection of real increase in extent of emphysema. Radiology . 2007;244(3):890-897. doi: http://dx.doi.org/10.1148/radiol.2443061330 [DOI] [PubMed] [Google Scholar]
- 5. Han MK,Kazerooni EA,Lynch DA,et al. Chronic obstructive pulmonary disease exacerbations in the COPDGene study: associated radiologic phenotypes. Radiology . 2011;261(1):274-282. doi: http://dx.doi.org/10.1148/radiol.11110173 [DOI] [PMC free article] [PubMed] [Google Scholar]
- 6. Coxson HO,Dirksen A,Edwards LD,et al. The presence and progression of emphysema in COPD as determined by CT scanning and biomarker expression: a prospective analysis from the ECLIPSE study. Lancet Respir Med. 2013;1(2):129-136. doi: http://dx.doi.org/10.1016/S2213-2600%2813%2970006-7 [DOI] [PubMed] [Google Scholar]
- 7. Newell JD Jr.,Sieren J,Hoffman EA. Development of quantitative computed tomography lung protocols. J Thorac Imaging. 2013;28(5):266-271. doi: http://dx.doi.org/10.1097/RTI.0b013e31829f6796 [DOI] [PMC free article] [PubMed] [Google Scholar]
- 8. Mayo JR. CT evaluation of diffuse infiltrative lung disease: dose considerations and optimal technique. J Thoracic Imaging. 2009;24(4):252-259. doi: http://dx.doi.org/10.1097/RTI.0b013e3181c227b2 [DOI] [PubMed] [Google Scholar]
- 9. Choo JY,Goo JM,Lee CH,Park CM,Park SJ,Shim MS. Quantitative analysis of emphysema and airway measurements according to iterative reconstruction algorithms: comparison of filtered back projection, adaptive statistical iterative reconstruction and model-based iterative reconstruction. Eur Radiol. 2013;24(4):799-806. doi: http://dx.doi.org/10.1007/s00330-013-3078-5 [DOI] [PubMed] [Google Scholar]
- 10. Ichikawa Y,Kitagawa K,Nagasawa N,Murashima SSakuma H. CT of the chest with model-based, fully iterative reconstruction: comparison with adaptive statistical iterative reconstruction. BMC Med Imaging. 2013;13:27-27. doi: http://dx.doi.org/10.1186/1471-2342-13-27 [DOI] [PMC free article] [PubMed] [Google Scholar]
- 11. Mets OM,Willemink MJ,de Kort FP,et al. The effect of iterative reconstruction on computed tomography assessment of emphysema, air trapping and airway dimensions. Eur Radiol. 2012;22(10):2103-2109. doi: http://dx.doi.org/10.1007/s00330-012-2489-z [DOI] [PMC free article] [PubMed] [Google Scholar]
- 12. Nishio M,Matsumoto S,Ohno Y,et al. Emphysema quantification by low-dose CT: potential impact of adaptive iterative dose reduction using 3D processing. AJR Am J Roentgenol. 2012;199(3):595-601. doi: http://dx.doi.org/10.2214/AJR.11.8174 [DOI] [PubMed] [Google Scholar]
- 13. Schroeder J,McKenzie A,Zach J,et al. Relationships between airflow obstruction and quantitative CT measurements of emphysema, air trapping and airways in subjects with and without COPD. AJR Am J Roentgenol. 2013;201(3):W460-70. doi: http://dx.doi.org/10.2214/AJR.12.10102 [DOI] [PMC free article] [PubMed] [Google Scholar]
- 14. Mets OM,Buckens CF,Zanen P,et al. Identification of chronic obstructive pulmonary disease in lung cancer screening computed tomographic scans. JAMA. 2011;306(16):1775-1781. doi: http://dx.doi.org/10.1001/jama.2011.1531 [DOI] [PubMed] [Google Scholar]
- 15. Kim SS,Seo JB,Lee HY,et al. Chronic obstructive pulmonary disease: lobe-based visual assessment of volumetric CT by using standard images--comparison with quantitative CT and pulmonary function test in the COPDGene study. Radiology. 2013;266(2):626-635. doi: http://dx.doi.org/10.1148/radiol.12120385 [DOI] [PMC free article] [PubMed] [Google Scholar]
- 16. Cavigli E,Camiciottoli G,Diciotti S,et al. Whole-lung densitometry versus visual assessment of emphysema. Eur Radiol. 2009;19(7):1686-1692. doi: http://dx.doi.org/10.1007/s00330-009-1320-y [DOI] [PubMed] [Google Scholar]
- 17. Bafadhel M,Umar I,Gupta S,et al. The role of CT scanning in multidimensional phenotyping of COPD. Chest. 2011;140(3):634-642. doi: http://dx.doi.org/10.1378/chest.10-3007 [DOI] [PMC free article] [PubMed] [Google Scholar]
- 18. O'Brien C,Guest PJ,Hill SL,Stockley RA. Physiological and radiological characterisation of patients diagnosed with chronic obstructive pulmonary disease in primary care. Thorax. 2000;55(8):635-642. doi: http://dx.doi.org/10.1136/thorax.55.8.635 [DOI] [PMC free article] [PubMed] [Google Scholar]
- 19. Martinez-Garcia MA,Soler-Cataluna JJ,Donat Sanz Y,et al. Factors associated with bronchiectasis in patients with COPD. Chest. 2011;140(5):1130-1137. doi: http://dx.doi.org/10.1378/chest.10-1758 [DOI] [PubMed] [Google Scholar]
- 20. Washko GR,Lynch DA,Matsuoka S,et al. Identification of early interstitial lung disease in smokers from the COPDGene Study. Acad Radiol. 2010;17(1):48-53. doi: http://dx.doi.org/10.1016/j.acra.2009.07.016 [DOI] [PMC free article] [PubMed] [Google Scholar]
- 21. Jin GY,Lynch D,Chawla A,Garg K,Tammemagi MC,Sahin H,et al. Interstitial Lung Abnormalities in a CT Lung Cancer Screening Population: Prevalence and Progression Rate. Radiology. 2013;268(2):563-571. doi: http://dx.doi.org/10.1148/radiol.13120816 [DOI] [PMC free article] [PubMed] [Google Scholar]
- 22. Wells JM,Washko GR,Han MK,et al. Pulmonary arterial enlargement and acute exacerbations of COPD. New Engl J Med. 2012;367(10):913-921. doi: http://dx.doi.org/10.1056/NEJMoa1203830 [DOI] [PMC free article] [PubMed] [Google Scholar]
- 23. Lynch DA,Al-Qaisi MA. Quantitative computed tomography in chronic obstructive pulmonary disease. J Thorac Imaging. 2013;28(5):284-290. doi: http://dx.doi.org/10.1097/RTI.0b013e318298733c [DOI] [PMC free article] [PubMed] [Google Scholar]
- 24. Müller NL,Staples CA,Miller RR,Abboud RT. Density mask. An objective method to quantitate emphysema using computed tomography. Chest. 1988;94(4):782-787. doi: http://dx.doi.org/10.1378/chest.94.4.782 [DOI] [PubMed] [Google Scholar]
- 25. Bankier AA,De Maertelaer V,Keyzer C,Gevenois PA. Pulmonary emphysema: subjective visual grading versus objective quantification with macroscopic morphometry and thin-section CT densitometry. Radiology. 1999;211(3):851-858. doi: http://dx.doi.org/10.1148/radiology.211.3.r99jn05851 [DOI] [PubMed] [Google Scholar]
- 26. Madani A,Zanen J,de Maertelaer V,Gevenois PA. Pulmonary emphysema: objective quantification at multi-detector row CT--comparison with macroscopic and microscopic morphometry. Radiology. 2006;238(3):1036-1043. doi: http://dx.doi.org/10.1148/radiol.2382042196 [DOI] [PubMed] [Google Scholar]
- 27. Heussel CP,Herth FJF,Kappes J,et al. Fully automatic quantitative assessment of emphysema in computed tomography: comparison with pulmonary function testing and normal values. Eur Radiol. 2009;19(10):2391-2402. doi: http://dx.doi.org/10.1007/s00330-009-1437-z [DOI] [PubMed] [Google Scholar]
- 28. Dirksen A. Monitoring the progress of emphysema by repeat computed tomography scans with focus on noise reduction. Proc Am Thorac Soc. 2008;5(9):925-928. doi: http://dx.doi.org/10.1513/pats.200804-033QC [DOI] [PubMed] [Google Scholar]
- 29. Dirksen A,Friis M,Olesen KP,Skovgaard LT,Sorensen K. Progress of emphysema in severe alpha 1-antitrypsin deficiency as assessed by annual CT. Acta Radiol. 1997;38(5):826-832. doi: http://dx.doi.org/10.1080/02841859709172418 [DOI] [PubMed] [Google Scholar]
- 30. Stolk J,Dirksen A,van der Lugt AA,et al. Repeatability of lung density measurements with low-dose computed tomography in subjects with alpha-1-antitrypsin deficiency-associated emphysema. Invest Radiol. 2001;36(11):648-651. doi: http://dx.doi.org/10.1097/00004424-200111000-00004 [DOI] [PubMed] [Google Scholar]
- 31. Heussel CP,Herth FJ,Kappes J,et al. Fully automatic quantitative assessment of emphysema in computed tomography: comparison with pulmonary function testing and normal values. Eur Radiol. 2009;19(10):2391-2402. doi: http://dx.doi.org/10.1007/s00330-009-1437-z [DOI] [PubMed] [Google Scholar]
- 32. Mishima M,Hirai T,Itoh H,et al. Complexity of terminal airspace geometry assessed by lung computed tomography in normal subjects and patients with chronic obstructive pulmonary disease. Proc Natl Acad Sci U S A. 1999;96(16):8829-8834. doi: http://dx.doi.org/10.1073/pnas.96.16.8829 [DOI] [PMC free article] [PubMed] [Google Scholar]
- 33. Madani A,Van Muylem A,de Maertelaer V,Zanen J,Gevenois PA. Pulmonary emphysema: size distribution of emphysematous spaces on multidetector CT images--comparison with macroscopic and microscopic morphometry. Radiology. 2008;248(3):1036-1041. doi: http://dx.doi.org/10.1148/radiol.2483071434 [DOI] [PubMed] [Google Scholar]
- 34. Madani A,Van Muylem A,Gevenois PA. Pulmonary emphysema: Effect of lung volume on objective quantification at thin-section CT. Radiology. 2010;257(1):260-268. doi: http://dx.doi.org/10.1148/radiol.10091446 [DOI] [PubMed] [Google Scholar]
- 35. Fuld MK,Grout RW,Guo J,Morgan JH,Hoffman EA. Systems for lung volume standardization during static and dynamic MDCT-based quantitative assessment of pulmonary structure and function. Acad Radiol. 2012;19(8):930-940. doi: http://dx.doi.org/10.1016/j.acra.2012.03.017 [DOI] [PMC free article] [PubMed] [Google Scholar]
- 36. Moroni C,Mascalchi M,Camiciottoli G,et al. Comparison of spirometric-gated and -ungated HRCT in COPD. J Comput Assist Tomogr. 2003;27(3):375-379. doi: http://dx.doi.org/10.1097/00004728-200305000-00013 [DOI] [PubMed] [Google Scholar]
- 37. Madani A,De Maertelaer V,Zanen J,Gevenois PA. Pulmonary emphysema: radiation dose and section thickness at multidetector CT quantification--comparison with macroscopic and microscopic morphometry. Radiology . 2007;243(1):250-257. doi: http://dx.doi.org/10.1148/radiol.2431060194 [DOI] [PubMed] [Google Scholar]
- 38. Boedeker KL,McNitt-Gray MF,Rogers SR,et al. Emphysema: effect of reconstruction algorithm on CT imaging measures. Radiology. 2004;232(1):295-301. doi: http://dx.doi.org/10.1148/radiol.2321030383 [DOI] [PubMed] [Google Scholar]
- 39. Newell J,Sieren J,Hoffman E. Development of quantitative CT lung protocols. J of ThoracImaging. 2013;28(5):266-271. doi: http://dx.doi.org/10.1097/RTI.0b013e31829f6796 [DOI] [PMC free article] [PubMed] [Google Scholar]
- 40. Grydeland TB,Dirksen A,Coxson HO,et al. Quantitative computed tomography: emphysema and airway wall thickness by sex, age and smoking. Eur Respir J. 2009;34(4):858-865. doi: http://dx.doi.org/10.1183/09031936.00167908 [DOI] [PubMed] [Google Scholar]
- 41. Camiciottoli G,Cavigli E,Grassi L,et al. Prevalence and correlates of pulmonary emphysema in smokers and former smokers. A densitometric study of participants in the ITALUNG trial. Eur Radiol. 2009;19(1):58-66. doi: http://dx.doi.org/10.1007/s00330-008-1131-6 [DOI] [PubMed] [Google Scholar]
- 42. Ashraf H,Lo P,Shaker SB,et al. Short-term effect of changes in smoking behaviour on emphysema quantification by CT. Thorax. 2011;66(1):55-60. doi: http://dx.doi.org/10.1136/thx.2009.132688 [DOI] [PubMed] [Google Scholar]
- 43. Shaker SB,Stavngaard T,Laursen LC,Stoel BC,Dirksen A. Rapid fall in lung density following smoking cessation in COPD. COPD. 2011;8(1):2-7. doi: http://dx.doi.org/10.3109/15412555.2010.541306 [DOI] [PubMed] [Google Scholar]
- 44. Bakker ME,Stolk J,Putter H,et al. Variability in densitometric assessment of pulmonary emphysema with computed tomography. Invest Radiol. 2005;40(12):777-783. doi: http://dx.doi.org/10.1097/01.rli.0000186418.31139.21 [DOI] [PubMed] [Google Scholar]
- 45. Stoel BC,Putter H,Bakker ME,et al. Volume correction in computed tomography densitometry for follow-up studies on pulmonary emphysema. Proc Am Thorac Soc. 2008;5(9):919-924. doi: http://dx.doi.org/10.1513/pats.200804-040QC [DOI] [PubMed] [Google Scholar]
- 46. Dirksen A,Piitulainen E,Parr DG,et al. Exploring the role of CT densitometry: a randomised study of augmentation therapy in alpha1-antitrypsin deficiency. Eur Respir J. 2009;33(6):1345-1353. doi: http://dx.doi.org/10.1183/09031936.00159408 [DOI] [PubMed] [Google Scholar]
- 47. Stockley RA,Parr DG,Piitulainen E,Stolk J,Stoel BC,Dirksen A. Therapeutic efficacy of alpha-1 antitrypsin augmentation therapy on the loss of lung tissue: an integrated analysis of 2 randomised clinical trials using computed tomography densitometry. Respir Res. 2010;7(1):32-43. doi: http://dx.doi.org/10.1186/1465-9921-11-136 [DOI] [PMC free article] [PubMed] [Google Scholar]
- 48. Mohamed Hoesein FA,Zanen P,de Jong PA,et al. Rate of progression of CT-quantified emphysema in male current and ex-smokers: a follow-up study. Respir Res. 2013;14:55-55. doi: http://dx.doi.org/10.1186/1465-9921-14-55 [DOI] [PMC free article] [PubMed] [Google Scholar]
- 49. Staring M,Bakker ME,Stolk J,Shamonin DP,Reiber JH,Stoel BC. Towards local progression estimation of pulmonary emphysema using CT. Med Phys. 2014;41(2):21905-21905. doi: http://dx.doi.org/10.1118/1.4851535 [DOI] [PubMed] [Google Scholar]
- 50. Murphy K,Pluim JPW,van Rikxoort EM,et al. Toward automatic regional analysis of pulmonary function using inspiration and expiration thoracic CT. Med Phys. 2012;39(3):1650-1662. doi: http://dx.doi.org/10.1118/1.3687891 [DOI] [PubMed] [Google Scholar]
- 51. Mets OM,Willemink MJ,de Kort FP,et al. The effect of iterative reconstruction on computed tomography assessment of emphysema, air trapping and airway dimensions. Eur Radiol. 2012;22(10):2103-2109. doi: http://dx.doi.org/10.1007/s00330-012-2489-z [DOI] [PMC free article] [PubMed] [Google Scholar]
- 52. Mohamed Hoesein FA,de Jong PA,Lammers JW,et al. Computed tomography structural lung changes in discordant airflow limitation. PLoS One. 2013;8(6):e65177-e65177. doi: http://dx.doi.org/10.1371/journal.pone.0065177 [DOI] [PMC free article] [PubMed] [Google Scholar]
- 53. Barbosa EM Jr.,Song G,Tustison N,et al. Computational analysis of thoracic multidetector row HRCT for segmentation and quantification of small airway air trapping and emphysema in obstructive pulmonary disease. Acad Radiol. 2011;18(10):1258-1269. doi: http://dx.doi.org/10.1016/j.acra.2011.06.004 [DOI] [PubMed] [Google Scholar]
- 54. Galban CJ,Han MK,Boes JL,et al. Computed tomography-based biomarker provides unique signature for diagnosis of COPD phenotypes and disease progression. Nat Med. 2012;18(11):1711-1715. doi: http://dx.doi.org/10.1038/nm.2971 [DOI] [PMC free article] [PubMed] [Google Scholar]
- 55. Grydeland TB,Thorsen E,Dirksen A,et al. Quantitative CT measures of emphysema and airway wall thickness are related to D(L)CO. Respir Med. 2011;105(3):343-351. doi: http://dx.doi.org/10.1016/j.rmed.2010.10.018 [DOI] [PubMed] [Google Scholar]
- 56. Nakano Y,Wong JC,de Jong PA,et al. The prediction of small airway dimensions using computed tomography. Am J Respir Crit Care Med. 2005;171(2):142-146. doi: http://dx.doi.org/10.1164/rccm.200407-874OC [DOI] [PubMed] [Google Scholar]
- 57. Grydeland TB,Dirksen A,Coxson HO,et al. Quantitative computed tomography measures of emphysema and airway wall thickness are related to respiratory symptoms. Am J Respir Crit Care Med. 2010;181(4):353-359. doi: http://dx.doi.org/10.1164/rccm.200907-1008OC [DOI] [PubMed] [Google Scholar]
- 58. Washko GR,Dransfield MT,Estepar RSJ,et al. Airway wall attenuation: a biomarker of airway disease in subjects with COPD. J Appl Physiol. 2009;107(1):185-191. doi: http://dx.doi.org/10.1152/japplphysiol.00216.2009 [DOI] [PMC free article] [PubMed] [Google Scholar]
- 59. Ginsburg SB,Lynch DA,Bowler RP,Schroeder JD. Automated texture-based quantification of centrilobular nodularity and centrilobular emphysema in chest CT images. Acad Radiol. 2012;19(10):1241-1251. doi: http://dx.doi.org/10.1016/j.acra.2012.04.020 [DOI] [PMC free article] [PubMed] [Google Scholar]
- 60. Castaldi PJ,San Jose Estepar R,Mendoza CS,et al. Distinct quantitative computed tomography emphysema patterns are associated with physiology and function in smokers. Am J Respir Crit Care Med. 2013;188(9):1083-1090. doi: http://dx.doi.org/10.1164/rccm.201305-0873OC [DOI] [PMC free article] [PubMed] [Google Scholar]
- 61. Barr RG,Berkowitz EA,Bigazzi F,et al. A combined pulmonary-radiology workshop for visual evaluation of COPD: study design, chest CT findings and concordance with quantitative evaluation. COPD. 2012;9(2):151-159. doi: http://dx.doi.org/10.3109/15412555.2012.654923 [DOI] [PMC free article] [PubMed] [Google Scholar]
- 62. de Torres JP,Bastarrika G,Wisnivesky JP,et al. Assessing the relationship between lung cancer risk and emphysema detected on low-dose CT of the chest. Chest. 2007;132(6):1932-1938. doi: http://dx.doi.org/10.1378/chest.07-1490 [DOI] [PubMed] [Google Scholar]
- 63. Wilson DO,Weissfeld JL,Balkan A,et al. Association of radiographic emphysema and airflow obstruction with lung cancer. Am J Respir Crit Care Med. 2008;178(7):738-744. doi: http://dx.doi.org/10.1164/rccm.200803-435OC [DOI] [PMC free article] [PubMed] [Google Scholar]
- 64. Gierada DS,Guniganti P,Newman BJ,et al. Quantitative CT assessment of emphysema and airways in relation to lung cancer risk. Radiology. 2011;261(3):950-959. doi: http://dx.doi.org/10.1148/radiol.11110542 [DOI] [PMC free article] [PubMed] [Google Scholar]
- 65. Wilson DO,Leader JK,Fuhrman CR,Reilly JJ,Sciurba FC,Weissfeld JL. Quantitative computed tomography analysis, airflow obstruction, and lung cancer in the pittsburgh lung screening study. J Thorac Oncol. 2011;6(7):1200-1205. doi: http://dx.doi.org/10.1097/JTO.0b013e318219aa93 [DOI] [PMC free article] [PubMed] [Google Scholar]
- 66. Kishi K,Gurney JW,Schroeder DR,Scanlon PD,Swensen SJ,Jett JR. The correlation of emphysema or airway obstruction with the risk of lung cancer: a matched case-controlled study. Eur Respir J. 2002;19(6):1093-1098. doi: http://dx.doi.org/10.1183/09031936.02.00264202 [DOI] [PubMed] [Google Scholar]
- 67. Mets OM,van Hulst RA,Jacobs C,van Ginneken B,de Jong PA. Normal range of emphysema and air trapping on CT in young men. AJR Am J Roentgenol. 2012;199(2):336-340. doi: http://dx.doi.org/10.2214/AJR.11.7808 [DOI] [PubMed] [Google Scholar]
- 68. Zach JA,Newell JD Jr.,Schroeder J,et al. Quantitative computed tomography of the lungs and airways in healthy nonsmoking adults. . 2012;47(10):596-602. doi: http://dx.doi.org/10.1097/RLI.0b013e318262292e [DOI] [PMC free article] [PubMed] [Google Scholar]
- 69. Smith BM,Barr RG. Establishing normal reference values in quantitative computed tomography of emphysema. J Thorac Imaging. 2013;28(5):280-283. doi: http://dx.doi.org/10.1097/RTI.0b013e3182a0d805 [DOI] [PMC free article] [PubMed] [Google Scholar]
- 70. Subramanian DR,Jenkins L,Edgar Quraishi N,Stockley RA,Parr DG. Assessment of pulmonary neutrophilic inflammation in emphysema by quantitative positron emission tomography. Am J Respir Crit Care Med. 2012;186(11):1125-1132. doi: http://dx.doi.org/10.1164/rccm.201201-0051OC [DOI] [PubMed] [Google Scholar]
- 71. Torigian DA,Dam V,Chen X,et al. In vivo quantification of pulmonary inflammation in relation to emphysema severity via partial volume corrected (18)F-FDG-PET using computer-assisted analysis of diagnostic chest. CT Hell J Nucl Med. 2013;16(1):12-18. [DOI] [PubMed] [Google Scholar]
- 72. Gierada DS,Woods JC,Jacob RE,et al. Emphysema quantification in inflation-fixed lungs using low-dose computed tomography and 3He magnetic resonance imaging. J Comput AssistTomogr. 2010;34(5):773-779. doi: http://dx.doi.org/10.1097/RCT.0b013e3181e480f9 [DOI] [PMC free article] [PubMed] [Google Scholar]
- 73. Emami K,Chia E,Kadlecek S,et al. Regional correlation of emphysematous changes in lung function and structure: a comparison between pulmonary function testing and hyperpolarized MRI metrics. J Appl Physiol. 2011;110(1):225-235. doi: http://dx.doi.org/10.1152/japplphysiol.00269.2010 [DOI] [PMC free article] [PubMed] [Google Scholar]
- 74. Marshall H,Deppe MH,Parra-Robles J,et al. Direct visualisation of collateral ventilation in COPD with hyperpolarised gas MRI. Thorax. 2012;67(7):613-617. doi: http://dx.doi.org/10.1136/thoraxjnl-2011-200864 [DOI] [PubMed] [Google Scholar]
- 75. Quirk JD,Lutey BA,Gierada DS,et al. In vivo detection of acinar microstructural changes in early emphysema with (3)He lung morphometry. Radiology. 2011;260(3):866-874. doi: http://dx.doi.org/10.1148/radiol.11102226 [DOI] [PMC free article] [PubMed] [Google Scholar]
- 76. Wang C,Mugler JP 3rd,de Lange EE,Patrie JT,Mata JF,Altes TA. Lung injury induced by secondhand smoke exposure detected with hyperpolarized helium-3 diffusion MR. J Magn Reson Imaging. 2014;39(1):77-84. doi: http://dx.doi.org/10.1002/jmri.24104 [DOI] [PMC free article] [PubMed] [Google Scholar]
- 77. Kirby M,Svenningsen S,Kanhere N,et al. Pulmonary ventilation visualized using hyperpolarized helium-3 and xenon-129 magnetic resonance imaging: differences in COPD and relationship to emphysema. J Appl Physiol. 2013;114(6):707-715. doi: http://dx.doi.org/10.1152/japplphysiol.01206.2012 [DOI] [PubMed] [Google Scholar]
- 78. Iguchi S,Imai H,Hori Y,Nakajima J,Kimura A,Fujiwara H. Direct imaging of hyperpolarized 129Xe alveolar gas uptake in a mouse model of emphysema. Magn Reson Med. 2013;70(1):207-215. doi: http://dx.doi.org/10.1002/mrm.24452 [DOI] [PubMed] [Google Scholar]
- 79. Ouriadov A,Farag A,Kirby M,McCormack DG,Parraga G,Santyr GE. Lung morphometry using hyperpolarized (129) Xe apparent diffusion coefficient anisotropy in chronic obstructive pulmonary disease. Magn Reson Med. 2013;70(6):1699-1706. doi: http://dx.doi.org/10.1002/mrm.24595 [DOI] [PubMed] [Google Scholar]
- 80. Kirby M,Svenningsen S,Owrangi A,et al. Hyperpolarized 3He and 129Xe MR imaging in healthy volunteers and patients with chronic obstructive pulmonary disease. Radiology. 2012;265(2):600-610. doi: http://dx.doi.org/10.1148/radiol.12120485 [DOI] [PubMed] [Google Scholar]
- 81. Halaweish AF,Moon RE,Foster WM,et al. Perfluoropropane gas as a magnetic resonance lung imaging contrast agent in humans. Chest. 2013;144(4):1300-1310. doi: http://dx.doi.org/10.1378/chest.12-2597 [DOI] [PubMed] [Google Scholar]
- 82. Wielputz M,Kauczor HU. MRI of the lung: state of the art. Diagn Interv Radiol. 2012;18(4):344-353. [DOI] [PubMed] [Google Scholar]
- 83. Eichinger M,Tetzlaff R,Puderbach M,Woodhouse N,Kauczor HU. Proton magnetic resonance imaging for assessment of lung function and respiratory dynamics. Eur J Radiol. 2007;64(3):329-334. doi: http://dx.doi.org/10.1016/j.ejrad.2007.08.007 [DOI] [PubMed] [Google Scholar]
- 84. Ley-Zaporozhan J,Ley S,Eberhardt R,Kauczor HU,Heussel CP. Visualization of morphological parenchymal changes in emphysema: comparison of different MRI sequences to 3D-HRCT. Eur J Radiol. 2010;73(1):43-49. doi: http://dx.doi.org/10.1016/j.ejrad.2008.09.029 [DOI] [PubMed] [Google Scholar]
- 85. Zurek M,Boyer L,Caramelle P,Boczkowski J,Cremillieux Y. Longitudinal and noninvasive assessment of emphysema evolution in a murine model using proton MRI. Magn Reson Med. 2012;68(3):898-904. doi: http://dx.doi.org/10.1002/mrm.23281 [DOI] [PubMed] [Google Scholar]


