

Abstract
Purpose
Head and neck cancers (HNC) often induce profound immunosuppression which contributes to disease progression and interferes with immune-based therapies. Body fluids of HNC patients are enriched in exosomes potentially engaged in negative regulation of anti-tumor immune responses. The presence and content of exosomes derived from plasma of HNC patients are evaluated for the ability to induce immune dysfunction and influence disease activity.
Experimental Design
Exosomes were isolated by size-exclusion chromatography from plasma of 38 HNC patients and 14 healthy donors. Morphology, size, numbers and protein and molecular contents of the recovered exosomes were determined. Co-culture assays were performed to measure exosome-mediated effects on functions of normal human lymphocyte subsets and natural killer (NK) cells. The results were correlated with disease stage and activity.
Results
The presence, quantity and molecular content of isolated, plasma-derived exosomes discriminated HNC patients with active disease (AD) from those with no evident disease (NED) after oncological therapies. Exosomes of patients with AD were significantly more effective than exosomes of patients with NED in inducing apoptosis of CD8+ T cells, suppression of CD4+ T cell proliferation and up-regulation of regulatory T cell (Treg) suppressor functions (all at p < 0.05). Exosomes of AD patients also down-regulated NKG2D expression levels in NK cells.
Conclusions
Exosomes in plasma of HNC patients carry immunosuppressive molecules and interfere with functions of immune cells. Exosome-induced immune suppression correlates with disease activity in HNC, suggesting that plasma exosomes could be useful as biomarkers of HNC progression.
Keywords: Exosomes, head and neck cancer, disease activity, immune suppression, T-cell functions
Introduction
Head and neck cancers (HNCs) are among the most immunosuppressive human malignancies. These tumors produce a variety of inhibitory factors which interfere with anti-tumor immune responses (1–3). Immune abnormalities correlate with disease activity and are more pronounced in patients with active disease (AD) than those with no evident disease (NED) following therapy. More recently, immune dysfunction in patients with HNC has also been linked to disease progression and outcome (4–6). Thus, the integrity of anti-tumor immune responses is critical for the patients’ ability to deal with the disease and to respond to therapies.
Among numerous mechanisms shown to mediate immune suppression in patients with HNC (7–9), tumor-derived exosomes or TEX, which carry immunosuppressive factors and/or ligands, are emerging as an important negative regulator of anti-tumor immune responses (10, 11). TEX carrying inhibitory ligands that bind to cognate receptors on immune cells deliver tolerogenic signals to immune cells and blunt anti-tumor immunity (reviewed in ref. 10). Importantly, we have reported in a series of ex vivo studies with human T cells, natural killer (NK) cells and dendritic (DC) cells that these immune cells can be protected, at least in part, from suppressive signals delivered by TEX by pre-treatment with a mix of cytokines produced by PHA-activated peripheral blood lymphocytes and called IRX-2 (12–15). In aggregate, our earlier data indicated that exosomes represent a ubiquitous as well as very effective mechanism of tumor escape from the host immune system, and that this mechanism could be therapeutically controlled.
To date, most studies of vesicle-mediated immune suppression were performed with extracellular vesicles (EVs) isolated from supernatants of tumor cell lines and, less frequently, from plasma of cancer patients (16, 17). Exosomes, the smallest of EVs (30–150nm), are derived from the endocytic compartment of the parent cells (18), carry unique cargos and are functionally distinct from the larger EVs (microvesicles and apoptotic bodies) (19). Their isolation from supernatants or body fluids and subsequent molecular/functional characterization requires methods allowing for separation of exosomes from a heterogeneous mix of EVs. We have recently described a method combining differential centrifugation, ultrafiltration and size exclusion chromatography that allows for an efficient, high-throughput isolation of morphologically-intact, functionally-active exosomes from plasma of patients with cancer (20). This method has been used to obtain exosome fractions from plasma of HNC patients and to evaluate their effects on normal human immune cell subsets. Further, our data indicate that exosomes present in the peripheral circulation of patients with HNC play a key role in immune regulation during cancer progression and response to therapy. Our data suggest that monitoring the protein content, molecular profiles and suppressive functions of exosomes isolated from patients’ plasma offers an opportunity for defining the extent and levels of immune suppression prior to and during therapy. In aggregate, we demonstrate that exosome-mediated immune suppression can be reliably measured ex vivo and may represent a clinically useful biomarker for the integrity of the immune system in patients at diagnosis and during oncological therapies.
Materials and Methods
Plasma specimens and isolation of peripheral blood mononuclear cells (PBMC)
Peripheral venous blood specimens were collected from patients with HNC (n = 38) or healthy volunteers (n = 14) after informed consent was obtained from all individuals. The study was approved by the Institutional Review Board of the University of Pittsburgh (IRB #960279, IRB#0403105 and IRB #0506140) and was conducted in accordance with the International Ethical Guidelines for Biomedical Research Involving Human Subjects (CIOMS). The HNC patients were seen at the UPMC Otolaryngology Clinic between years 2014 and 2016. Samples were obtained from 19 patients with active disease (AD) prior to any therapy, 15 patients with no evident disease (NED) following oncological therapies (selected at random in respect to time since last therapy) and 4 patients with recurrent disease (REC). The blood samples were delivered to the laboratory and immediately centrifuged at 1,000 × g for 10 min to separate the plasma from blood components. Plasma was stored in 2 mL aliquots at −80°C. Peripheral blood obtained from healthy volunteers was used for the PBMC isolation on Ficoll-Paque Plus gradients (GE Healthcare Bioscience, Pittsburgh, PA, USA). Cells were washed in RPMI medium (Lonza, Basel, CH) supplemented with 10% (v/v) exosome-depleted fetal bovine serum (FBS, Gibco, Thermo Scientific, Pittsburgh, PA, USA) and immediately used for experiments. CD8+T cells, CD4+T cells and NK cells were isolated by negative selection on AutoMACS (Miltenyi, San Diego, CA, USA) using an isolation kit for CD8+, CD4+ T cells and NK cells (Miltenyi) as previously described (21). CD4+CD39+ Tregs were isolated as described by Schuler et al (22).
Exosome isolation from plasma by mini size-exclusion chromatography (mini-SEC)
Thawed plasma samples were differentially centrifuged 2,000×g for 10min at room temperature (RT) and then at 14,000×g for 30 min at 4°C. Next, plasma was ultrafiltrated using a 0.22μm filter (EMD Millipore, Billerica, MA, USA). Self-made mini-SEC columns were prepared as previously described (20). The void volume fractions (1 mL) were collected, with exosomes eluting in fractions #3–5. The fraction #4 contained the bulk of eluted exosomes as previously reported (20). The eluted exosomes were characterized for the protein content, size, particle numbers, morphology, molecular profiles and suppressive functions as described below.
Protein determination
Protein content and concentration of the isolated exosomal fractions were determined using the Pierce BCA protein assay kit (Pierce Biotechnology, Rockford, lL, USA) following the manufacturer’s instructions. The protein concentrations are calculated as μg protein/1mL plasma loaded onto the mini-SEC column.
Exosome size and concentration assessment by tunable resistive pulse sensing (TRPS)
Size ranges and concentrations of isolated exosome fractions were measured using TRPS as recommended by the system manufacturer Izon (Cambridge, MA, USA). Nanopores NP150 were coated with different buffers from the reagent kit supplied by Izon. Immediately before and after each experiment, calibration beads provided in the kit (200EV, at the 1:1 ratio) were tested under the same conditions used for the samples. A small volume (10uL) of the exosome fraction #4 was diluted 1:10 in 0.03% Tween-20 in PBS and loaded on the Nanopore. The measurement conditions for the sample were as follows: NP#37266, stretch 45.6mm, voltage 0.68V, current 144–150nA and 2 pressure steps 5–12 mbar. Each particle was measured by a short drop of the current (blockade). At least 500 particles and two pressure levels were recorded for both, samples and calibration beads. The Izon software version 3.2 was used for data recording and for calculating nanoparticle size ranges and concentrations.
Transmission electron microscopy (TEM)
Transmission electron microscopy was performed as previously described (23) at the Center for Biologic Imaging at the University of Pittsburgh. Freshly isolated exosomes were layered on copper grids with 0.125% Formvar in chloroform and stained with 1% uranyl acetate in ddH2O. Immediately, exosomes on the grids were visualized by the transmission electron microscope JEOL JEM-1011.
Western blots
For analyses by Western blots exosome fraction #4 was concentrated on Vivaspin 500 (VS0152, 300,000 MWCO, Sartorius, Göttingen, Germany). Exosomes were tested for the presence of exosomal markers, including TSG101 and of other protein markers of interest as previously described (20). Briefly, exosomes were lysed in Lane Marker Reducing Sample Buffer (Pierce, Thermo Scientific) separated on 7–15% SDS/PAGE gels (Bio-Rad) always applying 10μg protein/lane and transferred onto an Immobilon-P PVDF membrane (EMD Millipore) for Western blotting. Membranes were incubated overnight at 4°C with antibodies purchased from various vendors as indicated and used at the following dilutions: from Abcam (Cambridge, MA, USA): TSG101 (1:500, ab30871), Fas (1:1000, ab133619), FasL (1:500, ab68338), CTLA-4 (1:5000, ab134090), TRAIL (1:500, ab2056), PD-L1 (1:400, ab58810), CD80 (1:1000, ab134120), OX40L/CD252 (1:1000, ab108083), CD70 (1:1000, ab96323); from Santa Cruz (Dallas, TX, USA): CD39 (1:400, sc-33558), CD73 (1:400, sc-25603), COX-2 (1:500, sc-1745), Bcl-2 (1:500, sc-509); from R&D (Minneapolis, MN, USA): PD-1 (1:500, MAB1086); from Cell Signaling (Danvers, MA, USA): TGF-β1 (1:1000, #3711) or from Sigma Aldrich: PRAME (1:1000, SAB1401590). HRP-conjugated secondary antibody (1:3000–1:5000, Pierce, Thermo Fisher) was added for 1h at room temperature (RT), and blots were developed with ECL detection reagents (GE Healthcare Biosciences). The blots were semi-quantitated by densitometry using software Image J. The integrated pixel value was determined for each protein band by multiplying image intensity and the band area after subtracting the mean background value.
Functional studies
Apoptosis assays in CD8+ cells
Freshly isolated CD8+ T cells (106/mL) were activated with CD3/CD28 T-cell activator (25μl/ml, Stemcell, Vancouver, BC, CA) and IL-2 (150IU/ml, PeproTech, Bionity, Rocky Hill, CT, USA) in freshly-prepared RPMI for 48h. In some experiments, CD8+ Jurkat cells (106/ml) were plated in a 96-well plate (105cells/well) in MV-depleted RPMI for 24h. Next, exosomes (2–3μg in 50μL PBS) isolated from plasma of HNC patients with AD, REC or NED and from plasma of NDs were added and co-cultures were incubated for 24h. Co-cultures containing no exosomes (=50μL PBS) served as controls. Apoptosis of CD8+ T cells was measured by flow cytometry using an Annexin V assay (Beckman Coulter, Atlanta, GA, USA) and Accuri flow cytometer (BD Bioscience, San Jose, CA, USA). Additionally, Caspase 3/7 activity was measured in some experiments using Caspase 3/7 Glo and Cell Titer Glo Viability assays following the manufacturer’s instructions (Promega, Madison, Wi, USA) and assessed in GloMax 96 Microplate Luminometer (Promega).
CFSE-based CD4+ proliferation assay
CD4+ T cells isolated from PBMC of normal donors were labeled with 1.5 μM CFSE (Cell Trace, Thermo Scientific) in 0.1% BSA in PBS (w/v) for 10 min at 37°C. The staining was quenched with an equal volume of exosome-depleted FBS (21). CFSE-labeled T cells (105 cells/well) were activated with CD3/28 beads (cell to bead ratio 1:1, T cell activation/expansion kit, Miltenyi) for 24h and co-incubated with exosomes (2–3μg of fraction #4 in 50μL PBS) for 3 days at 37°C. Proliferation of T cells was measured on day 4 by flow cytometry, and the data were analyzed by Modfit (Verity Software House). The percentage suppression of proliferation in co-cultures with exosomes was calculated as described by us (24) and compared to control T cells incubated alone or with exosomes isolated from plasma of NC.
CD39 induction in CD4+ T cells by patients’ exosomes
Freshly isolated, normal human resting CD4+ T cells (105/100ul) were co-incubated with exosomes (2–3μg in 50μL PBS) isolated from patients with AD or NED and from NDs’ plasma in the presence of 20μM of exogenous ATP. Samples incubated with no exosomes (PBS only) and no ATP were used as controls. CD4-PE (Beckman Coulter) and CD39-FITC (eBioscience) expression and appropriate isotype controls were used to phenotype the T cells by flow cytometry after 20h of co-incubation.
Adenosine production by CD4+CD39+ Treg co-incubated with exosomes
25,000 freshly isolated, normal human resting CD4+CD39+ in 50μl PBS were co-incubated with exosomes isolated from plasma of patients with AD, NED and NDs under conditions described above in the presence of 20μM ATP for 1h (25). Concentrations of 5’-AMP and adenosine (ADO) and their degradation products (Inosine, Hypoxanthine and Xanthine) were measured by mass spectrometry as previously described (25). As controls, Treg incubated without ATP and ATP in PBS only were used.
Exosome-induced down-regulation of NKG2D expression on natural killer (NK) cells
Resting PBMC obtained from healthy donors were co-incubated with or without exosomes as described above for 24h. Exosome-induced downregulation of NKG2D expression levels (MFI) and percentages of NKG2D+ cells were determined by gating on CD3−CD56+ NK cells as previously described (20).
NKG2D-PE antibody and matching isotype control were purchased from Beckman Coulter.
Cytotoxicity assay
Flow cytometry-based cytototoxicity assays (26) with K562 serving as target cells and activated NK cells treated or not with ± exosomes as effector cells were performed as described by us with minor modifications. NK cells (106 cells/ml) isolated from PBMCs of NDs were activated with IL-2 (1000IU/ml, Peprotech) for 48h. On day 2, exosomes (2–3μg of fraction #4 in 50μL PBS) isolated from plasma of HNC patients or ND were added to 150×103 activated NK cells placed in wells of a 96-well plate. Aliquots of PBS (50μL; No exosomes) were added to control wells. Following 24h co-incubation 30×103 CFSE-labeled K562 target cells were added to the wells to obtain the NK: K562 ratio of 5:1. In preparation for the assay, K562 cells were labeled with CFSE for 10 min, washed twice with complete RPMI medium and reconstituted to the concentration of 106cells/mL. Plated K562 targets and effector NK cells ± exosomes were co-incubated for 4h at 37°C in the atmosphere of 5% CO2 in air. Next, cells were stained with 7-AAD (eBioscience, San Diego, CA, USA). Cytotoxicity was determined by gating on CFSE-positive K562 cells and estimating the percentage of these cells that were also stained with 7-AAD. In parallel NKG2D downregulation was determined in activated NK cells only ± exosomes.
Data analysis
Data were summarized by descriptive statistics (IBM SPSS, version 23) such as means and standard errors (SE). Statistical analysis was performed using GraphPad Prism (version 6). As parametric tests unpaired t test or one-way ANOVA and for non-parametric data Mann-Whitney U or Kruskal-Wallis tests were used. T-cell proliferation in CFSE-based assays was assessed with Modfit (Verity software house, version 4). Flow analyses were performed with VenturiOne version 5.0 or Kaluza v1.5 (Beckman Coulter). A p-value of <0.05 was considered to be statistically significant.
Results
Clinicopathological characteristics of the study patients
The clinicopathological characteristics of the patients who contributed specimens for the study are listed in Supplemental Table 1. The patient age and gender are representative for HNC patients, with an average age of 60 years (range: 24–79 years) and predominantly male (76% vs. 24%). Primary tumor sites were oral cavity (61%) and oropharynx (34%). Only 2 larynx patients (5%) were included. At blood draw, disease status was AD in 19 patients (50%), REC in 4 patients (11%) and NED in 15 patients (39%). The numbers of patients with the early stage (UICC stage I or II) vs late stage (UICC stage III or IV) disease were at the ratio of 2:3. Most patients (39%) had small tumors (T1 or T2) or a negative nodal status (N0, 55%). No patient had distant metastases at the time of diagnosis. The majority of 23 patients had intermediately differentiated tumors (G2). HPV status, routinely determined by p16 immunohistochemistry, was positive in 10 patients, negative in 8 patients and undetermined in 20 patients with non-oropharyngeal cancer. The majority (50% patients) consumed alcohol and/or tobacco at the time of diagnosis. As treatment, 19 patients (50%) underwent surgery alone, 18 patients (47%) had surgery with an adjuvant therapy (radiotherapy and/or chemoradiotherapy) and 1 patient was treated with primary chemoradiotherapy.
Exosomal protein content in plasma of AD and NED patients
Exosome recovery from plasma (μg protein/mL of plasma in the fraction #4) was significantly greater in AD patients than in NED patients or NDs (Figure 1A). Importantly, in patients with NED after therapy, protein levels in total exosomal fractions were the same as those in ND (Figure 1A). Exosomes isolated from plasma of AD patients with early disease (stage I/II) had significantly lower exosome protein levels than those isolated from AD patients with advanced (stage III/IV) disease (Figure 1B). Interestingly, somewhat higher exosomal protein levels (NSD) were observed in patients who underwent surgery with adjuvant therapy (chemotherapy alone or chemoradiotherapy) compared to patients who had surgery only (Figure 1C).
Figure 1. Protein levels in exosomes isolated from plasma of HNC patients or NDs.
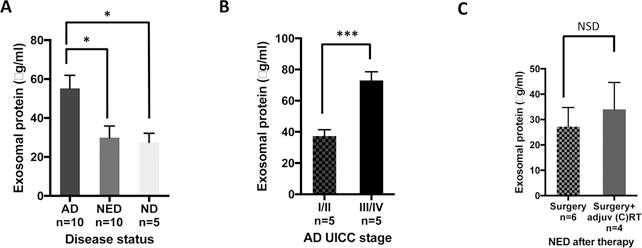
Following mini-SEC isolation of exosomes in fraction #4, total exosomal protein was measured in BCA assays. (A) Exosome protein levels are significantly higher in AD compared to NED and ND (p<0.01), whereas exosome protein levels in NED and ND are similar. (B) In AD patients, exosomes from plasma of advanced HNCs (UICC stage III/IV) have significantly higher protein levels than those from early stage diseases (UICC stage I/II) (p<0.001). (C) Following surgery alone, NED patients’ exosomes tend to have lower protein levels than exosomes from plasma of patients treated with surgery plus adjuvant oncotherapy. The data in A-C are mean values ±SEM.
Higher particle concentrations in exosomal fractions isolated from plasma of AD vs NED patients
Tunable Resistive Pulse Sensing (TRPS or qNano) measurements were performed with exosomes recovered in fractions #4 from plasma of 3 AD and 3 NED patients as well as 3 NDs. Size ranges and mean sizes were similar in all three groups (size range ~40–150nm, mean diameter ~71–84nm). The average particle count was highest in AD patients (363 × 109 particles/mL), intermediate in NED patients (207 × 109 particles/mL) and lowest in ND specimens (7 × 10⁹ particles/mL). These differences in particle concentration levels are significant for all cohorts and are in agreement with protein levels for the exosomal fractions in AD, NED and NDs, as shown in Figure 2. Thus, both the protein content and exosome numbers were highest in plasma of patients with AD.
Figure 2. Size distributions and particle concentrations in exosome #4 fractions isolated from plasma of HNC patients and NDs.
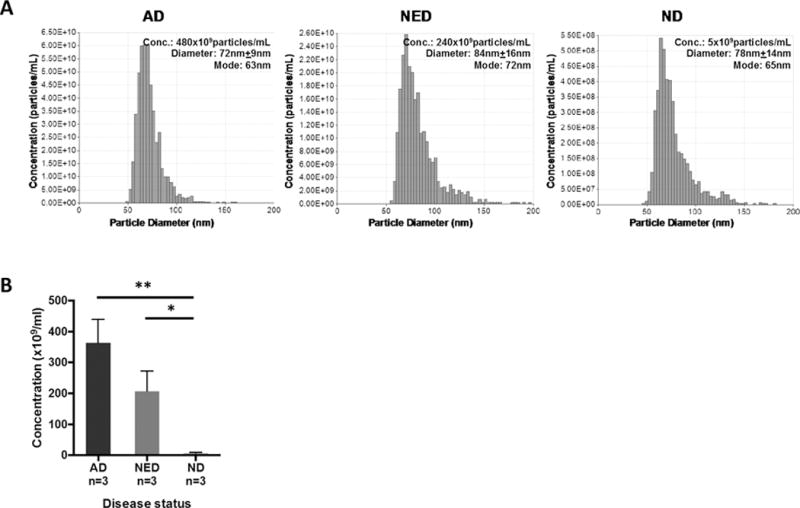
In (A), representative data obtained with fraction #4 exosomes from AD, NED or ND plasma show the same size distribution, while numbers of the recovered particles are highest in the AD #4 fraction. In (B), the combined data for 3 different exosome donors in each cohort are shown. The mean particle concentration is highest in AD patients, intermediate in NED and lowest in NDs (**AD vs. ND p<0.01; * NED vs. ND p<0.05). The data are mean values ± SEM.
Characterization of exosomes recovered from patients’ plasma
While the recovery of exosomes was greater in patients with HNC than in NDs, it was necessary to prioritize the assays selected for exosome characterization. Thus, not all functional assays could be performed in all patients. In most cases, the results obtained were representative of 8–10 subjects in each patient cohort (AD vs NED). In NDs, low levels of plasma-derived exosomes limited exosome analysis to few parameters.
Morphological features of exosomes isolated from plasma of AD or NED patients
The representative TEM images of exosomes isolated by mini-SEC from plasma of HNC patients with AD or NED and from plasma of NDs are shown in Figure 3. Freshly-isolated exosomes eluting in #4 fractions appeared as intact vesicles ranging in size from 30 to 100nm and were morphologically identical.
Figure 3. Transmission electron microscopy (TEM) images of exosomes isolated from plasma of HNC patients and a ND.
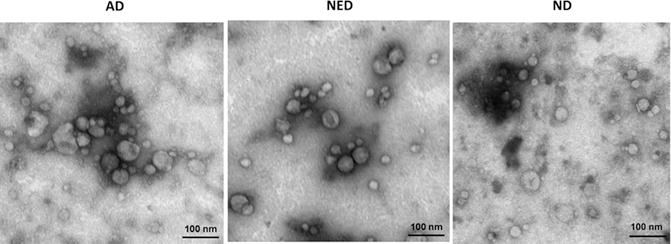
Exosomes appear as vesicles ranging in size from 30 to 100nm. Exosome morphology is the same for AD and NED patients and the ND. The shown images are representative for 1/5 exosome fractions examined for each cohort.
Western blot profiles of exosomes from plasma of AD and NED patients
Western blots were performed following exosome concentration by Vivaspin 500 (MWCO 300,000), which was necessary to be able to consistently load 10μg exosomal protein/lane on SDS gels. The composite Western blot shown in Figure 4 presents exosome protein profiles for 4 patients with AD, 4 patients with NED and one ND. The objective was to look for differences in the cargo of exosomes obtained from plasma of HNC patients with AD vs. NED. Among the patients, the first two vertical blot profiles are for exosomes of patients with UICC stage I/II disease, the next two are for patients with UICC stage III/IV disease. Because exosomes are known to carry immunosuppressive as well as immuno-activating proteins (27), we selected and respectively blotted for several of these proteins, as shown in the blot horizontal sections A and B. Section C shows expression of TSG101 used as an exosome marker and of PRAME used here as a marker of exosomes potentially derived from the tumor (28). Figure 4A shows that the protein profiles are different for every subject. The NED protein profiles tend to resemble those seen with the exosomes of ND. The presence of multiple immunosuppressive molecules at various levels in exosomes of patients as well as of NDs is evident. Densitometry measurements of individual protein bands for 9 immunosuppressive proteins (PD-1, PD-L1, Fas, FasL, CTLA-4, TRAIL, CD73, COX2, and TGFβ-LAP) visualized by Western blots (Figure 4A) allowed us to compare relative densities of the bands in exosomes isolated from plasma of AD vs NED patients (Table 1 and Supplemental Figure 1). Densities for 6/9 of immunosuppressive proteins were higher in exosomes of AD patients than NED patients even though exosomes of only 4 patients in each cohort could be blotted for all 9 proteins. Statistical analysis was not attempted, but representative densitometry data for TGF-β/LAP in Supplemental Figure 1 indicate higher expression levels of this protein in exosomes of AD than NED patients. In Figure 1B, we showed that exosome protein levels were higher on AD patients with stage III/IV than stage I/II disease. Densitometry of the respective bands in Figure 4A also suggested that this might be the case for some of the inhibitory proteins (data not shown). Figure 4B also indicates that levels of activating proteins were somewhat lower in exosomes of AD patients with stage III/IV than stage I/II disease and tended to increase, albeit variably, in exosomes of patients with NED. Exosomal levels of PRAME did not change from patient to patient, and its presence in exosomes of ND indicates it cannot be considered as a potential tumor marker in HNC or a marker of exosome origin from tumor cells. Overall, the cargos of exosomes from plasma of AD patients with advanced disease were enriched in proteins such as COX-2, TGFβ-LAP, PD-1, CTLA-4 and TRAIL. Their levels were variably decreased in exosomes obtained from plasma of patients with NED (Table 1).
Figure 4. Molecular protein profiles of plasma exosomes from AD and NED patients and a ND.
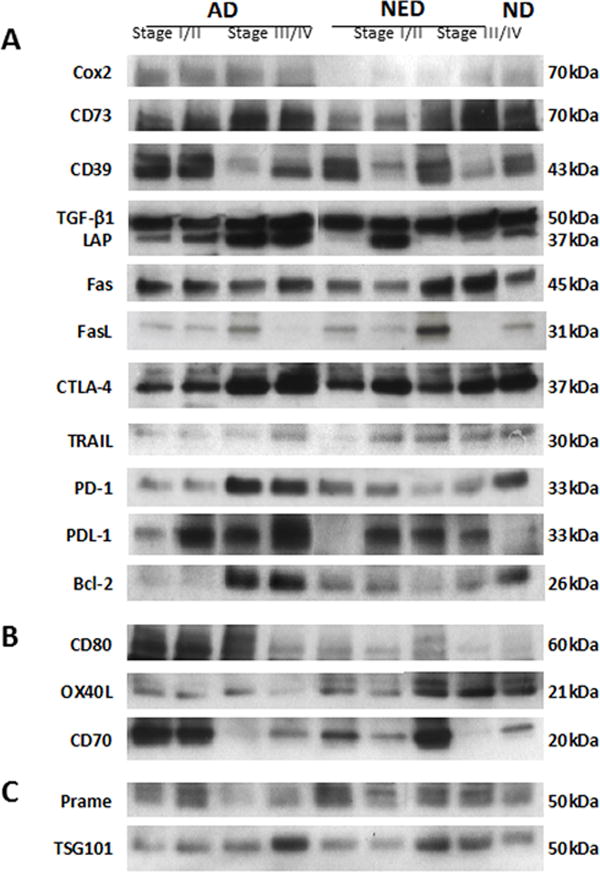
Western blots were performed after loading 10μg of exosomal protein/lane. Immunosuppressive in (A) and immunostimulatory in (B) protein profiles are shown for exosomes of 4 patients with AD, 4 patients with NED and of one ND. In (C) PRAME is used as a marker for HNC, and TSG101 serves as an exosome marker.
Table 1.
Mean densities of protein bands in Western blots for different immunomodulatory receptors/ligands in exosomes isolated from HNC patients with AD or NEDa
| Protein
|
AD
|
NED
|
|---|---|---|
| TRAIL | 2,614 | 521 |
| FASL | 2,279 | 2,278 |
| FAS | 2,150 | 1,130 |
| PD-L1 | 4,267 | 4,057 |
| PD-1 | 25,799 | 12,277 |
| CTLA-4 | 8,468 | 4,671 |
| COX2 | 3,092 | 2,145 |
| CD73 | 3,236 | 4,978 |
| TGF-β/LAP | 7,669 | 3,916 |
Semiquantitative densitometry of Western blot bands shown in Figure 4A was performed as described in Materials and Methods. The data are mean integrated pixel values (image intensity × band area). Exosomes were isolated from plasma of 4 patients with AD and 4 with NED.
FasL expression on exosomes and their apoptotic activity
Because Fas and FasL were often detected on Western blots of exosomes from HNC patients, biological activity of these molecules was tested by co-incubating exosomes with CD8+ Jurkat cells previously shown by us to carry CD95 (29). As shown in Figure 5A, upon co-incubation with exosomes from plasma of patients with HNC, CD8+Jurkat cells bind Annexin V and undergo apoptosis. Further, Figure 5B shows that levels of FasL expression on exosomes isolated from plasma of AD patients appears to be somewhat higher than those on exosomes of NED patients (NSD). Also, Annexin V binding is significantly greater (p<0.05) in CD8+ T cells co-incubated with exosomes of AD patients than that in CD8+ T cells co-incubated with exosomes of NED patients (Figure 5C). However, as illustrated in Supplemental Figure 2, there was no correlation between FasL expression on exosomes and Annexin V binding to CD8+ Jurkat cells. Thus, FasL+ exosomes from patients’ plasma induced apoptosis of CD8+ Jurkat cells and primary activated CD8+ T cells, as measured in assays based on Annexin V binding or caspase 3/7 activity (Figures 5C and 5D). Further, AD and REC exosomes induced significantly more apoptosis in CD8+ T cells than exosomes from plasma of NED patients or NDs (Figure 5C and 5D). Caspase 3/7 activity in CD8+ T cells was significantly elevated upon co-incubation with exosomes from AD patients compared to the control with no exosomes (p=0.04). Importantly, caspase 3/7 activity decreased upon incubation with exosomes from plasma of the different patient cohorts and NDs: AD &REC>NED>ND (Figure 5D), albeit given the small numbers of subjects in each group this trend was not statistically significant.
Figure 5. Exosomes-mediate apoptosis in CD8+ Jurkat cells or primary activated CD8+ T cells.
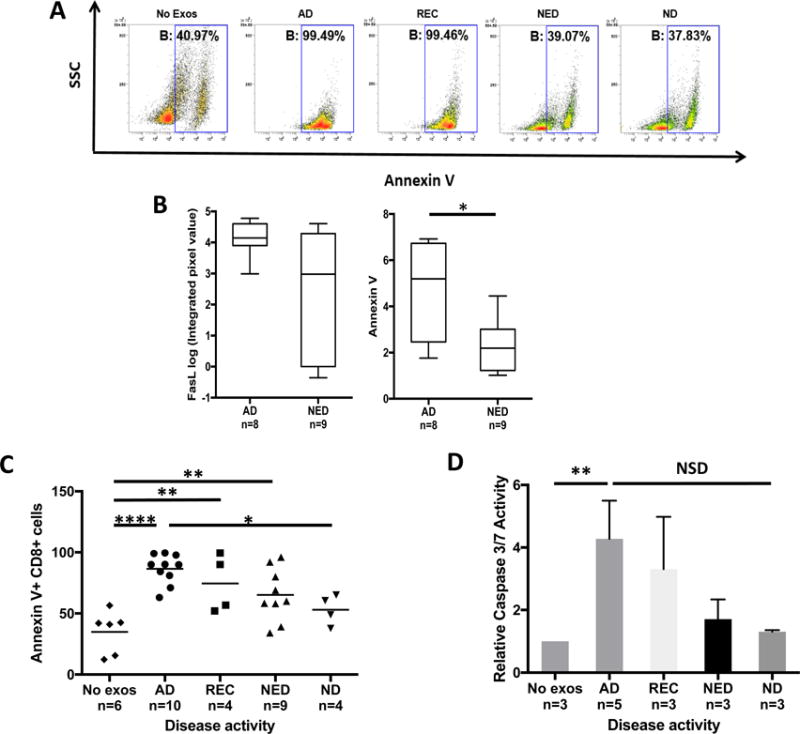
In (A), representative flow cytometry data for Annexin V binding in CD8+ Jurkat cells co-incubated with exosomes isolated from HNC patients or a ND. In (B), exosomes of AD patients carry higher FasL than exosomes of NED (NSD) and AD exosomes induce significantly more apoptosis than NED exosomes (p<0.05). In (C), flow cytometry data for apoptosis of primary activated CD8+ T cells co-incubated with plasma-derived exosomes for 24h. There was a significant correlation between T-cell apoptosis with the patients’ disease activity (*p<0.05, **p<0.01, ****p<0.0001). In (D), combined data (means ± SEM) for caspase 3/7 activation in primary CD8+ T cells co-incubated for 24h with exosomes as described above (*p<0.05).
Suppression of CD4+ T cell proliferation by patients’ exosomes vs disease activity
As previously shown by us, HNC plasma-derived exosomes suppress the proliferation of activated CD4+ T cells (20). We suspected that the ability of exosomes to mediate immune suppression was related to disease activity in plasma donors. Therefore, exosomes isolated from plasma of AD and NED patients or ND were co-incubated with normal pre-activated CD4+ T cells, and proliferation of T cells ± exosomes was measured in CFSE-based assays. Representative data shown in Figure 6A indicate that exosomes of AD patients induced the strongest suppression of proliferation (48%). Exosomes of NED patients induced less suppression (35%) and ND exosomes were the least inhibitory (26%). In Figure 6B, suppression levels of all experiments performed are shown, indicating that the suppression levels mediated by exosomes decrease in concert with reduced disease activity (AD vs. ND p<0.05, AD vs. NED p<0.05).
Figure 6. Exosome-mediated suppression of CD4+ T cell proliferation as measured in a CFSE-based assays.
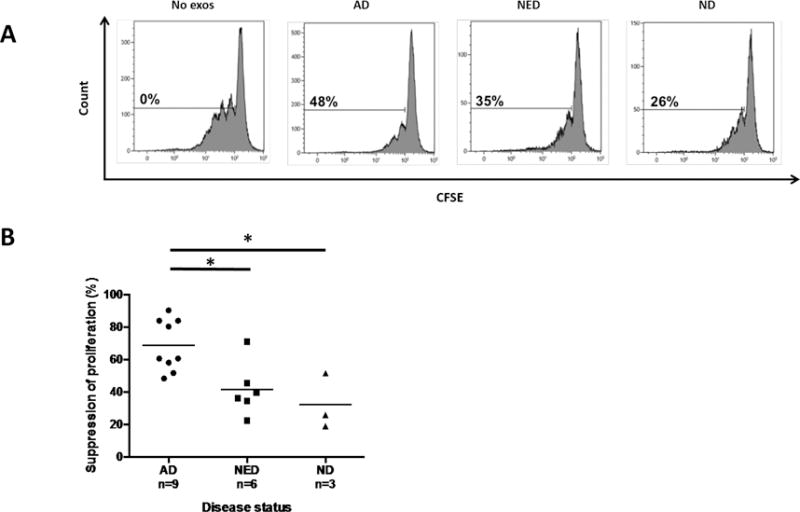
Activated CD4+ T cells were cultured alone or in the presence of plasma-derived exosomes. In (A), representative data of proliferating CFSE+ primary CD4+ T cells co-incubated with exosomes from plasma of HNC patients and a ND. Suppression of proliferation was calculated relative to proliferation without exosomes added. In (B), exosomes from plasma of AD patients suppress proliferation of CD4+ T cells significantly better than exosomes of NED patients or exosomes of ND (*p<0.05). Suppression mediated by NED exosomes was comparable to that seen with ND exosomes.
Induction by patients’ exosomes of CD39 expression and adenosine production in CD4+CD39+ regulatory T cells
Previous evidence showed that exosomes derived from HNC cell line supernatants up-regulated expression of CD39 ectonucleotidase on the surface of CD4+CD39+ Treg (30) and increased adenosine production by these Treg (25). We co-incubated exosomes derived from HNC patients’ plasma with isolated resting CD4+ T cells and found that only exosomes from plasma of AD patients significantly up-regulated CD39 expression levels on T cells, while exosomes isolated from plasma of NED patients or NDs did not (Figure 7A, B). As exosomes derived from plasma of HNC patients invariably carry CD39 and CD73 (Figure 4 and (25)), we wished to determine whether the ectonucleotidases tethered to these exosomes retained enzymatic activity. CD4+CD39+ Treg co-incubated with exosomes derived from plasma of AD and NED patients significantly up-regulated conversion of exogenous ATP to adenosine (Figure 7C). Exosomes of AD patients had higher CD73 activity and induced significantly more adenosine production than did exosomes from NED patients. Exosomes from plasma of NDs induced significantly less adenosine production than exosomes from HNC patients’ plasma. These data are consistent with previously observed higher levels of CD39 and CD73 carried by patients’ exosomes relative to ND’s exosomes (25, 30). No ATP conversion to adenosine occurred in the absence of exosomes. Interestingly, levels of 5’AMP production by CD4+CD39+ Treg alone were high and did not change upon co-incubation with exosomes, suggesting that the rate of exosome-mediated conversion of ATP to 5’AMP exceeded that of 5’AMP conversion to adenosine. High levels of adenosine produced by CD4+ T cells in the presence of patients’ exosomes could be responsible for inhibition of CD4 T cell proliferation as reported above.
Figure 7. Exosomes from plasma of HNC patients up-regulate CD39 expression levels and adenosine production by Treg.
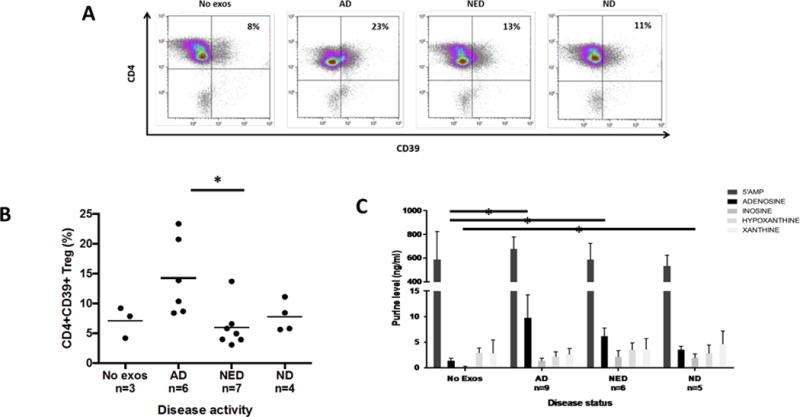
In (A), representative flow cytometry data showing up-regulation of CD39 expression levels in resting CD4+ T cells isolated from PBMC of NDs. In (B), data for up-regulation of CD39 by exosomes obtained from plasma of AD, NED or ND after 24h co-incubation. Only exosomes of AD patients significantly augmented CD39 expression levels (*p<0.05). In (C), increased adenosine production by resting CD4+CD39+ Treg following co-incubation with exosomes from plasma of AD and NED patients or ND in the presence of 20μM exogenous ATP for 1h. Extracellular adenosine levels are the highest in Treg co-incubated with exosomes of AD patients (*p<0.05), intermediate in Treg co-incubated with exosomes of NED patients (*p<0.05) and lowest in Treg co-incubated with exosomes of NDs. The data are from 3 independent experiments of which 2 were performed with duplicate co-cultures.
Exosomes of HNC patients suppress cytotoxic activity of NK cells
Exosomes from HNC patients’ plasma were previously observed to induce suppression of cytotoxicity in normal human NK cells (20). To show that this exosome-mediated suppression was also related to disease activity in HNC patients, we monitored down-regulation of NKG2D expression levels on the surface of normal NK cells co-incubated with AD or NED exosomes. The data shown in Figures 8A and B show the strongest and significant NKG2D down-regulation in NK cells co-incubated with exosomes of AD patients and no down-regulation in NK cells co-incubated with exosomes of NED patients or NDs. Also, cytotoxicity of CD3−CD56+ NK cells against K562 targets measured by flow cytometry was significantly inhibited by AD exosomes relative to no suppression seen with NED or ND exosomes (Figure 8C).
Figure 8. Exosome-induced down-regulation of NKG2D and suppression of NK cell-mediated cytotoxicity.
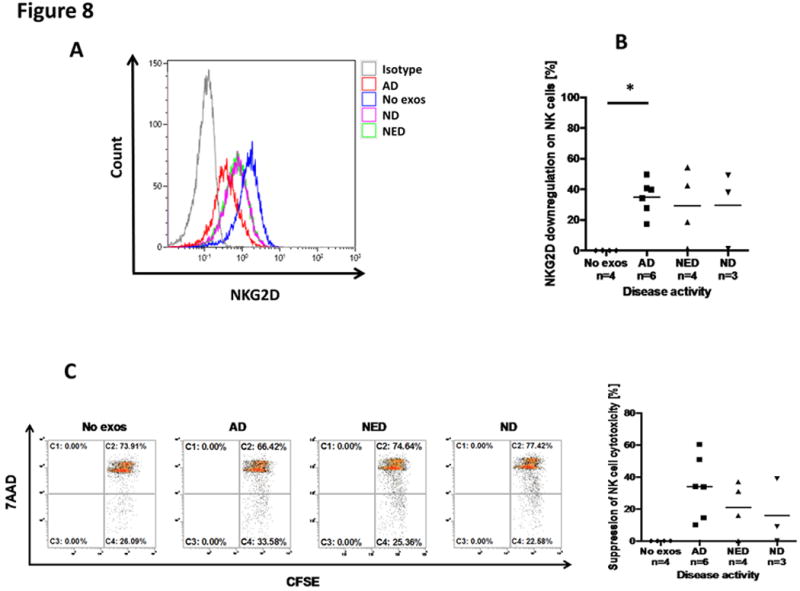
In (A), representative flow cytometry data for down-regulation of NKG2D expression levels in normal human NK cells by HNC patients’ exosomes. Exosomes were co-incubated with resting PBMCs and gates were set on CD3−CD56+ NK cells. Exosomes of the AD patient induced the most prominent loss of NKG2D expression levels relative to NED or ND exosomes. In (B) combined MFI data for NKG2D down-regulation by exosomes of HNC patients and NDs are shown. In (C), cytotoxicity of NK cells against K562 targets was measured using CFSE-labeled K562 target cells by flow cytometry. Only exosomes from AD patients suppressed NK cell-mediated cytotoxicity (*p<0.05).
Discussion
Suppression of anti-tumor immune responses by tumor-derived soluble factors, including inhibitory cytokines, has long been recognized as a mechanism contributing to tumor progression (31). While the existence of cross-talk between tumor and recipient immune cells is widely accepted, the mechanisms responsible for sustaining this communication network have remained obscure. With the recent emergence of exosomes as vehicles engaged in conveying information between tissue and hematopoietic cells (32), attention has focused on the role exosomes present in plasma of all cancer patients might play in promoting tumor progression or modulating response to therapy. Accumulating evidence suggests that exosome fractions in plasma of patients with cancer are enlarged relative to those in plasma of healthy donors (33) and that the protein content, numbers of exosomes present as well as the molecular cargo of exosomes could serve as potential biomarkers of disease progression and even disease outcome following therapy (34). Indeed, our study of exosomes isolated from plasma of patients with HNC shows that plasma levels of exosomal proteins, exosome numbers, their molecular cargo and their ability to alter functions of normal immune cells reflect the presence and activity of the disease as well as response to oncologic therapies. It is important to note that our studies reported over a decade ago showed that CD8+ T cells freshly isolated from the circulation of patients with HNC with AD were highly sensitive to spontaneous apoptosis and that the fraction of apoptosis-prone CD8+ effector T cells was highest in patients with AD (35–37). At the time, we interpreted these results as evidence that immune effector cells in the circulation of HNC patients with AD were induced in vivo into early apoptosis by tumor-derived “factors.” A decade later, plasma exosomes recapitulate the effects we have described (35–37) and emerge as a distinct mechanism of disease-related immune suppression.
The presence, quantity as well as molecular and functional characteristics of plasma-derived exosomes appear to correctly differentiate HNC patients with active disease (AD) from those with no evident disease (NED) after oncologic therapy. Further, among AD patients studied prior to any therapy measurements of the protein levels in isolated exosome fractions were sufficient to discriminate between patients with stage I/II vs III/IV disease. Patients with recurrent disease tended to have exosome protein levels similar to those with AD. We expected that the molecular content of plasma-derived exosomes would be a better discriminator between AD vs NED patients than exosome protein levels. To this end, we began our studies using mass spectrometry analysis of plasma-derived exosomes. Unfortunately, none of the inhibitory proteins responsible for suppression of immune cells by these exosomes were detected among hundreds of the identified proteins (data not shown). These proteins, present on exosomes at femtomolar levels, require antibody amplification for signal detection, and they are readily identifiable in Western blots. This, of course, limits the number of exosome components that can be examined and can only provide a semiquantitative analysis by densitometry measurements of individual protein bands. Nevertheless, even with these limitations, Western blot analyses showed enrichment of several immunoregulatory proteins in exosomes from plasma of AD patients that discriminated them from patients with NED.
By far the most consistent and convincing results were obtained when we measured effects of the plasma-derived exosomes on various functions of human immune cells. In these assays, patients’ exosomes were titrated into fully functional immune cells isolated from the blood of normal donors. Invariably, exosomes in patients with AD induced significantly stronger apoptosis of CD8+ T cells, greater inhibition of T-cell proliferation or of NKG2D expression on NK cells and better up-regulation of suppressor functions in CD4+CD39+ Treg than exosomes of patients with NED. In aggregate, these data provide evidence that exosomes in plasma of patients with cancer could serve as reliable indicators of exosome-mediated immune dysfunction in cancer that correlates with disease activity (38). We expected that exosome-induced apoptosis, as measured by Annexin V binding in Jurkat cells, would correlate with FasL expression levels in exosomes (39). However, no correlation was observed, perhaps because FasL expression in exosomes was measured by Western blots which detect membrane-bound and intra-vesicular proteins. In our previously reported experiments, suppressive effects of exosome-associated FasL or TGF-β1 or CD73 on immune cells were partially but never completely blocked by anti-FasL Ab, anti-TGFβ1 Ab or pharmacologic inhibitors of CD73, respectively (25, 29). These results suggested that not one but several different inhibitory pathways are activated in immune cells interacting with exosomes that carry multiple inhibitory ligands. Indeed, the Western blot profiles of exosomes of exosomes from HNC plasma indicate these vesicles carry at least 9 different immunosuppressive molecules and deliver them to immune recipient cells as ”bundles” capable of inducing apoptosis or inhibiting other functions. For example, the presence of FasL and TRAIL in exosome cargo, as shown in Figure 4A, suggests that efficient exosome-mediated apoptosis of T cells we measured ex vivo was likely induced by simultaneous ligation of both of these death ligands to receptors expressed on T cells. In aggregate, our data emphasize the potential of plasma-derived exosomes to serve as non-invasive indicators of disease activity before or after oncological therapies as well as indicators of immune dysfunction that these exosomes are capable of inducing in patients with cancer.
The potential of exosomes to serve as non-invasive biomarkers of cancer progression on the one hand, and as metrics of immune dysfunction in cancer on the other, is of great current interest. This study provides preliminary evidence supporting the further development of methodologies and assays for the exploration of plasma exosomes as future cancer biomarkers. This development is only slowly being realized because of limited understanding of the exosome biology and by the presence in cancer patients’ plasma of numerous exosome subsets derived from various tissue cells, including tumor cells and immune cells (10, 11). While total exosome fractions, such as those used in our experiments and those reported by others (40), may provide clinically valuable information, the future use of exosomes as a “liquid biopsy” is likely to depend on isolation from body fluids of tumor-derived exosomes as suggested by Melo et al. (41). Studies of supernatants of cultured human tumor cells, which contain only tumor-derived exosomes that we dubbed as TEX and no other exosomes, have clearly shown that TEX carry immunosuppressive loads and suppress functions of immune cells (16, 17, 42). However, it is possible that non-TEX could also mediate immune suppression.
The optimal use of exosomes as biomarkers of tumor progression and/or immune suppression in cancer depends on the ability to isolate exosomes from patients’ plasma and to then separate TEX from non-TEX in order to obtain a tumor-specific exosome signature. This strategy presents a considerable technical barrier requiring reagents specific for tumor antigens such as glypican-1 in the Melo et al. report (41). Our study indicates that an alternative strategy to developing plasma exosomes as future cancer biomarkers could be based on functional evaluations of total exosome fractions ex vivo, using assays with normal immune cell subsets to discern and measure immunological abnormalities induced by exosomes. Immune competence of a patient whose tumor produces highly immunosuppressive exosomes is likely to be compromised. One such assay that could be readily standardized for potential clinical development is the flow-based apoptosis assay, where CD8+ Jurkat cells are co-incubated with plasma-derived exosomes, providing a relative measure of Fas/FasL-mediated activity these exosomes can deliver. Exosome isolation from plasma using miniSEC is a high throughput procedure (20). The development and subsequent validation of this platform for linking exosome-induced immune suppression with clinical endpoints is likely to provide useful prognostic information. The results we have presented are a “proof of principle” that could be extended, quantitated and validated in the future to harness plasma exosomes as biomarkers of cancer-related immune deficiencies during the cancer progression or as biomarkers of therapy-related immune recovery after immune therapies.
Supplementary Material
Statement of Translational Significance.
Plasma-derived exosomes are emerging as promising non-invasive correlates of cancer progression. In patients with head and neck cancer (HNC), plasma exosomes carry a cargo enriched in immunosuppressive proteins. As immune suppression is one of the hallmarks of HNC progression, circulating exosomes rich in inhibitory molecules are implicated in mediating systemic immune suppression. In this study, we show that the molecular cargo of HNC plasma-derived exosomes and their effects on immune cell subsets correlate with the disease activity in patients with HNC. The data suggest that plasma-derived exosomes could be useful in the future as non-invasive biomarkers of immune dysfunction in HNC and thus of disease progression.
Acknowledgments
Financial Support
This work was supported in part by NIH grants R01 CA168628 and R21 CA205644 to TLW and also used UPCI shared resources that are supported in part by NIH award P30CA047904.
Footnotes
Author Contributions
Sonja Funk performed experiments and wrote the manuscript. Theofanis Floros isolated cell subsets and contributed cytotoxicity experiments; Marie-Nicole Theodoraki performed densitometry of Western blots and helped in data interpretation; Chang-Sook Hong performed NK-cell experiments; Edwin K. Jackson performed mass spectrometry for adenosine and derivatives and interpreted data; Stephan Lang provided financial support for Sonja Funk; and Theresa Whiteside designed the study, interpreted results and edited the manuscript.
Conflict of Interest: The authors declare no potential conflicts of interests.
References
- 1.Ferris RL, Whiteside TL, Ferrone S. Immune escape associated with functional defects in antigen-processing machinery in head and neck cancer. Clin Cancer Res. 2006;12:3890–5. doi: 10.1158/1078-0432.CCR-05-2750. [DOI] [PubMed] [Google Scholar]
- 2.Bergmann C, Strauss L, Zeidler R, Lang S, Whiteside TL. Expansion of human T regulatory type 1 cells in the microenvironment of cyclooxygenase 2 overexpressing head and neck squamous cell carcinoma. Cancer Res. 2007;67:8865–73. doi: 10.1158/0008-5472.CAN-07-0767. [DOI] [PubMed] [Google Scholar]
- 3.Jie HB, Gildener-Leapman N, Li J, Srivastava RM, Gibson SP, Whiteside TL, et al. Intratumoral regulatory T cells upregulate immunosuppressive molecules in head and neck cancer patients. Br J Cancer. 2013;109:2629–35. doi: 10.1038/bjc.2013.645. [DOI] [PMC free article] [PubMed] [Google Scholar]
- 4.Ferris RL. Immunology and Immunotherapy of Head and Neck Cancer. J Clin Oncol. 2015;33:3293–304. doi: 10.1200/JCO.2015.61.1509. [DOI] [PMC free article] [PubMed] [Google Scholar]
- 5.Gildener-Leapman N, Ferris RL, Bauman JE. Promising systemic immunotherapies in head and neck squamous cell carcinoma. Oral Oncol. 2013;49:1089–96. doi: 10.1016/j.oraloncology.2013.09.009. [DOI] [PMC free article] [PubMed] [Google Scholar]
- 6.Czystowska M, Gooding W, Szczepanski MJ, Lopez-Abaitero A, Ferris RL, Johnson JT, et al. The immune signature of CD8(+)CCR7(+) T cells in the peripheral circulation associates with disease recurrence in patients with HNSCC. Clin Cancer Res. 2013;19:889–99. doi: 10.1158/1078-0432.CCR-12-2191. [DOI] [PMC free article] [PubMed] [Google Scholar]
- 7.Ferris RL, Hunt JL, Ferrone S. Human leukocyte antigen (HLA) class I defects in head and neck cancer: molecular mechanisms and clinical significance. Immunol Res. 2005;33:113–33. doi: 10.1385/IR:33:2:113. [DOI] [PubMed] [Google Scholar]
- 8.Baskic D, Vujanovic L, Arsenijevic N, Whiteside TL, Myers EN, Vujanovic NL. Suppression of natural killer-cell and dendritic-cell apoptotic tumoricidal activity in patients with head and neck cancer. Head Neck. 2013;35:388–98. doi: 10.1002/hed.22968. [DOI] [PMC free article] [PubMed] [Google Scholar]
- 9.Whiteside TL. Immunobiology of head and neck cancer. Cancer Metastasis Rev. 2005;24:95–105. doi: 10.1007/s10555-005-5050-6. [DOI] [PubMed] [Google Scholar]
- 10.Whiteside TL. Exosomes and tumor-mediated immune suppression. J Clin Invest. 2016;126:1216–23. doi: 10.1172/JCI81136. [DOI] [PMC free article] [PubMed] [Google Scholar]
- 11.Whiteside TL. Tumor-Derived Exosomes and Their Role in Cancer Progression. Adv Clin Chem. 2016;74:103–41. doi: 10.1016/bs.acc.2015.12.005. [DOI] [PMC free article] [PubMed] [Google Scholar]
- 12.Schilling B, Harasymczuk M, Schuler P, Egan JE, Whiteside TL. IRX-2, a novel biologic, favors the expansion of T effector over T regulatory cells in a human tumor microenvironment model. J Mol Med (Berl) 2012;90:139–47. doi: 10.1007/s00109-011-0813-8. [DOI] [PMC free article] [PubMed] [Google Scholar]
- 13.Schilling B, Halstead ES, Schuler P, Harasymczuk M, Egan JE, Whiteside TL. IRX-2, a novel immunotherapeutic, enhances and protects NK-cell functions in cancer patients. Cancer Immunol Immunother. 2012;61:1395–405. doi: 10.1007/s00262-011-1197-x. [DOI] [PMC free article] [PubMed] [Google Scholar]
- 14.Schilling B, Harasymczuk M, Schuler P, Egan J, Ferrone S, Whiteside TL. IRX-2, a novel immunotherapeutic, enhances functions of human dendritic cells. PLoS One. 2013;8:e47234. doi: 10.1371/journal.pone.0047234. [DOI] [PMC free article] [PubMed] [Google Scholar]
- 15.Czystowska M, Szczepanski MJ, Szajnik M, Quadrini K, Brandwein H, Hadden JW, et al. Mechanisms of T-cell protection from death by IRX-2: a new immunotherapeutic. Cancer Immunol Immunother. 2011;60:495–506. doi: 10.1007/s00262-010-0951-9. [DOI] [PMC free article] [PubMed] [Google Scholar]
- 16.Huber V, Fais S, Iero M, Lugini L, Canese P, Squarcina P, et al. Human colorectal cancer cells induce T-cell death through release of proapoptotic microvesicles: role in immune escape. Gastroenterology. 2005;128:1796–804. doi: 10.1053/j.gastro.2005.03.045. [DOI] [PubMed] [Google Scholar]
- 17.Iero M, Valenti R, Huber V, Filipazzi P, Parmiani G, Fais S, et al. Tumour-released exosomes and their implications in cancer immunity. Cell Death Differ. 2008;15:80–8. doi: 10.1038/sj.cdd.4402237. [DOI] [PubMed] [Google Scholar]
- 18.Cocucci E, Meldolesi J. Ectosomes and exosomes: shedding the confusion between extracellular vesicles. Trends Cell Biol. 2015;25:364–72. doi: 10.1016/j.tcb.2015.01.004. [DOI] [PubMed] [Google Scholar]
- 19.van der Pol E, Boing AN, Harrison P, Sturk A, Nieuwland R. Classification, functions, and clinical relevance of extracellular vesicles. Pharmacol Rev. 2012;64:676–705. doi: 10.1124/pr.112.005983. [DOI] [PubMed] [Google Scholar]
- 20.Hong CS, Funk S, Muller L, Boyiadzis M, Whiteside TL. Isolation of biologically active and morphologically intact exosomes from plasma of patients with cancer. J Extracell Vesicles. 2016;5:29289. doi: 10.3402/jev.v5.29289. [DOI] [PMC free article] [PubMed] [Google Scholar]
- 21.Saze Z, Schuler PJ, Hong CS, Cheng D, Jackson EK, Whiteside TL. Adenosine production by human B cells and B cell-mediated suppression of activated T cells. Blood. 2013;122:9–18. doi: 10.1182/blood-2013-02-482406. [DOI] [PMC free article] [PubMed] [Google Scholar]
- 22.Schuler PJ, Schilling B, Harasymczuk M, Hoffmann TK, Johnson J, Lang S, et al. Phenotypic and functional characteristics of CD4+ CD39+ FOXP3+ and CD4+ CD39+ FOXP3neg T-cell subsets in cancer patients. Eur J Immunol. 2012;42:1876–85. doi: 10.1002/eji.201142347. [DOI] [PMC free article] [PubMed] [Google Scholar]
- 23.Muller L, Hong CS, Stolz DB, Watkins SC, Whiteside TL. Isolation of biologically-active exosomes from human plasma. J Immunol Methods. 2014;411:55–65. doi: 10.1016/j.jim.2014.06.007. [DOI] [PMC free article] [PubMed] [Google Scholar]
- 24.Strauss L, Bergmann C, Gooding W, Johnson JT, Whiteside TL. The frequency and suppressor function of CD4+CD25highFoxp3+ T cells in the circulation of patients with squamous cell carcinoma of the head and neck. Clin Cancer Res. 2007;13:6301–11. doi: 10.1158/1078-0432.CCR-07-1403. [DOI] [PubMed] [Google Scholar]
- 25.Schuler PJ, Saze Z, Hong CS, Muller L, Gillespie DG, Cheng D, et al. Human CD4(+) CD39(+) regulatory T cells produce adenosine upon co-expression of surface CD73 or contact with CD73(+) exosomes or CD73(+) cells. Clin Exp Immunol. 2014;177:531–43. doi: 10.1111/cei.12354. [DOI] [PMC free article] [PubMed] [Google Scholar]
- 26.Kim GG, Donnenberg VS, Donnenberg AD, Gooding W, Whiteside TL. A novel multiparametric flow cytometry-based cytotoxicity assay simultaneously immunophenotypes effector cells: comparisons to a 4 h 51Cr-release assay. J Immunol Methods. 2007;325:51–66. doi: 10.1016/j.jim.2007.05.013. [DOI] [PMC free article] [PubMed] [Google Scholar]
- 27.Wieckowski EU, Visus C, Szajnik M, Szczepanski MJ, Storkus WJ, Whiteside TL. Tumor-derived microvesicles promote regulatory T cell expansion and induce apoptosis in tumor-reactive activated CD8+ T lymphocytes. J Immunol. 2009;183:3720–30. doi: 10.4049/jimmunol.0900970. [DOI] [PMC free article] [PubMed] [Google Scholar]
- 28.Szczepanski MJ, DeLeo AB, Luczak M, Molinska-Glura M, Misiak J, Szarzynska B, et al. PRAME expression in head and neck cancer correlates with markers of poor prognosis and might help in selecting candidates for retinoid chemoprevention in pre-malignant lesions. Oral Oncol. 2013;49:144–51. doi: 10.1016/j.oraloncology.2012.08.005. [DOI] [PMC free article] [PubMed] [Google Scholar]
- 29.Kim JW, Wieckowski E, Taylor DD, Reichert TE, Watkins S, Whiteside TL. Fas ligand-positive membranous vesicles isolated from sera of patients with oral cancer induce apoptosis of activated T lymphocytes. Clin Cancer Res. 2005;11:1010–20. [PubMed] [Google Scholar]
- 30.Muller L, Mitsuhashi M, Simms P, Gooding WE, Whiteside TL. Tumor-derived exosomes regulate expression of immune function-related genes in human T cell subsets. Sci Rep. 2016;6:20254. doi: 10.1038/srep20254. [DOI] [PMC free article] [PubMed] [Google Scholar]
- 31.Whiteside TL. Immune responses to malignancies. J Allergy Clin Immunol. 2010;125:S272–83. doi: 10.1016/j.jaci.2009.09.045. [DOI] [PMC free article] [PubMed] [Google Scholar]
- 32.Boyiadzis M, Whiteside TL. Information transfer by exosomes: A new frontier in hematologic malignancies. Blood Rev. 2015;29:281–90. doi: 10.1016/j.blre.2015.01.004. [DOI] [PubMed] [Google Scholar]
- 33.Cappello F, Logozzi M, Campanella C, Bavisotto CC, Marcilla A, Properzi F, et al. Exosome levels in human body fluids: A tumor marker by themselves? Eur J Pharm Sci. 2016;96:93–8. doi: 10.1016/j.ejps.2016.09.010. [DOI] [PubMed] [Google Scholar]
- 34.Whiteside TL. The potential of tumor-derived exosomes for noninvasive cancer monitoring. Expert Rev Mol Diagn. 2015:1–18. doi: 10.1586/14737159.2015.1071666. [DOI] [PMC free article] [PubMed] [Google Scholar]
- 35.Hoffmann TK, Dworacki G, Tsukihiro T, Meidenbauer N, Gooding W, Johnson JT, et al. Spontaneous apoptosis of circulating T lymphocytes in patients with head and neck cancer and its clinical importance. Clin Cancer Res. 2002;8:2553–62. [PubMed] [Google Scholar]
- 36.Saito T, Kuss I, Dworacki G, Gooding W, Johnson JT, Whiteside TL. Spontaneous ex vivo apoptosis of peripheral blood mononuclear cells in patients with head and neck cancer. Clin Cancer Res. 1999;5:1263–73. [PubMed] [Google Scholar]
- 37.Gastman BR, Atarshi Y, Reichert TE, Saito T, Balkir L, Rabinowich H, et al. Fas ligand is expressed on human squamous cell carcinomas of the head and neck, and it promotes apoptosis of T lymphocytes. Cancer Res. 1999;59:5356–64. [PubMed] [Google Scholar]
- 38.Whiteside TL. Immune responses to cancer: are they potential biomarkers of prognosis? Front Oncol. 2013;3:107. doi: 10.3389/fonc.2013.00107. [DOI] [PMC free article] [PubMed] [Google Scholar]
- 39.Bergmann C, Strauss L, Wieckowski E, Czystowska M, Albers A, Wang Y, et al. Tumor-derived microvesicles in sera of patients with head and neck cancer and their role in tumor progression. Head Neck. 2009;31:371–80. doi: 10.1002/hed.20968. [DOI] [PMC free article] [PubMed] [Google Scholar]
- 40.Peinado H, Aleckovic M, Lavotshkin S, Matei I, Costa-Silva B, Moreno-Bueno G, et al. Melanoma exosomes educate bone marrow progenitor cells toward a pro-metastatic phenotype through MET. Nat Med. 2012;18:883–91. doi: 10.1038/nm.2753. [DOI] [PMC free article] [PubMed] [Google Scholar]
- 41.Melo SA, Luecke LB, Kahlert C, Fernandez AF, Gammon ST, Kaye J, et al. Glypican-1 identifies cancer exosomes and detects early pancreatic cancer. Nature. 2015;523:177–82. doi: 10.1038/nature14581. [DOI] [PMC free article] [PubMed] [Google Scholar]
- 42.Whiteside TL. Immune modulation of T-cell and NK (natural killer) cell activities by TEXs (tumour-derived exosomes) Biochem Soc Trans. 2013;41:245–51. doi: 10.1042/BST20120265. [DOI] [PMC free article] [PubMed] [Google Scholar]
Associated Data
This section collects any data citations, data availability statements, or supplementary materials included in this article.