

Abstract
Purpose
Mutations in KRAS are considered to be the main drivers of acquired resistance to epidermal growth factor receptor (EGFR) blockade in patients with metastatic colorectal cancer (mCRC). However, the potential roles of other genes downstream of the EGFR signaling pathway in conferring acquired resistance has not been extensively investigated.
Experimental Design
Using circulating tumor DNA (ctDNA) from patients with mCRC and with acquired cetuximab resistance, we developed a targeted amplicon ultra-deep sequencing method to screen for low-abundance somatic mutations in a panel of genes that encode components of the EGFR signaling pathway. Mutations with significantly increased variant frequencies upon disease progression were selected by using quartile analysis. The functional consequences of the identified mutations were validated in cultured cells.
Results
We analyzed 32 patients with acquired cetuximab resistance in a development cohort. Of them, 7 (22%) carried five novel PIK3CA mutations, whereas 8 (25%) carried previously reported KRAS mutations. Functional studies showed that novel PIK3CA mutations (all in exon 19; p.K944N, p.F930S, p.V955G, p.V955I, and p.K966E) promote cell viability in the presence of cetuximab. Only one novel PIK3CA mutation (p.K944N) was verified in one of the 27 patients with acquired resistance in a validation cohort, simultaneous KRAS and PIK3CA hotspot mutations were detected in 2 patients. Among the above 59 acquired resistance patients, those with PIK3CA or RAS mutations detected in ctDNA showed a pronounced decrease in progression-free survival than patients with no mutation.
Conclusions
The PIK3CA mutations may potentially contribute to acquired cetuximab resistance in patients with mCRC.
Keywords: PIK3CA, Mutation, Acquired Resistance, Colorectal Cancer, Circulating tumor DNA
INTRODUCTION
Epidermal growth factor receptor (EGFR) signaling promotes cell proliferation and migration, and the constitutive activation of this pathway is associated with tumor progression and metastasis in colorectal cancer. Anti-EGFR antibodies, such as cetuximab, improve the survival of metastatic colorectal cancer (mCRC) patients. Cetuximab is currently recommended for mCRC patients expressing wild-type RAS(1). However, in a large proportion of patients who respond, acquired resistance to cetuximab emerges despite the absence of detectable mutations in RAS.
It is now clear that embryologic origin of the colon contributes to the genomic profile of a colorectal cancer and has implications on prognosis and response to specific therapeutics. Right-sided colon cancers have embryologic origin in the midgut and have higher rates of microsatellite instability, gene promoter hypermethylation leading to gene silencing, and BRAF mutation, whereas left-sided tumors originate from the hindgut and have a genomic profile distinct from right-sided tumors. Recently, many studies(2–4) demonstrated that the predictive value of the location was mainly related to the response to biologic agents, cetuximab and bevacizumab, of which, cell proliferation and developmental pathways such as RAF/RAS/ERK/MEK and mTOR/PI3K/AKT pathways could play vital roles in response to anti-EGFR antibody, cetuximab.
Recent studies have implicated mutations in several other genes in the EGFR signaling pathway, such as BRAF, PIK3CA and PTEN, in the acquisition of resistance to cetuximab(5–7). However, it remains to be determined whether such resistance-causing mutations were present in the primary tumor or occurred during treatment. Diaz et al. have previously reported that KRAS mutations were responsible for acquired resistance to EGFR blockade in 9 of 24 mCRC patients(8). We hypothesized that in addition to KRAS, mutations in genes downstream of EGFR may also confer acquired resistance to cetuximab-based therapy.
Recent studies have used next generation sequencing (NGS) to test for specific mutations in circulating tumor DNA (ctDNA) obtained from patient plasma. However, these studies monitored mutations identified in tumor tissue from the same patient or known “hot-spot” mutations(9–14); hence, any other mutations emerging during treatment that result in acquired resistance are likely to have been missed.
Here, we have evaluated a panel of genes that are thought to play pivotal roles in the activation of the EGFR signaling pathway or frequently mutated in colorectal cancer. We overcome these previous limitations by employing ultra-deep amplicon sequencing technology and a newly developed data analysis approach, and we describe the identification of emergent resistant mutations in ctDNA from longitudinal plasma samples obtained from mCRC patients based on dynamic changes in allelic fractions. By analyzing structural and functional changes, as well as the clinical influence of these mutations, we extend our existing knowledge of mutations that contribute to acquired cetuximab resistance.
METHODS
Patients and Sample Collection for the Development Cohort
We performed a retrospective single-center study at the Affiliated Hospital, Academy of Military Medical Sciences, Beijing, China. Eligible patients (see Supplementary Materials and Methods) had pathologically confirmed mCRC harboring wild-type KRAS codons 12 and 13 and wild-type BRAF codon 600, as determined via Sanger sequencing of the tumor tissue DNA. NRAS was not recommended for routine testing at the onset of the study in 2011(15). Patients received cetuximab treatment with or without chemotherapy. Prior treatments were permitted except for cetuximab. Serum carcinoembryonic antigen (CEA) and cancer antigen 19-9 (CA 19-9) levels were measured during each therapeutic cycle. Computed tomography (CT) scans were performed and reviewed every 6–8 weeks to evaluate clinical response using the Response Evaluation Criteria in Solid Tumors (RECIST), version 1.1(16). Clinical data including response evaluation during the study were collected. Longitudinal blood samples (4 mL) from each patient were obtained at baseline and every 4 weeks until disease progression or until the last plasma sample was collected. Formalin-fixed paraffin-embedded (FFPE) tumor tissues and peripheral blood mononuclear cells were also collected before treatment. Blood specimens were frozen at -80°C and were linked to demographic, clinical, and genetic data stored in a secure research database. This study protocol was approved by the local ethics committee (KY-2011-8-3), and was conducted in accordance with International Ethical Guidelines for Biomedical Research Involving Human Subjects (CIOMS). Written informed consent was obtained from each patient.
Sample Processing and Amplicon Sequencing
Following DNA extraction and quantification, samples from plasma and tumor tissues were both subjected to amplicon deep sequencing (see Supplementary Materials and Methods) for the following target regions which are thought to play pivotal roles in the activation of the EGFR signaling pathway or frequently mutated in colorectal cancer: AKT1 (exon 3), BRAF (exon 15), EGFR (exons 10 and 12), KRAS (exons 2, 3 and 4), NRAS (exons 2, 3 and 4), PIK3CA (exons 8 and 19), PTEN (exons 5, 7 and 8), and TP53 (exons 5, 6 and 7) (6,17,18), as well as the splice site regions of these exons (i.e., intronic regions within 4 bp of an exon/intron boundary).
The amplicon libraries were subjected to deep sequencing using a Proton System (Life Technologies, Carlsbad, CA, US). The primer sequences are provided in Supplementary Materials and Methods. Targeted average sequencing depths were 1000× for FFPE tumor tissue or blood cell DNA samples and 10000× for cfDNA samples. All testing was conducted by an independent laboratory supplied with blinded samples. (QuestGenomics Biotechnology Co, Ltd. Nanjing, Jiangsu, China)
Identification of Mutations Associated with Acquired Resistance
After routine quality control and data processing steps, we called single nucleotide variants (SNVs) without filtering for any variant frequencies. Somatic mutations were identified by comparing SNVs from the genomic DNA extracted from peripheral blood mononuclear cells and FFPE samples. Using quartile analysis, mutations with significantly increased variant frequencies upon disease progression, or those that were present only during disease progression, were identified as candidate mutations associated with acquired resistance, Deep sequencing data processing, SNV calling, and quartile analysis are described in the Supplementary Materials and Methods. Mutations were annotated using SNPnexus(19). All non-synonymous mutations were further analyzed using PolyPhen-2 and SIFT to determine their potential effects on protein function(20,21). Variants predicted to be ‘damaging’ by both PolyPhen-2 and SIFT were selected for further analysis. The workflow was shown in Fig S1.
Functional Analysis of PIK3CA Mutations
Structure Modeling and functional Analysis
MODELLER (version 9v6)(22) was used for homology modeling. Three-dimensional (3D) structures of wild-type and mutant PIK3CA binding to PIK3R1 were modeled using the 3D structure of 4JPS in the PDB (Protein Data Bank) database as a template(23). Hydrogen atoms were added using CHARMM (version c32b2)(24). The protonation states of titratable residues were determined using an in-house CHARMM script(25). VMD (version 1.9.1)(26) was used to view and analyze the modeled structures.
In Vitro Functional Assays
The PIK3CA point mutations identified in ctDNA and FFPE tumor tissue were introduced into the full-length PIK3CA coding sequence using site-directed mutagenesis and were inserted into an expression vector (RC213112, Origene). Sequences of the primers used to construct PIK3CA mutation expression vectors are provided in Supplementary Materials and Methods. A human colorectal cancer cell line (DiFi) was transfected with the PIK3CA mutation expression vectors and assessed by Western blot to identify changes in the phosphorylation levels of AKT and other downstream EGFR targets. The following antibodies were used: Flag (Sigma-Aldrich, Cat. # F3165), p-AKT (Ser473) (Cell Signal, Cat. # 4060), pan-AKT (Cell Signal, Cat. # 4685), p-ERK1/2 (Cell Signal, Cat. # 4367), and total ERK1/2 (Cell Signal, Cat. # 9107). Cell viability analyses were performed to detect sensitivity to cetuximab and/or to 5-fluorouracil (5-FU). The hotspot mutations in PIK3CA exons 9 and 20 (p.E542K, p.E545K and p.H1047R) were included for comparison. Vector construction, western blot and cell viability analysis are described in the Supplementary Materials and Methods.
Validation Cohort Enrollment and Sample Collection
A validation cohort of patients was prospectively enrolled to verify the acquired resistance mutations detected only in ctDNA after the main data analyses were completed. These patients were enrolled on the same basis as the former patients, the exception being the inclusion of wild-type NRAS codons 12 and 13 in the eligibility criteria according to updated studies(1). Longitudinal plasma samples were collected every 4–8 weeks during the entire treatment period. Investigators blinded to clinical data conducted mutational analyses independently.
Target Gene Regions of Amplicon Sequencing
The following gene regions were added to the former panel for Amplicon deep sequencing: APC (exons 14, 15, 16), EGFR (exons 18 to 21), GNAS (exons 8), PIK3CA (exons 9 and 20) and TP53 (exons 4b and 8), as well as the splice site regions of these exons. All of these target regions were reported to be frequently mutated in colorectal cancer and are possibly implicated in drug resistance(27,28). The primer sequences are provided in Supplementary Materials and Methods. The remaining conditions for the next generation sequencing were the same as for the former experiments.
Statistical Analysis
Kaplan-Meier methods were used to estimate progression-free survival (PFS). A univariate Cox regression analysis was performed for each of the variables of interest. The hazard ratio (HR), 95% confidence intervals (CI) and Wald statistic P-values are reported for each model. A P-value of less than 0.05 was considered statistically significant, and an HR greater than 1.5 was considered clinically meaningful due to the small sample size. All statistical tests were performed using SPSS version 20.0 software (IBM).
RESULTS
Patient Information
In total, 59 patients from the initial development cohort were screened for eligibility between August 2011 and December 2013. Six patients were excluded from the study due to the lack of suitable tumor samples or of peripheral blood cell samples collected prior to therapy. The remaining 53 patients were enrolled in the study as the development cohort and received at least 4 weeks of cetuximab alone or in combination with chemotherapy. The patients were divided into two groups based on the response evaluation at week 12. We defined primary resistance as PFS < 12 weeks and acquired resistance as PFS ≥ 12 weeks(29).
The acquired resistance group consisted of 20 patients with longitudinal plasma samples (cases 1–20) and 18 patients without longitudinal plasma samples (with only 2 to 3 plasma samples including baseline and progression points) (cases 21–38). Of the 38 patients with acquired resistance, 6 patients without longitudinal plasma samples were excluded from further analysis due to the lack of plasma samples at progression. Therefore, a total of 32 patients with acquired resistance were included in the mutational analysis (Fig 1). As a comparison group, we included 15 primary resistance patients (cases 39–53). Detailed clinical information is provided in Table S1.
Figure 1. Workflow of the study.
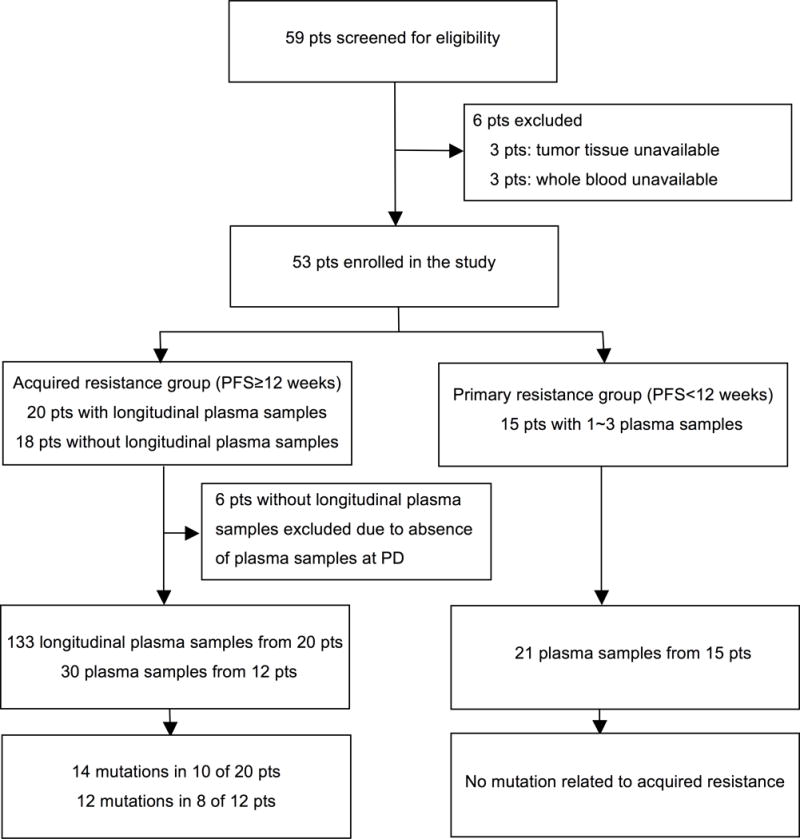
Of the 59 patients screened for eligibility, 53 patients were enrolled in the study and received at least 4 weeks of cetuximab therapy. PD, progressive disease; PFS, progression-free survival; pts, patients.
Investigation of Somatic Variants in Circulating Tumor DNA
We sequenced 18 exons from 8 genes involved in EGFR signaling, covering approximately 3 thousand base pairs. The average sequencing depth (raw data) across all plasma samples reached 9,664×. We identified more than 20,000 SNVs among all samples processed. The vast majority of the SNVs were present in very low allelic fractions (<0.5%) (Fig 2A). We retained these variants in further analyses, as low-abundance mutations may be functionally relevant.
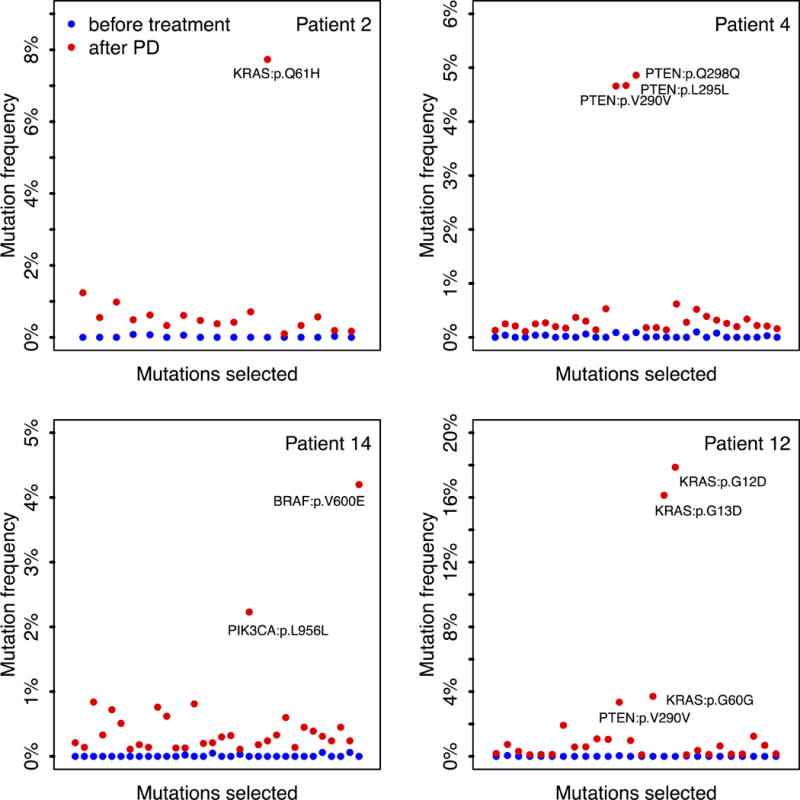
Figure 2. Screening and functional analysis of acquired resistance related mutations.
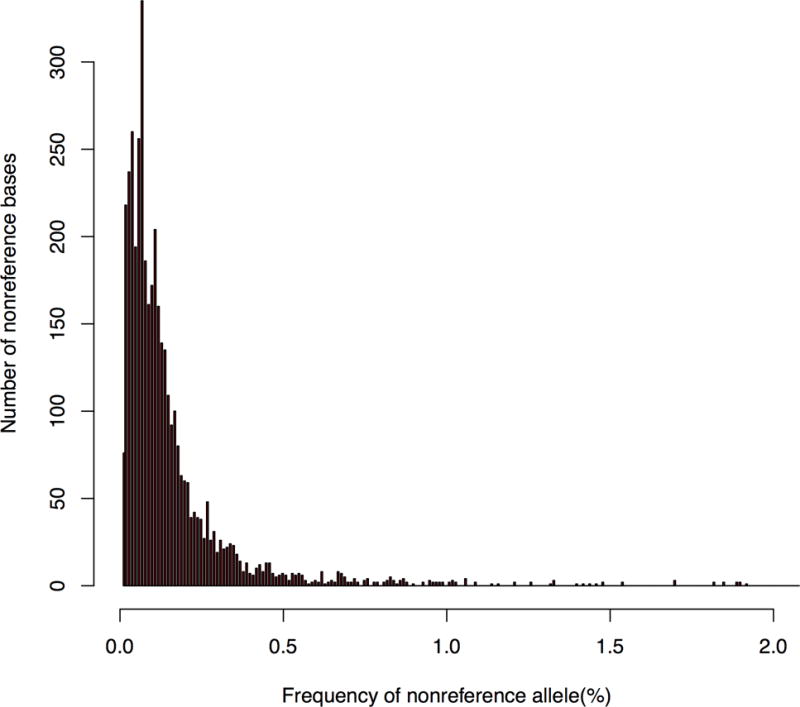
A, Distribution of the frequency of nonreference allele detected in circulating tumor DNA in a representative plasma sample. The majority of the single nucleotide variants (SNVs) were present in very low allelic frequency (<0.5%).
B, The frequencies of candidate mutations in four representative patients, before and after treatment with cetuximab therapy. Mutations frequencies were either significantly higher at disease progression or only present at disease progression. Quartile analysis was used to identify outliers.
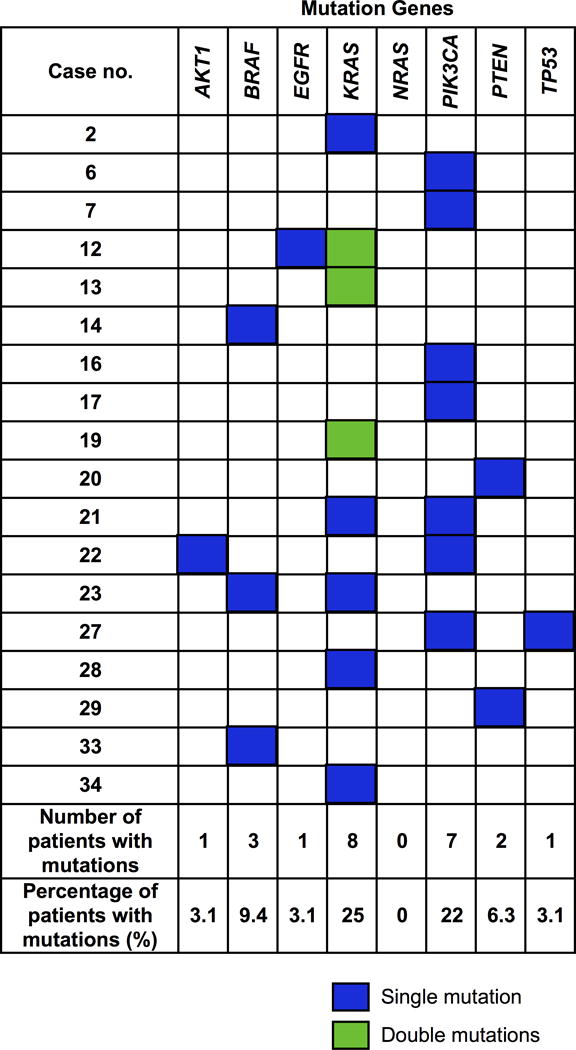
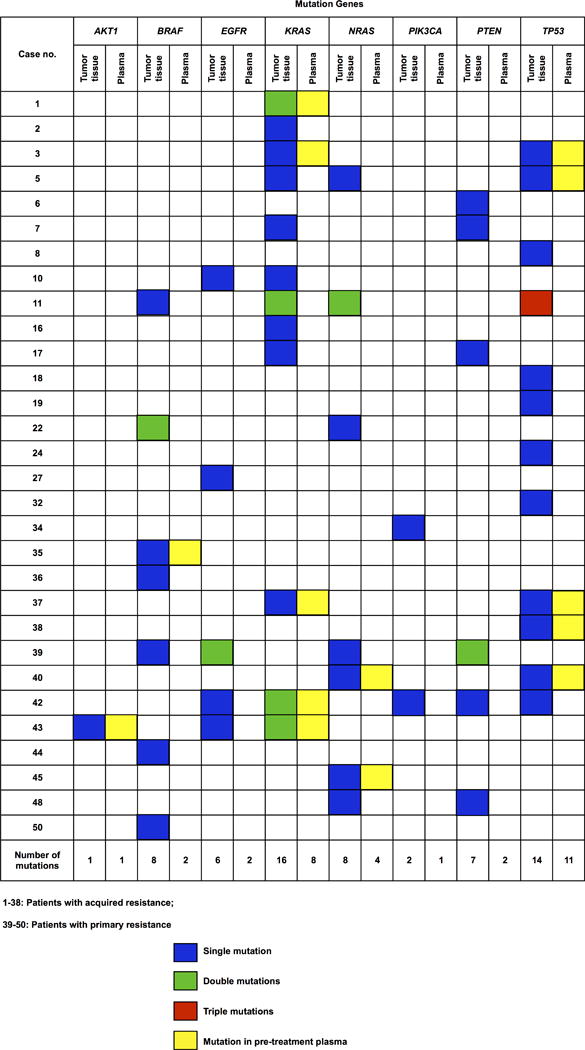
C, Genetic mutations identified in the ctDNA of individual patients that were associated with acquired resistance to cetuximab. ctDNA, circulating tumor DNA.
D, Genetic mutations detected in tumor tissue and in pre-treatment plasma samples from individual patients.
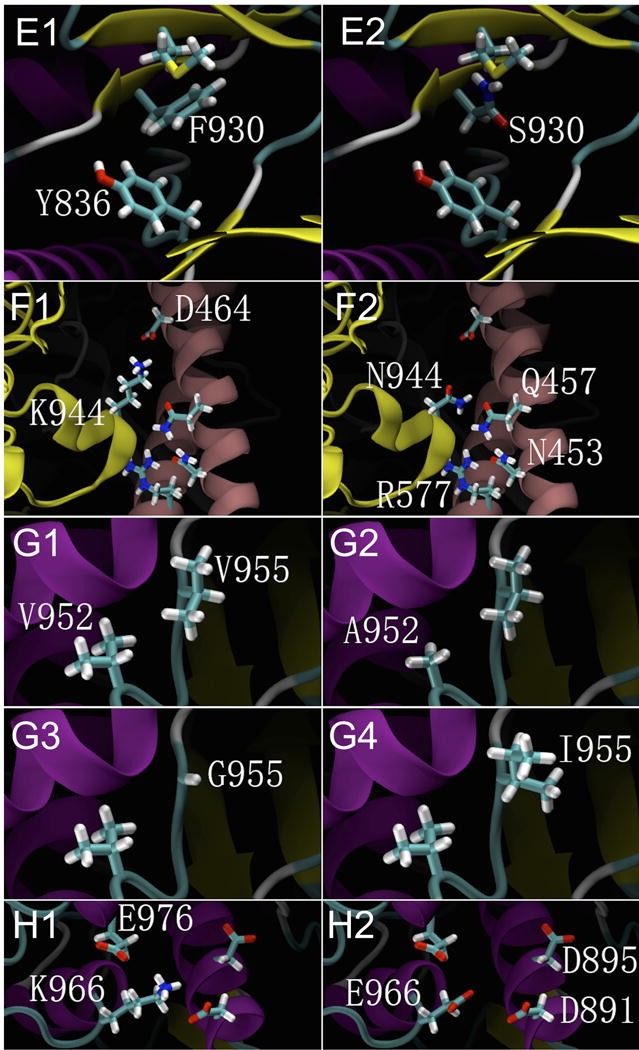
E1, F930 can form a π interaction with Y836; E2, The F930S mutation abolishes the π interaction with Y836.
F1, K944 can form an ionic bond with D464 in the α-regulatory subunit; F2, The K944N mutation abolishes theionic bond interaction with D464,but it may form a hydrogen bond interaction with N453, Q457 and R577 in the α-regulatory subunit. Such interactions caused by these mutations would incur large conformational changes in the protein structure of PIK3CA.
G1, V952 and V955 both feature hydrophobic side chains; G2, G3, The V952A and V955G mutations result in smaller and less hydrophobic side chains; G4, The V955I mutation results in a larger side chain with greater hydrophobicity.
H1, K966 has a basic side chain, which can form ionic interactions with the acidic side chains of E976, D891 and D895. H2, K966E changes the basic side chain to acidic, resulting in repellent interactions with other acidic side chains.
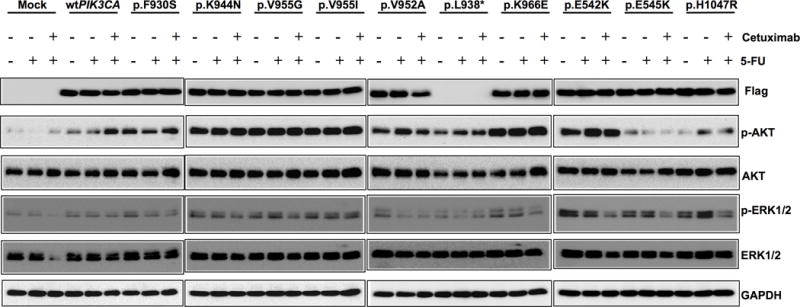
I, Activation of AKT and ERK1/2 by PIK3CA mutations. Western blots depicting the phosphorylation levels of AKT and ERK1/2 in DiFi cells overexpressing wild-type and mutant PIK3CA (p.F930S, p.K944N, p.V955G, p.V955I, p.K966E, p.L938*, p.V952A, p.E542K, p.E545K and p.H1047R) cultured in serum-free media and treated with 100 nM cetuximab and/or 10 μM 5-FU.
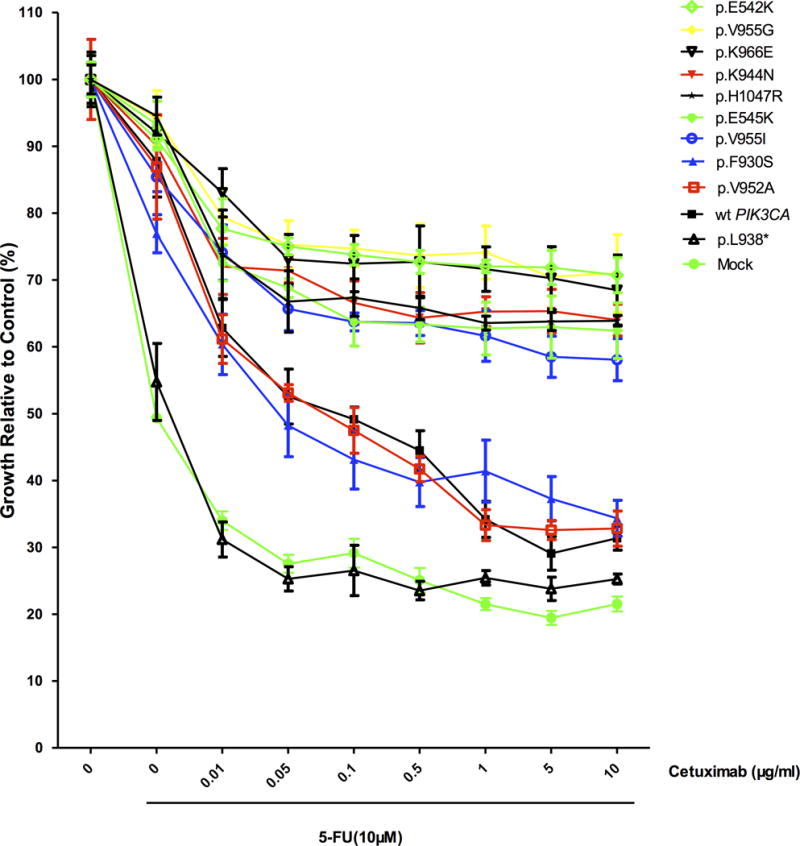
J, Differential growth of DiFi cells transfected with wild-type PIK3CA or mutant PIK3CA in response to cetuximab and 5-FU, ordered by the relative sensitivity to cetuximab and 5-FU. The data are presented as the mean ± SD of six independent experiments. The assays were performed in serum-free media with increasing concentrations of cetuximab in combination with 5-FU at IC50. wt PIK3CA: wild-type PIK3CA.
After screening for the allelic fractions of the SNVs by quartile analysis, we identified an average of 26 SNVs in each patient (Fig 2B). Only those mutations with allelic fractions significantly higher than the majority were eventually selected as candidate mutations. Overall, we identified 39 non-synonymous SNVs as candidates across all 32 patients with acquired resistance to cetuximab. Among these 39 non-synonymous SNVs, 20 mutations were selected as acquired resistance mutations using PolyPhen-2 and SIFT (Table S2). Some of these acquired resistance mutations, specifically p.W22G in AKT1; p.V600E in BRAF; p.K5N, p.G12D, p.G12V, p.G13D, and p.Q61H in KRAS; p.M134L and p.Q245* in PTEN, are described in the large intestine dataset of the COSMIC database (including in cecum, colon, and rectal cancers), whereas none of the mutations found in PIK3CA (p.K944N, p.F930S, p.V955G, p.V955I, and p.K966E) are described in COSMIC (Table S2).
Eventually, in the 32 patients with acquired resistance, 14 mutations were present in 10 of the 20 patients with longitudinal plasma samples, and 12 mutations were present in 8 of the 12 patients without longitudinal plasma samples. Twenty-five of the 26 mutations exhibited a highly significant difference (P-value < 0.01) from the background non-reference allelic fractions (Table 1; Table S3), whereas none of the candidate mutations were identified in the 15 patients with primary resistance.
Table 1.
Mutations related to acquired cetuximab resistance.
| Case no. | Gene | Transcript Accession | Exon | Nucleotide (genomic) | Nucleotide (cDNA) | Amino acid (protein) | AF (%) | P Value |
|---|---|---|---|---|---|---|---|---|
| 2 | KRAS | NM_004985 | 3 | Chr12:25380275 T>G | c.364T>G | Q61H | 7.73 | <0.0001 |
| 6 | PIK3CA | NM_006218 | 19 | Chr3:178948060 A>T | c.2832A>T | K944N | 1.07 | 0.0005 |
| 7 | PIK3CA | NM_006218 | 19 | Chr3:178948091 G>A | c.2863G>A | V955I | 1.21 | <0.0001 |
| 12 | EGFR | NM_005228 | 12 | Chr7:55227909 G>A | c.1376G>A | G459E | 1.24 | 0.032 |
| 12 | KRAS | NM_004985 | 2 | Chr12:25398284 C>T | c.35C>T | G12D | 17.87 | <0.0001 |
| 12 | KRAS | NM_004985 | 2 | Chr12:25398281 C>T | c.38C>T | G13D | 16.14 | <0.0001 |
| 13 | KRAS | NM_004985 | 2 | Chr12:25398284 C>T | c.35C>T | G12D | 2.29 | <0.0001 |
| 13 | KRAS | NM_004985 | 2 | Chr12:25398281 C>T | c.38C>T | G13D | 2.31 | <0.0001 |
| 14 | BRAF | NM_004333 | 15 | Chr7:140453136 A>T | c.1799T>A | V600E | 4.2 | <0.0001 |
| 16 | PIK3CA | NM_006218 | 19 | Chr3:178948060 A>T | c.2832A>T | K944N | 1.52 | 0.0001 |
| 17 | PIK3CA | NM_006218 | 19 | Chr3:178948060 A>T | c.2832A>T | K944N | 1.12 | 0.0081 |
| 19 | KRAS | NM_004985 | 2 | Chr12:25398284 C>T | c.35C>T | G12D | 3.87 | <0.0001 |
| 19 | KRAS | NM_004985 | 2 | Chr12:25398281 C>T | c.38C>T | G13D | 2.92 | <0.0001 |
| 20 | PTEN | NM_000314 | 7 | Chr10:89717708 C>T | c.733C>T | Q245* | 1.15 | <0.0001 |
| 21 | KRAS | NM_004985 | 4 | Chr12:25378686 C>A | c.312C>A | K104N | 1.34 | <0.0001 |
| 21 | PIK3CA | NM_006218 | 19 | Chr3:178948017 T>C | c.2789T>C | F930S | 2.11 | <0.0001 |
| 22 | PIK3CA | NM_006218 | 19 | Chr3:178948092 T>G | c.2864T>G | V955G | 1.46 | <0.0001 |
| 22 | AKT1 | NM_001014431 | 3 | Chr14;105246536 A>C | c.64A>G | W22G | 1.5 | <0.0001 |
| 23 | BRAF | NM_004333 | 15 | Chr7:140453076 A>T | c.1859A>T | M620K | 1.04 | <0.0001 |
| 23 | KRAS | NM_004985 | 2 | Chr12:25398233 A>G | c.86A>G | V29A | 1.65 | <0.0001 |
| 27 | TP53 | NM_000546 | 5 | Chr17:7578255 T>A | c.594T>A | E198D | 1.57 | <0.0001 |
| 27 | PIK3CA | NM_006218 | 19 | Chr3:178948124 A>G | c.2896A>G | K966E | 1.72 | <0.0001 |
| 28 | KRAS | NM_004985 | 2 | Chr12:25398304 T>G | c.15T>G | K5N | 1.19 | <0.0001 |
| 29 | PTEN | NM_000314 | 5 | Chr10:89692916 A>T | c.400A>T | M134L | 1.15 | <0.0001 |
| 33 | BRAF | NM_004333 | 15 | Chr7:140453181 T>C | c.1754T>C | H585R | 1.13 | <0.0001 |
| 34 | KRAS | NM_004985 | 2 | Chr12:25398284 C>A | c.35C>A | G12V | 3.78 | <0.0001 |
AF: mutant allelic fraction of the last plasma sample.
: Stop-gain mutation.
P-value: The differences of the identified mutant allelic fraction from the background non-reference allelic fractions were calculated using Student’s t-test. Twenty-five of the 26 mutations exhibited a highly significant difference (P-value < 0.01)
The detected acquired mutations were observed most commonly in PIK3CA and KRAS, with a total of 5 PIK3CA mutations identified in 7 of the 32 patients (22%), and 5 KRAS mutations in 8 of the 32 patients (25%; 3 of these patients harbored a double mutation in KRAS). In addition, 3 point mutations in BRAF, including the hotspot mutation c.1799T>A (p.V600E), and sporadic mutations in AKT1, EGFR, TP53, and PTEN were identified. Five patients harbored mutations in more than one gene (Fig 2C).
Analysis of Pre-existing Mutations in Tumor Tissues
Sixty-two somatic mutations were identified, in a total of 30 out of 53 patients. Thirty-nine of these mutations were identified in 22 out of 38 patients with acquired resistance (average 2 mutations per individual), which mainly clustered in KRAS and TP53 (30.8% each), whereas the remaining 23 mutations were identified in 8 out of 15 patients with primary resistance (average 3 mutations per individual), which were uniformly distributed (17.4% each in KRAS, NRAS, EGFR, and PTEN). Among these 62 mutations, only 14 were detected in plasma samples before treatment, 8 of which were in patients with acquired resistance (21% of 38 patients), with the remaining 6 mutations in patients with primary resistance (40% of 15 patients; Fig 2D; Table 2).
Table 2.
Pre-existing mutations in tumor tissue and presence in plasma before treatment
| Case no. | Gene | Transcript Accession | Exon | Nucleotide (genomic) | Nucleotide (cDNA) | Amino acid (protein) | AFa in tumor tissue (%) | AF in plasma before treatment (%) | Source of tumor tissueb |
|---|---|---|---|---|---|---|---|---|---|
| 1 | KRAS | NM_004985 | 4 | chr12:25378688 T>C | c.310T>C | p.K104E | 7.41 | –c | P |
| KRAS | NM_004985 | 3 | chr12:25380231 T>C | c.227T>C | p.E76G | 5.13 | 1.09 | ||
| 2 | KRAS | NM_004985 | 2 | chr12:25398245 T>G | c.74T>G | p.Q25P | 5.41 | – | P |
| 3 | TP53 | NM_000546 | 7 | chr17:7577121 G>A | c.817G>A | p.R273C | 35.15 | 1.09 | P |
| KRAS | NM_004985 | 3 | chr12:25380275 T>G | c.183T>G | p.Q61H | 27.19 | 1.83 | ||
| 5 | TP53 | NM_000546 | 5 | chr17:7578263 G>A | c.586G>A | p.R196* | 30.82 | 1.59 | P |
| KRAS | NM_004985 | 4 | chr12:25378670 G>A | c.328G>A | p.P110S | 8.11 | – | ||
| NRAS | NM_002524 | 4 | chr1:115252209 G>A | c.431G>A | p.T144I | 6.45 | – | ||
| 6 | PTEN | NM_000314 | 8 | chr10:89720654 A>C | c.805A>C | p.K269Q | 6 | – | P |
| 7 | PTEN | NM_000314 | 7 | chr10:89717661 C>A | c.686C>A | p.S229* | 6.67 | – | P |
| KRAS | NM_004985 | 2 | chr12:25398285 C>T | c.34C>T | p.G12S | 7.69 | – | ||
| 8 | TP53 | NM_000546 | 5 | chr17:7578266 T>A | c.583T>A | p.I195F | 14.17 | – | P |
| 10 | KRAS | NM_004985 | 4 | chr12:25378609 G>A | c.389G>A | p.A130V | 5.13 | – | P |
| EGFR | NM_005228 | 12 | chr7:55227843 C>T | c.1310C>T | p.S437F | 6.25 | – | ||
| 11 | TP53 | NM_000546 | 6 | chr17:7577566 T>C | c.715T>C | p.N239D | 6.18 | – | P |
| TP53 | NM_000546 | 6 | chr17:577555 G>T | c.726G>T | p.C242* | 5.85 | – | ||
| TP53 | NM_000546 | 7 | chr17:7577085 C>T | c.853C>T | p.E285K | 5.37 | – | ||
| KRAS | NM_004985 | 2 | chr12:25398314 G>A | c.5G>A | p.T2I | 6.4 | – | ||
| BRAF | NM_004333 | 15 | chr7:140453124 C>T | c.1811C>T | p.W604* | 5.1 | – | ||
| NRAS | NM_002524 | 3 | chr1:115256508 C>T | c.203C>T | p.R68K | 6.86 | – | ||
| KRAS | NM_004985 | 4 | chr12:25378577 A>G | c.421A>G | p.F141L | 5.75 | – | ||
| NRAS | NM_002524 | 3 | chr1:115256445 G>T | c.266G>T | p.S89* | 6.98 | – | ||
| 16 | KRAS | NM_004985 | 2 | chr12:25398285 C>T | c.34C>T | p.G12S | 28.15 | – | P |
| 17 | KRAS | NM_004985 | 2 | chr12:25398284 C>A | c.35C>A | p.G12V | 40.6 | – | P |
| PTEN | NM_000314 | 7 | chr10:89717672 C>T | c.697C>T | p.R233* | 13.73 | – | ||
| 18 | TP53 | NM_000546 | 7 | chr17:7577138 C>T | c.800C>T | p.R267Q | 14.34 | – | P |
| 19 | TP53 | NM_000546 | 5 | chr17:7578217 G>A | c.632G>A | p.T211I | 23.08 | – | P |
| 22 | BRAF | NM_004333 | 15 | chr7:140453136 A>T | c.1799A>T | p.V600E | 6.25 | – | P |
| BRAF | NM_004333 | 15 | chr7:140453139 G>A | c.1796G>A | p.T599I | 6.25 | – | ||
| NRAS | NM_002524 | 2 | chr1:115258685 C>T | c.97C>T | p.D33N | 6.25 | – | ||
| 24 | TP53 | NM_000546 | 5 | chr17:7578263 G>A | c.586G>A | p.R196* | 54.55 | – | P |
| 27 | EGFR | NM_005228 | 10 | chr7:55224507 A>G | c.1189A>G | p.T397A | 5 | – | P |
| 32 | TP53 | NM_000546 | 5 | chr17:7578262 C>T | c.587C>T | p.R196Q | 8.16 | – | M |
| 34 | PIK3CA | NM_006218 | 19 | chr3:178948041 T>A | c.2813T>A | p.L938* | 6.9 | – | P |
| 35 | BRAF | NM_004333 | 15 | chr7:140453136 A>T | c.1799A>T | p.V600E | 44.35 | 3.77 | M |
| 36 | BRAF | NM_004333 | 15 | chr7:140453136 A>T | c.1799A>T | p.V600E | 15 | – | P |
| 37 | TP53 | NM_000546 | 5 | chr1:7578263 G>A | c.586G>A | p.R196* | 25 | 17.54 | M |
| KRAS | NM_004985 | 2 | chr12:25398284 C>T | c.35C>T | p.G12D | 18.03 | 11.06 | ||
| 38 | TP53 | NM_000546 | 7 | chr17:7577121 G>A | c.817G>A | p.R273C | 33.58 | 1.39 | P |
| 39 | PTEN | NM_000314 | 8 | chr10:89720654 A>T | c.805A>T | p.K269* | 17.39 | – | P |
| PTEN | NM_000314 | 5 | chr10:89693000 G>T | c.484G>T | p.D162Y | 5.34 | – | ||
| NRAS | NM_002524 | 2 | chr1:115258744 C>T | c.38C>T | p.G13D | 5.15 | – | ||
| EGFR | NM_005228 | 10 | chr7:55224522 A>G | c.1204A>G | p.T402A | 6.22 | – | ||
| EGFR | NM_005228 | 10 | chr7:55224507 A>G | c.1189A>G | p.T397A | 5.78 | – | ||
| BRAF | NM_004333 | 15 | chr7:140453182 G>A | c.1753G>A | p.H585Y | 5.35 | – | ||
| 40 | TP53 | NM_000546 | 7 | chr17:7577120 C>T | c.818C>T | p.R273H | 81.16 | 24.5 | P |
| NRAS | NM_002524 | 3 | chr1:115256529 T>A | c.182T>A | p.Q61L | 41.67 | 15.28 | ||
| 42 | TP53 | NM_000546 | 7 | chr17:7577138 C>T | c.800C>T | p.R267Q | 7.64 | – | M |
| PTEN | NM_000314 | 5 | chr10:89692890 A>G | c.374A>G | p.K125R | 5.47 | – | ||
| PIK3CA | NM_006218 | 19 | chr3:178948083 T>C | c.2855T>C | p.V952A | 7.44 | – | ||
| KRAS | NM_004985 | 4 | chr12:25378598 C>T | c.400C>T | p.A134T | 5.49 | – | ||
| KRAS | NM_004985 | 2 | chr12:25398285 C>T | c.34C>T | p.G12S | 27.27 | 11.93 | ||
| EGFR | NM_005228 | 10 | chr7:55224490 A G | c.1172A>G | p.E391G | 6.25 | – | ||
| 43 | KRAS | NM_004985 | 3 | chr12:25380276 T>C | c.182T>C | p.Q61R | 6.47 | – | M |
| KRAS | NM_004985 | 3 | chr12;25380275 T>A | c.183T>A | p.Q61H | 5.04 | 17.57 | ||
| EGFR | NM_005228 | 12 | chr7:55227963 G>A | c.1430G>A | p.W477* | 7.25 | – | ||
| AKT1 | NM_001014431 | 3 | chr14:105246551 C>T | c.49C>T | p.E17K | 17.24 | 25 | ||
| 44 | BRAF | NM_004333 | 15 | chr7:140453136 A>T | c.1799A>T | p.V600E | 24.42 | – | P |
| 45 | NRAS | NM_002524 | 2 | chr1:115258745 C>G | c.37C>G | p.G13R | 34.82 | 37.97 | P |
| 48 | PTEN | NM_000314 | 5 | chr10:89692905 G>A | c.389G>A | p.R130Q | 54.55 | – | P |
| NRAS | NM_002524 | 2 | chr1:115258747 C>T | c.35C>T | p.G12D | 30.43 | – | ||
| 50 | BRAF | NM_004333 | 15 | chr7:140453136 A>T | c.1799A>T | p.V600E | 18.28 | – | P |
AF: mutant allelic fraction of the last plasma sample.
Source of tumor tissue: P, primary tumor; M, metastatic lesion
—: Mutant allele under the detectable level
: Stop-gain mutation.
Structure Modeling and Functional Analysis of the PIK3CA Mutations
Structural modeling revealed that all of the PIK3CA point mutations identified in ctDNA (p.K944N, p.F930S, p.V955G, p.V955I, and p.K966E) and in FFPE tumor tissue (p.V952A and p.L938*) affected the structural configuration of the PIK3CA protein and the kinase activity. p.F930 is located in the ATP-binding pocket, p. K944, p.V952 and p.V955 are in the activation-loop, and p.K966 is in the coil region close to the c-lobe, which is thought to stabilize the kinase conformation (Fig 2E–H).
In Vitro Functional Assays of the PIK3CA Mutations
To confirm the role of PIK3CA mutations in cetuximab resistance, DiFi cells were transfected with PIK3CA mutations p.K944N, p.V955G, p.V955I, p.K966E p.F930S and p.V952A, as well as the truncation mutation p.L938* were generated. We performed western blot assays for pAKT (phosphorylated AKT) and pERK in DiFi cells transfected with these PIK3CA mutations. Compared with non-targeting control cells, PIK3CA mutations p.K944N, p.V955G, p.V955I and p.K966E markedly increased the phosphorylation levels of AKT and MAPK3/MAPK1 (ERK1/ERK2), which were not affected by the addition of cetuximab alone or in combination with 5-FU. While the PIK3CA mutations p.F930S and p.V952A, as well as the truncation mutation p.L938*, had a less effect on AKT and MAPK3/MAPK1 phosphorylation, especially in the presence of cetuximab and/or 5-FU (Fig 3I).
Figure 3. Comparing circulating biomarkers with acquired resistant mutations used to monitor tumor dynamics and comparing different scenarios to predict progression-free survival.
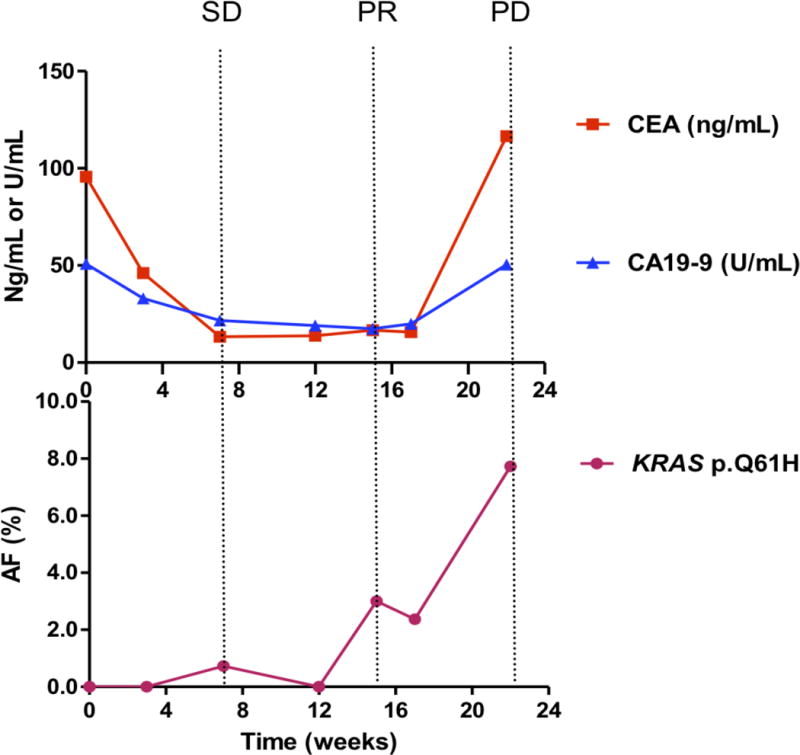
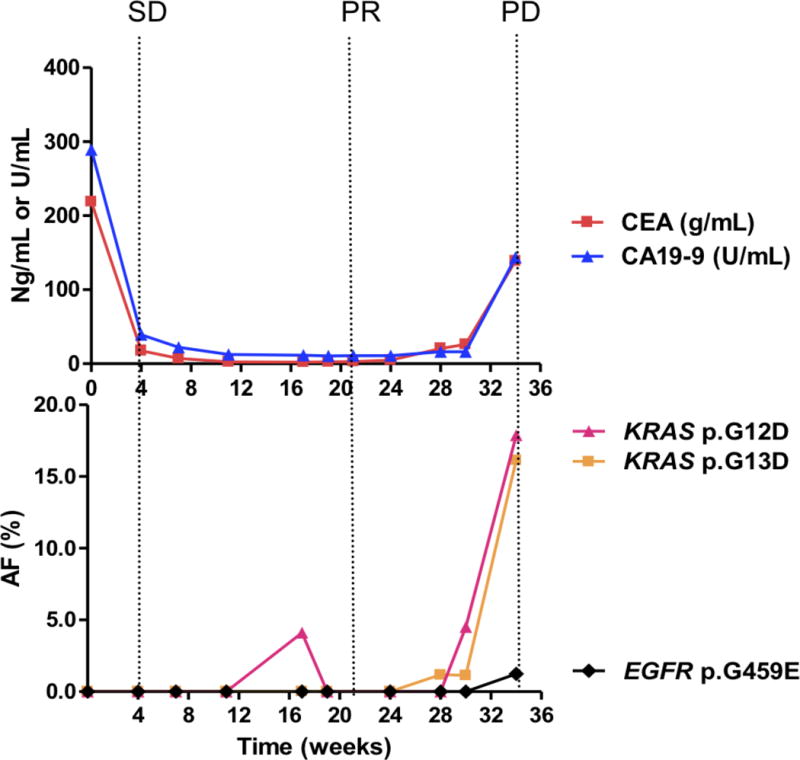
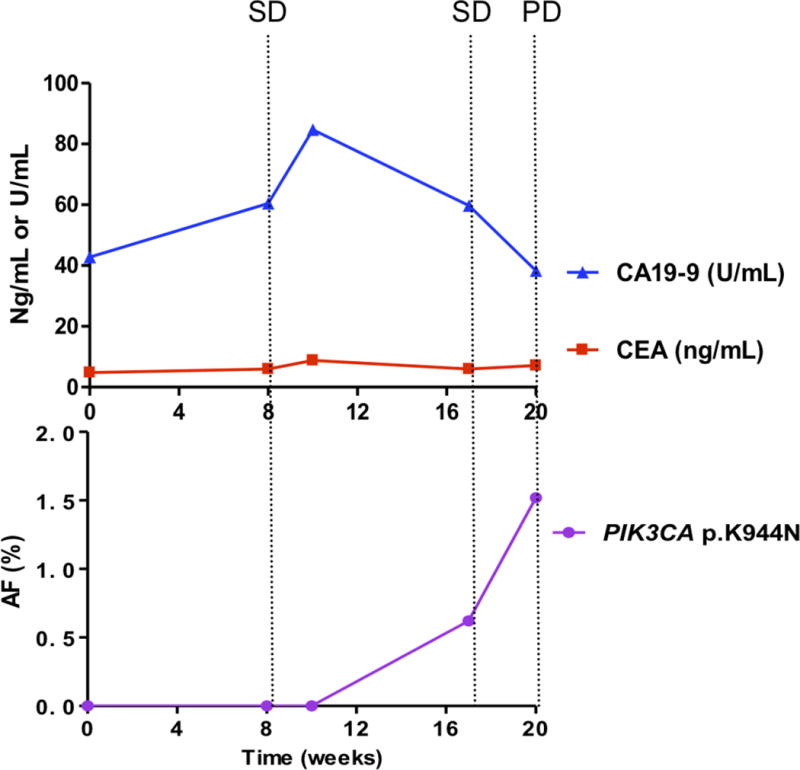
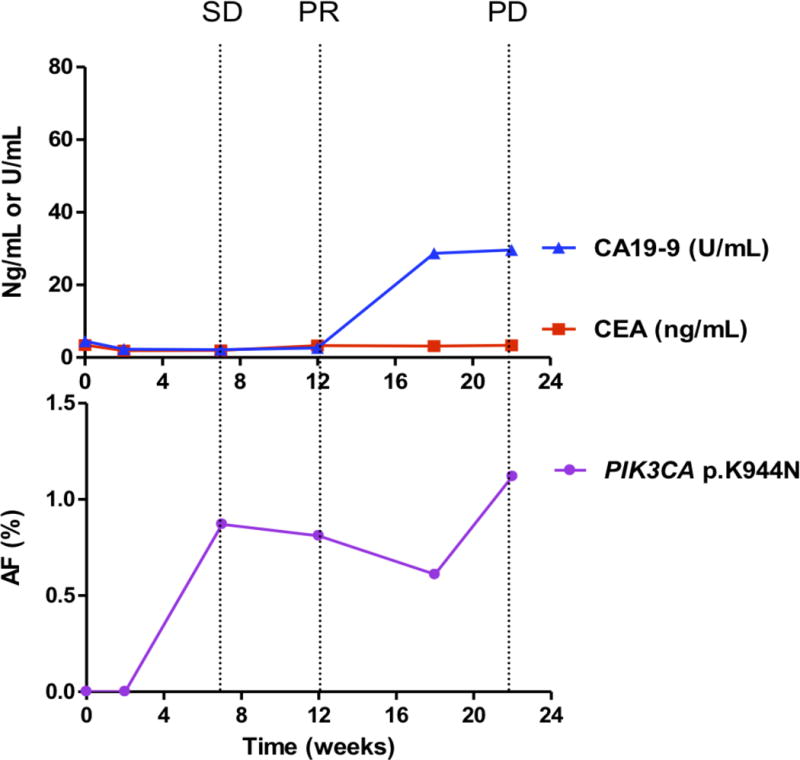
Each panel represents data from a different patient. A, case 2; B, case 12; C, case 16; D, case 17.
Upper panels show the plasma levels of circulating biomarkers: CEA (ng per milliliter, red lines) and CA19-9 (U per milliliter, blue lines), over time (22 weeks). Lower panels show the allelic fractions (AF) of mutations in the patient’s circulating tumor DNA (ctDNA). Each color represents a specific mutation. Vertical dotted lines show the tumor response evaluation assessed according to RECIST criteria. PD, progressive disease; SD, stable disease; PR, partial response.
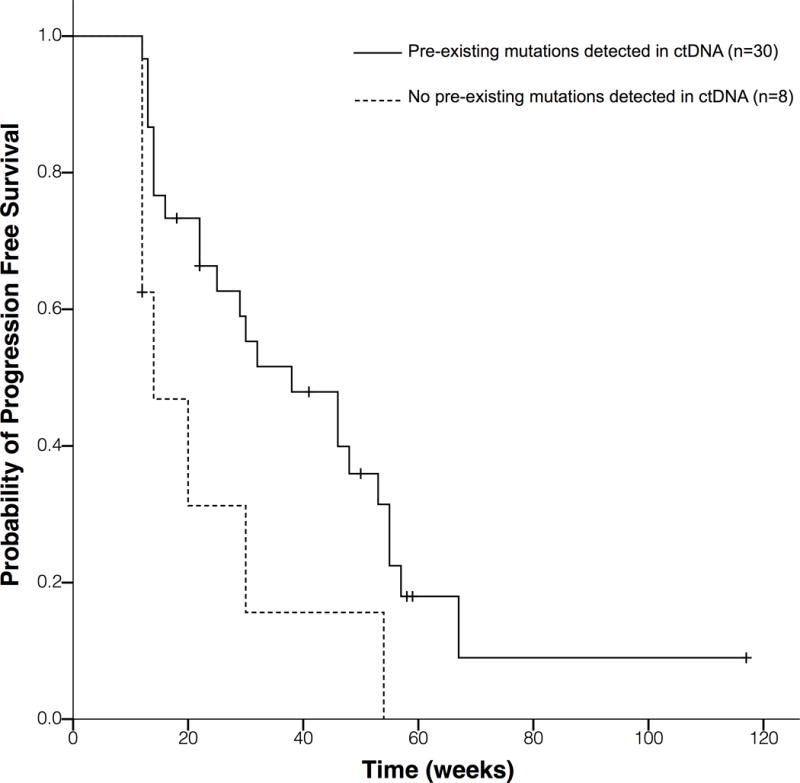
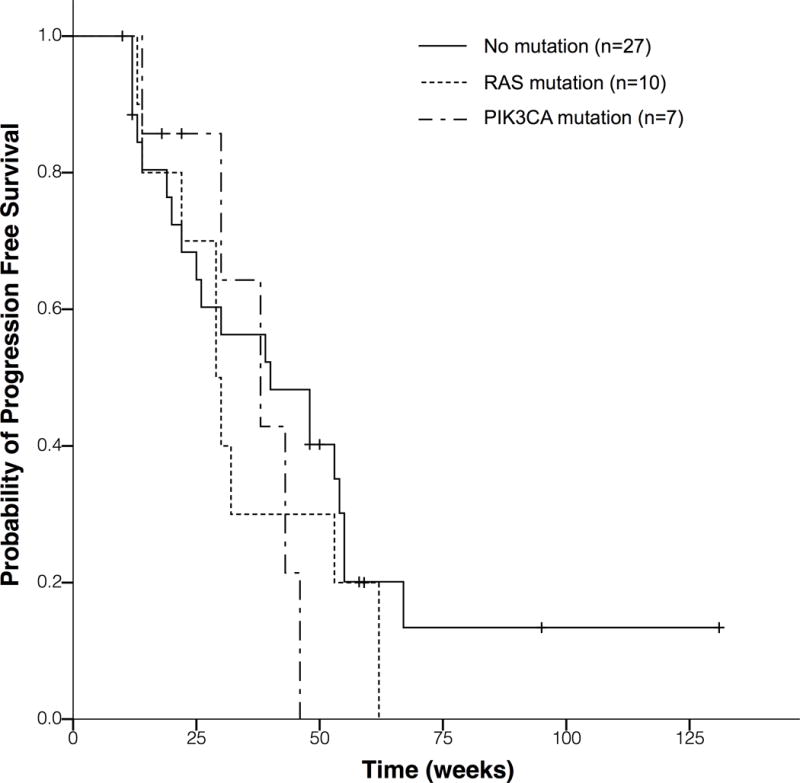
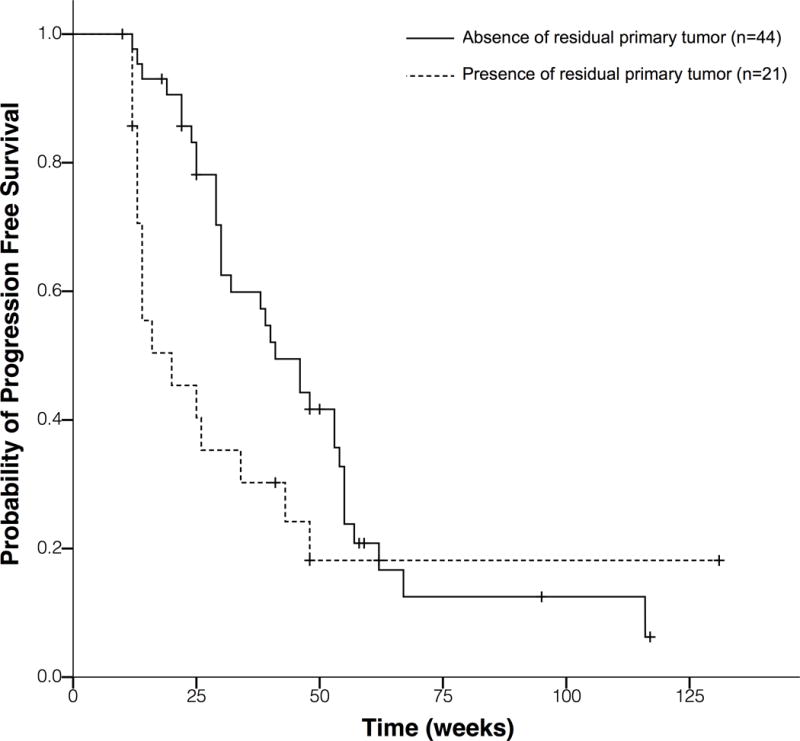
E to G each panel represents Kaplan-Meier survival functions for PFS, based on 65 patients with acquired cetuximab resistance. PFS, progression-free survival. ctDNA, circulating tumor DNA.
E, Present formalin-fixed paraffin-embedded samples. Patients with mutations detected in ctDNA before treatment exhibit a significantly reduced PFS compared to those without any mutation in ctDNA (median PFS 14 w vs. 38 w; HR, 2.69; 95% CI, 1.12 to 6.49; P = 0.027).
F, Patients with the presence of a residual primary tumor have a trend of shorter PFS compared with those without a residual primary tumor (mPFS, 20 weeks vs. 41 weeks; HR, 1.71; 95% CI, 0.94 to 3.13; P =0.08).
G, Comparing to patients with no mutation detected in ctDNA, patients with PIK3CA or RAS mutations showed a pronounced mPFS decrease, although without significant difference due to very small sample size (40 weeks vs. 38 weeks vs. 29 weeks; HR, 1.26; 95% CI, 0.79 to 2.01; P = 0.34).
Cell viability analysis suggested that in the presence of cetuximab in combination with 10 μM 5-FU, compared with mock transfected cells, DiFi cells overexpressing p.K944N, p.V955G, p.V955I, p.K966E, p.E542K, p.E545K and p.H1047R exhibited a high degree of resistance. Wild-type PIK3CA, as well as its p.F930S and p.V952A mutants, resulted in moderate resistance to cetuximab, and the truncation mutation p.L938* did not exhibit resistance. In the presence of 10 μg/ml cetuximab, growth rates in cells with novel PIK3CA mutations (p.K944N, p.F930S, p.V955G, p.V955I, and p.K966E) and with wild-type PIK3CA were 59.18±14.72% vs. 31.37%, respectively (Fig 2J; Fig S2). These results demonstrate that these candidate mutations are likely to be involved in conferring resistance because of their effects on the activation of the phosphorylation of AKT and MAPK3/MAPK1 (ERK1/ERK2).
Correlations among Variant Frequency, CEA and CA19-9 Levels, and Tumor Response evaluation
Among the 20 patients with longitudinal plasma samples, 10 carried candidate mutations. We compared changes in the allelic fraction of the identified mutations in each patient with serum levels of corresponding tumor biomarkers and response ascertained using CT (as defined by RECIST) (Fig 3A–D; Fig S3). PIK3CA mutations were identified in 4 patients (Nos. 6, 7, 16, and 17), and KRAS mutations were identified in an additional 4 patients (Nos. 2, 12, 13 and 19). Only 2 of the 10 patients harbored mutations in other genes. Patient 14 harbored the BRAF p.V600E mutation, whereas patient 20 carried the PTEN p.Q245* mutation. These mutations exhibited an increasing allelic fraction during treatment (Table 1; Table S3). Whereas, only 5 of the 10 patients had elevated CEA or CA19-9 levels that correlated well with the tumor response. The levels of candidate resistant mutations increased prior to clinical progression, as determined by CT scans. A median of 15.0 weeks of lead time (range 0–35 weeks) was observed. In patients carried PIK3CA mutations, the average lead time was 10.8 weeks, whereas in patients with KRAS mutations, the average lead time was 21.8 weeks (Table S1).
Additional Mutation Analysis in the Validation Cohort
An independent validation cohort of 32 patients (cases v1-v32) was prospectively enrolled between January 2014 and June 2016 to verify the acquired resistance mutations detected in the ctDNA of patients from the development cohort. Five patients (cases v1, v3, v9, v17 and v18) were placed in the primary resistance group, while the remaining 27 patients were classed as having acquired resistance (Table S4).
Thirty-seven mutations were identified in 14 of the 27 patients with acquired resistance, including one novel PIK3CA mutation (p.K944N) and the hotspot mutations p.V600E in BRAF; p.G12V in KRAS; p.G12V, p.G13V and p.Q61H in NRAS; p.H1047R and p.E545K in PIK3CA; and p.T790M in EGFR (Table S5, Fig S4). Among these 14 patients, 5 patients carried multiple gene mutations, including 2 of them harbored both KRAS and PIK3CA hotspot mutations (case v5: p.H1047R in PIK3CA and p.M72V in KRAS; case v20: p.E545K, p.Q546K in PIK3CA and p.G12V in KRAS). Other novel mutations in PIK3CA (p.F930S, p.V955G, p.V955I, and p.K966E) identified in the initial cohort were not detected in patients in this validation cohort. Although, p.V600E in BRAF and p.G12V in KRAS were the only mutations verified in both cohorts due to the limited sample size and increased gene regions for sequencing in validation cohort, the identification of aforementioned hotspot mutations testified the reliability of the results in this validation cohort. No acquired resistance mutations were detected in the 5 patients with primary resistance in the validation cohort.
Clinical Features and Prognostic Value of Mutation Profiles and the Clinical Implications
The relationship between tumor location and RAS or PIK3CA mutations were compared. We first analyzed RAS and PIK3CA mutations in tumor tissue before cetuximab treatment. In the 13 cases with right-sided colon, RAS mutation rate was 38.5% (5/13) and PIK3CA mutation rate was 7.7% (1/13); In the 38 cases with left-sided colon, RAS mutation rate was 31.6% (12/38) and PIK3CA mutation rate was 2.6% (1/38) (Table S6).
We also analyzed differences of acquired RAS or PIK3CA mutations in ctDNA between left- and right- colon. In 17 patients with right-sided colon, RAS mutation rate was 23.5% (4/17) and PIK3CA mutation rate was 11.8% (2/17); in 47 patients with left-sided colon, RAS mutation rate was 19.1% (9/47), PIK3CA mutation rate was 17% (8/47). No significant differences were observed between left- and right- colon both in RAS and PIK3CA mutation rate (Table S7).
Next, we examined progression-free survival (PFS) from the clinical data of 65 patients with acquired resistance, to determine the relative prognostic value of mutation profiles and other clinical features. These patients consisted of 38 patients from the development cohort and 27 patients from the validation cohort.
Patients from the development cohort who had pre-existing mutations in FFPE samples that were also present in ctDNA prior to treatment, showed significantly shorter PFS compared to those without pre-existing mutations in ctDNA (mPFS, 14 weeks vs. 38 weeks; HR, 2.69; 95% CI, 1.12 to 6.49; P =0.027) (Fig 3E), respectively. We did not perform this analysis in the validation cohort due to the unavailability of FFPE samples.
A trend towards a shorter PFS was noted in patients with a residual primary tumor compared to those with no residual primary tumor (mPFS, 20 weeks vs. 41 weeks; HR, 1.71; 95% CI, 0.94 to 3.13; P =0.08) (Fig 3F).
When comparing to patients with no mutation (n=27) detected in ctDNA, patients with PIK3CA (n=7) or RAS (n=10) mutations showed a pronounced mPFS decrease, although without significant difference due to very small sample size (40 weeks vs. 38 weeks vs. 29 weeks; HR, 1.26; 95% CI, 0.79 to 2.01; P = 0.34)(Fig 3G). Taken together, these results suggest that pre-existing mutations present in ctDNA, residual primary tumor and RAS mutations will be potentially negative factors for cetuximab treatment.
DISCUSSION
In this study, our purpose was to investigate the potentially acquired resistance mutations in 8 targeted genes after clinical benefit from cetuximab-based regimens. The prerequisite concerning the acquired resistance during the cetuximab therapy is the PFS ≥ 12 weeks. For this reason we enrolled all mCRC patients with no previous anti-EGFR antibody treatment prior to study participation who would be treated with cetuximab-based regimen, no matter how many previous treatment lines patients experienced.
We sequenced targeted gene areas with deep coverage to identify emergent mutations in longitudinal plasma samples collected from mCRC patients. Our quartile-based selection strategy helped us to identify mutations that started at extremely low allelic fractions but increased in frequency during treatment, independently of the identification of existing somatic mutations in tumor tissues or in known “hot-spots”. We were therefore not only able to identify novel mutations associated with acquired resistance, but also to build an understanding of resistance in each patient, even those with diverse mutation profiles.
Previous studies have demonstrated that mutations in the EGFR signal transduction pathway, such as RAS, contribute resistance to cetuximab(30). However, whether the PIK3CA mutations at exon 9 and 20 that have been identified in tumor tissue are correlated with drug resistance remains controversial(5,17,31,32). As in the previous study, Bettegowda et al. analyzed known “hot-spot” mutations in NRAS, BRAF, EGFR and PIK3CA and concluded that KRAS mutation is the most important factor for acquiring resistance to anti-EGFR therapy. However, they did not identify any known PIK3CA mutations associated with the acquisition of resistance(13,14).
For PIK3CA, we examined exons 8 and 19 instead of previously reported hotspot mutations in exon 9 and 20, because the hotspot mutations in exons 9 and 20 were not identified in previous reports of acquired cetuximab resistance(13,14). Bettegowda et al had examined the acquired mutations of key genes in EGFR signaling pathway including KRAS, NRAS, BRAF, EGFR and PIK3CA (exon 9 and 20) from ctDNA of 24 mCRC patients during EGFR blockade. They observed 70 acquired mutations including KRAS, NRAS, BRAF and EGFR(13). Siravegna et al had monitored the acquired mutations of 226 genes including PIK3CA (exon 20) in 16 mCRC patients during Anti-EGFR antibody therapy. They identified only KRAS and EGFR mutations. These two studies did not identify treatment-related mutations in exons 9 and 20 of PIK3CA gene(14). Exon 8 encodes the region responsible for plasma membrane binding and exon 19 encodes part of the catalytic domain, including the ATP-binding pocket(33,34). We reasoned that mutations in these PIK3CA sites might cause the constitutive activation of the kinase, similar to previously identified hotspot mutations(35,36), although no any mutations in exons 8 and 19 had been reported in previous studies.
In this study, by analyzing different exons, we discovered 5 novel mutations in PIK3CA exon 19 in the development cohort and 1 novel mutation in exon 19, 2 “hot-spot” mutations in exon 9 and 20 in the validation cohort are closely associated with the development of resistance. Protein structure and functional assays revealed that all of these mutations would affect the structural configuration of PIK3CA, resulting in functional changes of protein. In vitro studies also demonstrated that novel PIK3CA mutations (p.K944N, p.V955G, p.V955I, and p.K966E) exhibited a high degree of resistance to cetuximab because of their effects on the activation of the phosphorylation of AKT and MAPK3/MAPK1 (ERK1/ERK2).
Analyses of molecular pathology and its interactions with environment are increasingly important in cancer research (37–42). As for the comparison of RAS or PIK3CA mutation rate of left- and right- sided colon, Both RAS and PIK3CA mutation rates in tumor tissue were higher in the right- sided colon, which is consistent with findings in the literature reports(43–48), although there were no significant differences due to small sample size. While acquired RAS mutation is more frequent in the right colon, acquired PIK3CA mutation is more frequent in the left colon. Also, there were no significant differences due to small sample size.
We further compared the dynamics of acquired RAS and PIK3CA mutations in ctDNA and their influence on PFS. As compared to those with KRAS mutations, patients with PIK3CA mutations had a shorter lead time of presence of acquired mutations in ctDNA to clinical progression (21.8 vs.10.8 weeks). Patients harboring PIK3CA mutations exhibited increased median PFS, although the difference was not statistically significant due to the limited sample size. Because RAS is the upstream activator of the PI3K pathway(18,49), we speculate that PIK3CA mutations in sites other than the RAS-binding domain are late-onset molecular events, relative to RAS mutations, that occur after exposure to cetuximab. These mutations might potentially exert a complementary effect in tumor progression and acquired resistance to cetuximab.
Another negative prognostic factor revealed in our study is the presence of residual primary tumor, which few studies in cetuximab treatment have mentioned. It is possible that when clones with wild-type genes are eliminated under the selective pressure of cetuximab, the remaining clones with preexisting and other emergent mutations in primary tumor would expand and display resistance over a relatively short time period, resulting in a shorter PFS. In the COIN clinical trial(50), which failed to demonstrate the survival benefit with the addition of cetuximab to chemotherapy, one underlying factor affect the survival benefit could be a substantial proportion of patients (> 40%) with advanced CRC enrolled had unresected primary tumors. This independently supports our finding.
One limitation of this study is that the sample size in both cohorts was small. Larger sample size might help to discover more novel mutations, especially to distinguish the impact of clinical characters, such as tumor location(45,48) and pre-existing mutations on PFS between patients with and without acquired resistance mutations. Second, our present study focused only on the genomic variations analysis. Future investigation will be warranted to explore the potential mechanism beyond EGFR signaling pathway.
In summary, our data indicate that the PIK3CA mutations contribute to acquired cetuximab resistance in patients with mCRC. Compared to RAS mutations, which were reported to present before cetuximab treatment(8,13,14), PIK3CA mutations probably occur after exposure to cetuximab, and may potentially exert a complementary effect in acquired resistance to cetuximab.
Supplementary Material
Table 3.
Clinical characteristics of acquired resistance patients in development cohort and validation cohort
| Patient Characteristics | Development cohort | Validation cohort | P* value |
|---|---|---|---|
| Age (year) | 1 | ||
| <65 | 32 | 23 | |
| >=65 | 6 | 4 | |
| Gender | 1 | ||
| Male | 20 | 15 | |
| Female | 18 | 12 | |
| ECOG | 0.533 | ||
| 0 | 9 | 7 | |
| 1 | 24 | 19 | |
| 2 | 5 | 1 | |
| Primary tumor location | 0.775 | ||
| Right side | 9 | 8 | |
| Left side | 29 | 19 | |
| Prior surgery | 0.894 | ||
| Radical resection | 20 | 14 | |
| Palliative resection | 10 | 6 | |
| None | 8 | 7 | |
| Residue of primary tumor | 1 | ||
| Yes | 15 | 10 | |
| No | 23 | 17 | |
| Line of prior therapy | 0.002 | ||
| <2 lines | 17 | 23 | |
| >=2 lines | 21 | 4 | |
| Regimen | <0.001 | ||
| Cetuximab | 19 | 1 | |
| Cetuximab+ chemotherapy | 19 | 26 |
Fisher’s exact test
Translational Relevance.
Acquired resistance to cetuximab limits their application in clinical practice. In addition to RAS mutations, other genes downstream of the EGFR signaling pathway might be involved in acquired resistance to cetuximab.
We have designed an innovative strategy to identify low-frequency candidate mutations that are associated with acquired cetuximab resistance, by sequencing circulating tumor DNA taken from metastatic colorectal cancer (mCRC) patient plasma samples, obtained before and during treatment. This quartile-based selection strategy helped us to identify mutations that started at extremely low allelic fractions but increased in frequency during treatment, independently of the identification of existing somatic mutations in tumor tissues or in known “hot-spots”.
We have identified 5 novel mutations in exon 19 of PIK3CA, which contribute to acquired cetuximab resistance. The importance of PIK3CA mutations in acquired cetuximab resistance highlights the potential therapeutic benefit of combining a PIK3CA inhibitor with an anti-EGFR antibody in the treatment of mCRC.
Acknowledgments
We thank all medical and ancillary staff at the Cancer Center and the patients for consenting to participate; Bo Zhang of the Department of Pathology for assistance with the preparation and assessment of formalin-fixed paraffin-embedded tumor samples; Xiang-Hua Zuo of the Clinical Laboratory for assistance with CEA and CA 19-9 analysis; Gong-Jie Li of the Department of Radiology for assistance with radiological response evaluation; and Su-Ping Lang and Chang-Hua Chen of GCP ClinPlus Co., Ltd., for their contribution to the statistical analysis; Peter Gorsuch, the scientific editor of Nature Research Editing Service, for their assistant in manuscript preparation.
Financial support: This work was supported by: National Natural Science Foundation of China (to J. Xu, Y. Wang, F. Ge, R. Jia) (Project No. 81573458); Translational Medicine Fund of Academy of Military Medical Sciences (to Y. Wang, J. Xu, Y. Wang, R. Jia) (Project No. 2013ZHYX006); Chinese Society of Clinical Oncology Merck Serono Oncology Research Fund (to Y. Wang, J. Xu, Y. Wang, F. Ge, R. Jia) (Project No. Y-MX2014-052); U.S. National Institutes of Health (NIH) grant (to S. Ogino) (R35 CA197735). Medical Oncology Translational Grant Program of Dana-Farber Cancer Institute (to Z.R. Qian).
Abbreviations
- CA19-9
cancer antigen 19-9
- CEA
carcinoembryonic antigen
- CI
confidence intervals
- CNV
copy number variation
- COSMIC
catalogue of somatic mutations in cancer
- CT
computed tomography
- ctDNA
circulating tumor DNA
- 3D
three-dimensional
- EGFR
epidermal growth factor receptor
- FFPE
formalin fixed paraffin embedded
- 5-FU
5-fluorouracil
- HR
hazard ratio
- mCRC
metastatic colorectal cancer
- NGS
next generation sequencing
- PD
progressive disease
- PFS
progression-free survival
- RECIST
response evaluation criteria in solid tumors
- SNVs
single nucleotide variants
Footnotes
Author Contributions: J.M.X. designed the study. J.M.X. and Y.W. obtained the funding. J.M.X., Y.W., Y.L.W., Y.W., and Z.R.Q. analyzed and interpreted data. T.L., M.N., M.S.L., L.L., F.J.G., C.G., J.Y.G., R.J., Y.L.C., R.R.L., C.H.Z., Z.L.T., Y.J., and Y.P.Z. acquired data. J.M.X., Y.W., Y.L.W., and Y.W. drafted the manuscript. S.O. and Z.R.Q. provided critical revision of the manuscript. H.F.W. provided technical, and material support. Y.P.Z. provided administrative support. J.M.X., Y.W., Y.L.W., and Y.W. provided study supervision. All authors approved the content of the manuscript.
Conflict of interest disclosure statement: The authors have declared no conflict of interest.
Use of standardized official symbols for genes and gene products: We use HUGO (Human Genome Organisation)-approved symbols for genes and gene products, including AKT1, APC, BRAF, EGFR, GNAS, KRAS, MAPK1, MAPK3, NRAS, PIK3CA, PIK3R1, PTEN, and TP53, all of which are described at www.genenames.org. Gene names are italicized, and gene product names are non-italicized.
References
- 1.Douillard JY, Oliner KS, Siena S, Tabernero J, Burkes R, Barugel M, et al. Panitumumab-FOLFOX4 treatment and RAS mutations in colorectal cancer. The New England journal of medicine. 2013;369(11):1023–34. doi: 10.1056/NEJMoa1305275. [DOI] [PubMed] [Google Scholar]
- 2.Tejpar S, Stintzing S, Ciardiello F, Tabernero J, Van Cutsem E, Beier F, et al. Prognostic and Predictive Relevance of Primary Tumor Location in Patients With RAS Wild-Type Metastatic Colorectal Cancer: Retrospective Analyses of the CRYSTAL and FIRE-3 Trials. JAMA oncology. 2016 doi: 10.1001/jamaoncol.2016.3797. [DOI] [PMC free article] [PubMed] [Google Scholar]
- 3.Stintzing S, Modest DP, Rossius L, Lerch MM, von Weikersthal LF, Decker T, et al. FOLFIRI plus cetuximab versus FOLFIRI plus bevacizumab for metastatic colorectal cancer (FIRE-3): a post-hoc analysis of tumour dynamics in the final RAS wild-type subgroup of this randomised open-label phase 3 trial. The Lancet Oncology. 2016;17(10):1426–34. doi: 10.1016/s1470-2045(16)30269-8. [DOI] [PubMed] [Google Scholar]
- 4.Wang F, Bai L, Liu TS, Yu YY, He MM, Liu KY, et al. Right-sided colon cancer and left-sided colorectal cancers respond differently to cetuximab. Chinese journal of cancer. 2015;34(9):384–93. doi: 10.1186/s40880-015-0022-x. [DOI] [PMC free article] [PubMed] [Google Scholar]
- 5.De Roock W, Claes B, Bernasconi D, De Schutter J, Biesmans B, Fountzilas G, et al. Effects of KRAS, BRAF, NRAS, and PIK3CA mutations on the efficacy of cetuximab plus chemotherapy in chemotherapy-refractory metastatic colorectal cancer: a retrospective consortium analysis. The Lancet Oncology. 2010;11(8):753–62. doi: 10.1016/s1470-2045(10)70130-3. [DOI] [PubMed] [Google Scholar]
- 6.Therkildsen C, Bergmann TK, Henrichsen-Schnack T, Ladelund S, Nilbert M. The predictive value of KRAS, NRAS, BRAF, PIK3CA and PTEN for anti-EGFR treatment in metastatic colorectal cancer: A systematic review and meta-analysis. Acta oncologica (Stockholm, Sweden) 2014;53(7):852–64. doi: 10.3109/0284186x.2014.895036. [DOI] [PubMed] [Google Scholar]
- 7.Bronte G, Silvestris N, Castiglia M, Galvano A, Passiglia F, Sortino G, et al. New findings on primary and acquired resistance to anti-EGFR therapy in metastatic colorectal cancer: do all roads lead to RAS? Oncotarget. 2015;6(28):24780–96. doi: 10.18632/oncotarget.4959. [DOI] [PMC free article] [PubMed] [Google Scholar]
- 8.Diaz LA, Jr, Williams RT, Wu J, Kinde I, Hecht JR, Berlin J, et al. The molecular evolution of acquired resistance to targeted EGFR blockade in colorectal cancers. Nature. 2012;486(7404):537–40. doi: 10.1038/nature11219. [DOI] [PMC free article] [PubMed] [Google Scholar]
- 9.Misale S, Yaeger R, Hobor S, Scala E, Janakiraman M, Liska D, et al. Emergence of KRAS mutations and acquired resistance to anti-EGFR therapy in colorectal cancer. Nature. 2012;486(7404):532–6. doi: 10.1038/nature11156. [DOI] [PMC free article] [PubMed] [Google Scholar]
- 10.Thierry AR, Mouliere F, El Messaoudi S, Mollevi C, Lopez-Crapez E, Rolet F, et al. Clinical validation of the detection of KRAS and BRAF mutations from circulating tumor DNA. Nature medicine. 2014;20(4):430–5. doi: 10.1038/nm.3511. [DOI] [PubMed] [Google Scholar]
- 11.Dawson SJ, Tsui DW, Murtaza M, Biggs H, Rueda OM, Chin SF, et al. Analysis of circulating tumor DNA to monitor metastatic breast cancer. The New England journal of medicine. 2013;368(13):1199–209. doi: 10.1056/NEJMoa1213261. [DOI] [PubMed] [Google Scholar]
- 12.Murtaza M, Dawson SJ, Tsui DW, Gale D, Forshew T, Piskorz AM, et al. Non-invasive analysis of acquired resistance to cancer therapy by sequencing of plasma DNA. Nature. 2013;497(7447):108–12. doi: 10.1038/nature12065. [DOI] [PubMed] [Google Scholar]
- 13.Bettegowda C, Sausen M, Leary RJ, Kinde I, Wang Y, Agrawal N, et al. Detection of circulating tumor DNA in early- and late-stage human malignancies. Science translational medicine. 2014;6(224):224ra24. doi: 10.1126/scitranslmed.3007094. [DOI] [PMC free article] [PubMed] [Google Scholar]
- 14.Siravegna G, Mussolin B, Buscarino M, Corti G, Cassingena A, Crisafulli G, et al. Clonal evolution and resistance to EGFR blockade in the blood of colorectal cancer patients. Nature medicine. 2015;21(7):795–801. doi: 10.1038/nm.3870. [DOI] [PMC free article] [PubMed] [Google Scholar]
- 15.Van Cutsem E, Kohne CH, Lang I, Folprecht G, Nowacki MP, Cascinu S, et al. Cetuximab plus irinotecan, fluorouracil, and leucovorin as first-line treatment for metastatic colorectal cancer: updated analysis of overall survival according to tumor KRAS and BRAF mutation status. Journal of clinical oncology: official journal of the American Society of Clinical Oncology. 2011;29(15):2011–9. doi: 10.1200/jco.2010.33.5091. [DOI] [PubMed] [Google Scholar]
- 16.Eisenhauer EA, Therasse P, Bogaerts J, Schwartz LH, Sargent D, Ford R, et al. New response evaluation criteria in solid tumours: revised RECIST guideline (version 1.1) European journal of cancer (Oxford, England: 1990) 2009;45(2):228–47. doi: 10.1016/j.ejca.2008.10.026. [DOI] [PubMed] [Google Scholar]
- 17.Sood A, McClain D, Maitra R, Basu-Mallick A, Seetharam R, Kaubisch A, et al. PTEN gene expression and mutations in the PIK3CA gene as predictors of clinical benefit to anti-epidermal growth factor receptor antibody therapy in patients with KRAS wild-type metastatic colorectal cancer. Clinical colorectal cancer. 2012;11(2):143–50. doi: 10.1016/j.clcc.2011.12.001. [DOI] [PMC free article] [PubMed] [Google Scholar]
- 18.Martini M, De Santis MC, Braccini L, Gulluni F, Hirsch E. PI3K/AKT signaling pathway and cancer: an updated review. Annals of medicine. 2014;46(6):372–83. doi: 10.3109/07853890.2014.912836. [DOI] [PubMed] [Google Scholar]
- 19.Dayem Ullah AZ, Lemoine NR, Chelala C. SNPnexus: a web server for functional annotation of novel and publicly known genetic variants (2012 update) Nucleic acids research. 2012;40:W65–70. doi: 10.1093/nar/gks364. Web Server issue. [DOI] [PMC free article] [PubMed] [Google Scholar]
- 20.Ng PC, Henikoff S. SIFT: Predicting amino acid changes that affect protein function. Nucleic acids research. 2003;31(13):3812–4. doi: 10.1093/nar/gkg509. [DOI] [PMC free article] [PubMed] [Google Scholar]
- 21.Kumar P, Henikoff S, Ng PC. Predicting the effects of coding non-synonymous variants on protein function using the SIFT algorithm. Nature protocols. 2009;4(7):1073–81. doi: 10.1038/nprot.2009.86. [DOI] [PubMed] [Google Scholar]
- 22.Reddy BV, Kaznessis YN. Use of secondary structural information and C alpha-C alpha distance restraints to model protein structures with MODELLER. Journal of biosciences. 2007;32(5):929–36. doi: 10.1007/s12038-007-0093-1. [DOI] [PubMed] [Google Scholar]
- 23.Furet P, Guagnano V, Fairhurst RA, Imbach-Weese P, Bruce I, Knapp M, et al. Discovery of NVP-BYL719 a potent and selective phosphatidylinositol-3 kinase alpha inhibitor selected for clinical evaluation. Bioorganic & medicinal chemistry letters. 2013;23(13):3741–8. doi: 10.1016/j.bmcl.2013.05.007. [DOI] [PubMed] [Google Scholar]
- 24.Brooks BR, Brooks CL, 3rd, Mackerell AD, Jr, Nilsson L, Petrella RJ, Roux B, et al. CHARMM: the biomolecular simulation program. Journal of computational chemistry. 2009;30(10):1545–614. doi: 10.1002/jcc.21287. [DOI] [PMC free article] [PubMed] [Google Scholar]
- 25.Liu T, Chen F, Tang N, Feng J, Zhao D, Wei K, et al. CD247 can bind SHC1, no matter if CD247 is phosphorylated. Journal of molecular recognition: JMR. 2009;22(3):205–14. doi: 10.1002/jmr.933. [DOI] [PubMed] [Google Scholar]
- 26.Hsin J, Arkhipov A, Yin Y, Stone JE, Schulten K. Using VMD: an introductory tutorial. Current protocols in bioinformatics. 2008 doi: 10.1002/0471250953.bi0507s24. Chapter 5: Unit 5.7. [DOI] [PMC free article] [PubMed] [Google Scholar]
- 27.Giannakis M, Mu XJ, Shukla SA, Qian ZR, Cohen O, Nishihara R, et al. Genomic Correlates of Immune-Cell Infiltrates in Colorectal Carcinoma. Cell reports. 2016 doi: 10.1016/j.celrep.2016.03.075. [DOI] [PMC free article] [PubMed] [Google Scholar]
- 28.Fecteau RE, Lutterbaugh J, Markowitz SD, Willis J, Guda K. GNAS mutations identify a set of right-sided, RAS mutant, villous colon cancers. PloS one. 2014;9(1):e87966. doi: 10.1371/journal.pone.0087966. [DOI] [PMC free article] [PubMed] [Google Scholar]
- 29.Leto SM, Trusolino L. Primary and acquired resistance to EGFR-targeted therapies in colorectal cancer: impact on future treatment strategies. Journal of molecular medicine (Berlin, Germany) 2014;92(7):709–22. doi: 10.1007/s00109-014-1161-2. [DOI] [PMC free article] [PubMed] [Google Scholar]
- 30.Bokemeyer C, Van Cutsem E, Rougier P, Ciardiello F, Heeger S, Schlichting M, et al. Addition of cetuximab to chemotherapy as first-line treatment for KRAS wild-type metastatic colorectal cancer: pooled analysis of the CRYSTAL and OPUS randomised clinical trials. European journal of cancer (Oxford, England: 1990) 2012;48(10):1466–75. doi: 10.1016/j.ejca.2012.02.057. [DOI] [PubMed] [Google Scholar]
- 31.Karapetis CS, Jonker D, Daneshmand M, Hanson JE, O’Callaghan CJ, Marginean C, et al. PIK3CA, BRAF, and PTEN status and benefit from cetuximab in the treatment of advanced colorectal cancer—results from NCIC CTG/AGITG CO.17. Clinical cancer research: an official journal of the American Association for Cancer Research. 2014;20(3):744–53. doi: 10.1158/1078-0432.ccr-13-0606. [DOI] [PubMed] [Google Scholar]
- 32.Sepulveda AR, Hamilton SR, Allegra CJ, Grody W, Cushman-Vokoun AM, Funkhouser WK, et al. Molecular Biomarkers for the Evaluation of Colorectal Cancer: Guideline From the American Society for Clinical Pathology, College of American Pathologists, Association for Molecular Pathology, and American Society of Clinical Oncology. The Journal of molecular diagnostics: JMD. 2017;19(2):187–225. doi: 10.1016/j.jmoldx.2016.11.001. [DOI] [PMC free article] [PubMed] [Google Scholar]
- 33.Mandelker D, Gabelli SB, Schmidt-Kittler O, Zhu J, Cheong I, Huang CH, et al. A frequent kinase domain mutation that changes the interaction between PI3Kalpha and the membrane. Proceedings of the National Academy of Sciences of the United States of America. 2009;106(40):16996–7001. doi: 10.1073/pnas.0908444106. [DOI] [PMC free article] [PubMed] [Google Scholar]
- 34.Zhang D, Aravind L. Identification of novel families and classification of the C2 domain superfamily elucidate the origin and evolution of membrane targeting activities in eukaryotes. Gene. 2010;469(1–2):18–30. doi: 10.1016/j.gene.2010.08.006. [DOI] [PMC free article] [PubMed] [Google Scholar]
- 35.Zhao L, Vogt PK. Helical domain and kinase domain mutations in p110alpha of phosphatidylinositol 3-kinase induce gain of function by different mechanisms. Proceedings of the National Academy of Sciences of the United States of America. 2008;105(7):2652–7. doi: 10.1073/pnas.0712169105. [DOI] [PMC free article] [PubMed] [Google Scholar]
- 36.Samuels Y, Wang Z, Bardelli A, Silliman N, Ptak J, Szabo S, et al. High frequency of mutations of the PIK3CA gene in human cancers. Science (New York, NY) 2004;304(5670):554. doi: 10.1126/science.1096502. [DOI] [PubMed] [Google Scholar]
- 37.Ogino S, Chan AT, Fuchs CS, Giovannucci E. Molecular pathological epidemiology of colorectal neoplasia: an emerging transdisciplinary and interdisciplinary field. Gut. 2011;60(3):397–411. doi: 10.1136/gut.2010.217182. [DOI] [PMC free article] [PubMed] [Google Scholar]
- 38.Colussi D, Brandi G, Bazzoli F, Ricciardiello L. Molecular pathways involved in colorectal cancer: implications for disease behavior and prevention. International journal of molecular sciences. 2013;14(8):16365–85. doi: 10.3390/ijms140816365. [DOI] [PMC free article] [PubMed] [Google Scholar]
- 39.Rescigno T, Micolucci L, Tecce MF, Capasso A. Bioactive Nutrients and Nutrigenomics in Age-Related Diseases. Molecules (Basel, Switzerland) 2017;22(1) doi: 10.3390/molecules22010105. [DOI] [PMC free article] [PubMed] [Google Scholar]
- 40.Kocarnik JM, Shiovitz S, Phipps AI. Molecular phenotypes of colorectal cancer and potential clinical applications. Gastroenterology report. 2015;3(4):269–76. doi: 10.1093/gastro/gov046. [DOI] [PMC free article] [PubMed] [Google Scholar]
- 41.Manceau G, Marisa L, Boige V, Duval A, Gaub MP, Milano G, et al. PIK3CA mutations predict recurrence in localized microsatellite stable colon cancer. Cancer medicine. 2015;4(3):371–82. doi: 10.1002/cam4.370. [DOI] [PMC free article] [PubMed] [Google Scholar]
- 42.Liao X, Lochhead P, Nishihara R, Morikawa T, Kuchiba A, Yamauchi M, et al. Aspirin use, tumor PIK3CA mutation, and colorectal-cancer survival. The New England journal of medicine. 2012;367(17):1596–606. doi: 10.1056/NEJMoa1207756. [DOI] [PMC free article] [PubMed] [Google Scholar]
- 43.Brule SY, Jonker DJ, Karapetis CS, O’Callaghan CJ, Moore MJ, Wong R, et al. Location of colon cancer (right-sided versus left-sided) as a prognostic factor and a predictor of benefit from cetuximab in NCIC CO.17. European journal of cancer (Oxford, England: 1990) 2015;51(11):1405–14. doi: 10.1016/j.ejca.2015.03.015. [DOI] [PubMed] [Google Scholar]
- 44.Inagaki D, Shiozawa M, Satoyoshi T, Atsumi Y, Murakawa M, Kazama K. Relationship between tumor location and oncogenes mutations (RAS, BRAF, and IK3CA) in colorectal cancer. J Clin Oncol. 2017;(suppl 4S) abstract 580. [Google Scholar]
- 45.Yamauchi M, Morikawa T, Kuchiba A, Imamura Y, Qian ZR, Nishihara R, et al. Assessment of colorectal cancer molecular features along bowel subsites challenges the conception of distinct dichotomy of proximal versus distal colorectum. Gut. 2012;61(6):847–54. doi: 10.1136/gutjnl-2011-300865. [DOI] [PMC free article] [PubMed] [Google Scholar]
- 46.Liao X, Morikawa T, Lochhead P, Imamura Y, Kuchiba A, Yamauchi M, et al. Prognostic role of PIK3CA mutation in colorectal cancer: cohort study and literature review. Clinical cancer research: an official journal of the American Association for Cancer Research. 2012;18(8):2257–68. doi: 10.1158/1078-0432.ccr-11-2410. [DOI] [PMC free article] [PubMed] [Google Scholar]
- 47.Rosty C, Young JP, Walsh MD, Clendenning M, Walters RJ, Pearson S, et al. Colorectal carcinomas with KRAS mutation are associated with distinctive morphological and molecular features. Modern pathology: an official journal of the United States and Canadian Academy of Pathology, Inc. 2013;26(6):825–34. doi: 10.1038/modpathol.2012.240. [DOI] [PubMed] [Google Scholar]
- 48.Rosty C, Young JP, Walsh MD, Clendenning M, Sanderson K, Walters RJ, et al. PIK3CA activating mutation in colorectal carcinoma: associations with molecular features and survival. PloS one. 2013;8(6):e65479. doi: 10.1371/journal.pone.0065479. [DOI] [PMC free article] [PubMed] [Google Scholar]
- 49.Castellano E, Sheridan C, Thin MZ, Nye E, Spencer-Dene B, Diefenbacher ME, et al. Requirement for interaction of PI3-kinase p110alpha with RAS in lung tumor maintenance. Cancer cell. 2013;24(5):617–30. doi: 10.1016/j.ccr.2013.09.012. [DOI] [PMC free article] [PubMed] [Google Scholar]
- 50.Maughan TS, Adams RA, Smith CG, Meade AM, Seymour MT, Wilson RH, et al. Addition of cetuximab to oxaliplatin-based first-line combination chemotherapy for treatment of advanced colorectal cancer: results of the randomised phase 3 MRC COIN trial. Lancet (London, England) 2011;377(9783):2103–14. doi: 10.1016/s0140-6736(11)60613-2. [DOI] [PMC free article] [PubMed] [Google Scholar]
Associated Data
This section collects any data citations, data availability statements, or supplementary materials included in this article.