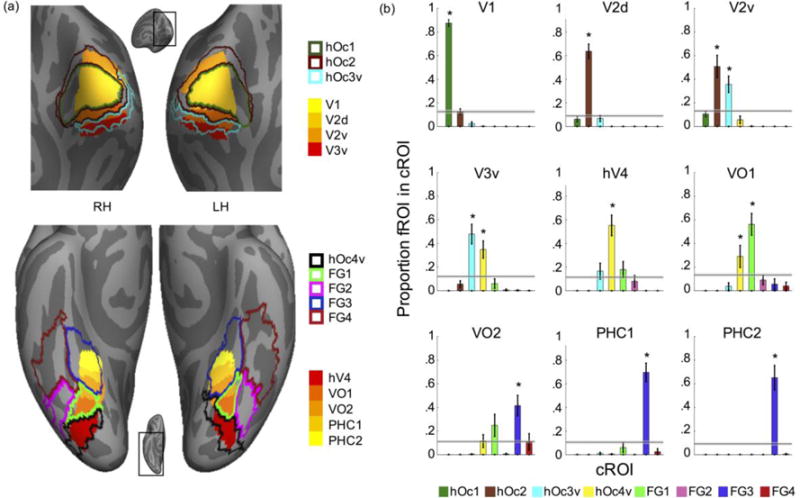
Figure 7. Coupling between cytoarchitectonic and retinotopic parcellations of the human occipito-temporal and ventral temporal cortex.

(a) Superposition of our cROI MPM atlas (Fig. 6) and the Wang (2014) retinotopic MPM atlas on the fsaverage brain. Top: Occipital view of the fsaverage brain, inset shows zoomed region of the brain displayed. Bottom: Ventral view of the fsaverage brain; Solid colors: retinotopic ROIs; Outlines: cROIs; (b) Quantification of correspondence between retinotopic ROIs and cROIs. Each graph shows the average overlap between an MPM of a retinotopic area and individual subject’s cROI. X-axis: cROIs, y-axis: proportion of retinotopic ROI contained in each cROI. Horizontal bars: Chance level with 95% confidence interval. Errorbars: Standard error across postmortem subjects. Asterisks indicate significant difference relative to chance (P<.01).
