Abstract
Purpose
Magnetic Resonance Electrical Impedance Tomography (MREIT) sequences typically use conventional spin or gradient echo-based acquisition methods for reconstruction of conductivity and current density maps. Use of MREIT in functional and electroporation studies requires higher temporal resolution and faster sequences. Here, single and multi-shot echo planar imaging (EPI) based MREIT sequences were evaluated to see if high quality MREIT phase data could be obtained for rapid reconstruction of current density, conductivity and electric fields.
Methods
A gel phantom with an insulating inclusion was used as a test object. Ghost artifact, geometric distortion and MREIT correction algorithms were applied to data. EPI-MREIT derived phase, projected current density and conductivity images were compared with simulations and spin echo images as a function of EPI shot number.
Results
Good agreement between measures in simulated, spin-echo and EPI data was achieved. Current density errors were stable and below 9% as shot number decreased from 64 to 2, but increased for single-shot images. Conductivity reconstruction relative contrast ratios were stable as shot number reduced. Derived electric fields also agreed with simulated data.
Conclusion
EPI methods can be successfully combined with MREIT reconstruction algorithms to achieve fast imaging of current density, conductivity and electric fields.
Keywords: MREIT, EPI, conductivity imaging, current density imaging, functional imaging
Introduction
Magnetic resonance electrical impedance tomography (MREIT) has developed over the last decade as a non-invasive method of imaging conductivity, current density and other electromagnetic field distributions within electrically conductive objects using externally injected currents (1). This work is progressively being translated in vivo and has been tested as a method for mapping current density and electric field distributions in the human head and knee (2,3) and for functional brain imaging (4).
MREIT data collection involves application of current to an object in synchrony with a candidate pulse sequence. The magnetic flux density created by current flow is encoded in MRI phase. Reconstructed conductivity image quality therefore depends on noise levels in the measured phase. This noise is inversely proportional to the total current injection time TC and the signal-to-noise ratio (SNR) in MR magnitude images (5,6). Spin echo and multi-echo spin echo-based sequences have been preferred in MREIT because of their high SNR and long possible current injection times (7). Spin echo sequences are generally preferred because of their relative insensitivity to magnetic field inhomogeneities, chemical shift artifacts and tissue susceptibility (8). For in vivo MREIT applications, it is essential to minimize scan duration while maintaining spatial resolution and contrast. Use of MREIT for functional imaging (fMREIT) ideally requires very short acquisition times (~ 1 s) to image transient neural activity-related conductivity changes. Use of MREIT to map electric fields formed during electroporation procedures requires similarly rapid imaging to capture the effects of large but possibly sparsely separated pulses (9,10).
Echo planar imaging (EPI) is one of the most efficient and fast MRI techniques. EPI is widely used in functional MRI studies, often in single-shot form. However, one serious drawback of EPI is its predisposition to artifacts, which can result in severe image distortions. While EPI-based sequences can drastically decrease scan time, acquisition of artifact-free EPI data is intrinsically challenging (11). A variety of system imperfections and physical phenomena (e.g. eddy currents, asymmetric anti-aliasing filter response, B0 inhomogeneity, chemical shift effect, mismatched gradient group delays, and hysteresis) can lead to Nyquist ghosts and geometrical distortions in EPI data. The Nyquist ghost observed in raw EPI reconstructions is the result of the time-reversal asymmetry between the even and odd echoes and is responsible for the reduction of signal-to-noise ratio and degradation of image quality in EPI acquisitions. Overall, these artifacts lead to inaccurate measurements of both magnitude and magnetic flux density data generated by current injections in MREIT images. Several methods to improve image quality by reducing the effect of ghost and geometrical distortion artifacts have been suggested (11–15) but have not been thoroughly tested in phase-based imaging techniques such as MREIT.
The purpose of this study was to determine the ability of spin echo single or multi-shot echo planar imaging (SE-EPI) techniques to obtain high quality images in anticipation of its use in functional magnetic resonance electrical impedance tomography (fMREIT) and electroporation studies. In this paper, the effects of EPI artifact correction on phase images using both single and multi-shot methods are considered, extending the work of Hamamura et al. (16). Further, effects of different artifact correction methods on reconstruction accuracy of relative and absolute conductivity, current density and electric fields are also determined.
Methods
Pulse Sequences
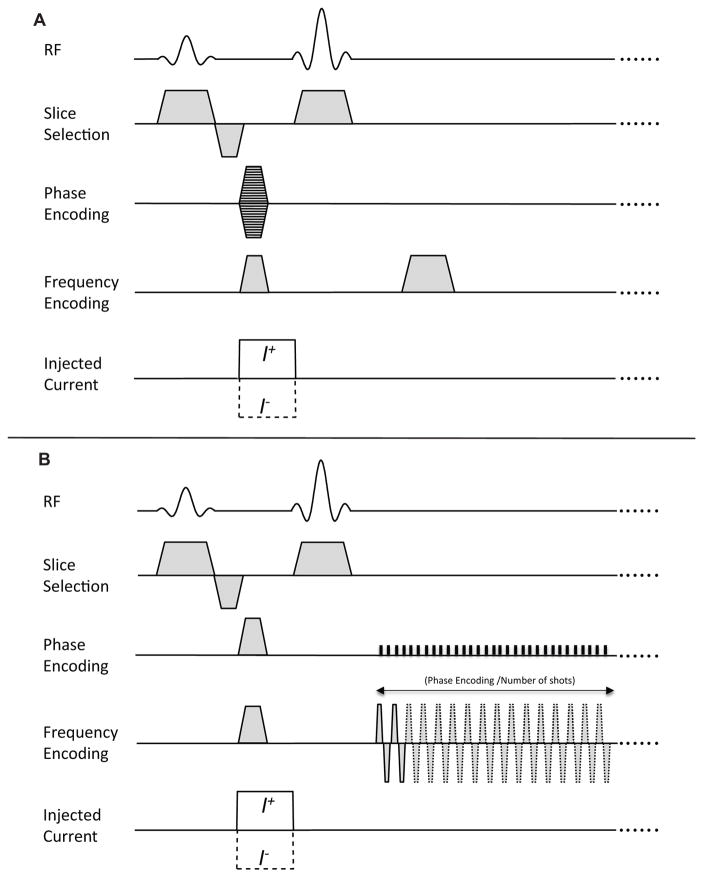
Imaging was performed using a 7T MRI system (Bruker Biospin MRI, Billerica, MA), located at the Barrow Neurological Institute, Phoenix, AZ, USA. The magnet had a 20cm bore diameter. A single channel Bruker RF volume coil with an internal diameter of 70 mm was used for all experiments. Pulse sequence diagrams used for MREIT using spin echo and multi-shot spin-echo EPI (MS SE-EPI) acquisitions are shown in Fig. 1. In this study, identical current injection protocols were used for standard SE-EPI and MS SE-EPI pulse sequences. Current injection was synchronized with the MR pulse sequence via spectrometer TTL control pulses. Unipolar current pulses were injected only after 90° RF-pulses for SE-EPI (Fig. 1A) and MS SE-EPI (Fig. 1B) pulse sequences, to prevent current-generated magnetic flux density from perturbing slice selection and distorting data sampling. Current was injected using a custom-designed MREIT constant current source (17) using 10 mA amplitude and 12 ms injection times (TC). For each electrode pair, data were collected once with positive current amplitude (I+) and once with an identical negative current (I−). Resulting phase data were subtracted from each other to remove systematic noise, recovering data representative of current flow alone. Scan parameters were: field of view (FOV) = 80×80 mm2, matrix size= 64×64, repetition time (TR)/echo time (TE) = 1000/24 ms, slice thickness= 4 mm without slice gaps, Average= 2, TC =12 ms, EPI segments (shots) = 1, 2, 4, 8, 16, and 32, and total scan times = 2, 4, 8, 16, 32 and 64 s, respectively. For comparison, spin echo data with FOV= 80×80 mm2, matrix size= 64×64, TR/TE = 1000/24 ms, Slice thickness = 4 mm (no slice gap), Average= 2, TC =12 ms, and total scan time = 128 s were also acquired. Volume shimming was performed before each data collection. In all cases MRI raw data from a single central object plane were acquired and compared.
Figure 1.
MR pulse sequences for MREIT based on (A) conventional spin echo, and (B) MS SE-EPI. Unipolar imaging currents (I±) were injected in the form of pulses whose timing was synchronized with the RF pulse.
For geometric correction, ten additional scans were performed for each MS SE-EPI acquisition type, using the same scan parameters, but with TE values ranging from 25.5–28.4 ms, with a TE spacing of 320 μs. The total time required for these additional scans was 20, 40, 80, 160, 320 and 640 s for 1-, 2-, 4-, 8-, 16-, and 32-shot ME SE-EPI, respectively. Each set of additional scans needed to be collected once before a sequence of EPI acquisitions. Results of simulated, SE-EPI and different corrected MS SE-EPI sequences were compared in terms of magnitude SNR, phase profile and reconstructed current density, conductivity and electric fields.
Phantom Preparation
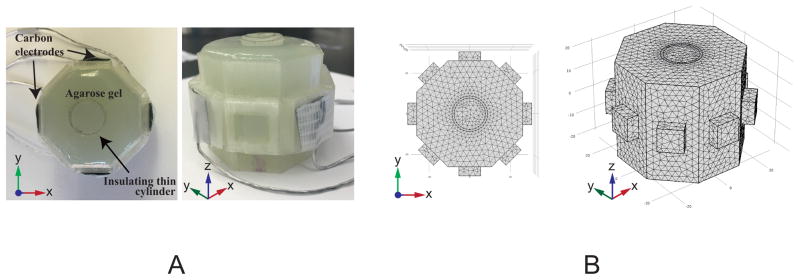
Imaging experiments were conducted on a conductivity phantom with a stable and predetermined conductivity distribution. The phantom had an octagonal shape, with a 20.5 mm edge length and 42 mm height, shown in Fig. 2A. The phantom was filled with a solid agarose gel (3 g/L NaCl, 40g/L Agarose, and 1 g/L CuSO4). A conductivity contrast was created by placing a thin hollow insulating cylindrical object at the center of the phantom. Four carbon-hydrogel electrodes (HUREV Co. Ltd, South Korea) were attached to the perimeter of the phantom, as shown in Fig. 2A. An impedance analyzer (4192A LF, Hewlett Packard, Palo Alto, CA) was used to measure the conductivity of the agarose gel, using a four probe method (18). The gel conductivity was measured to be 0.71 S/m. The measured T1 and T2 values of agarose gel were 750 ± 44 ms and 42 ± 3 ms, respectively. T1 values were comparable with those measured for white matter at 7 T (19).
Figure 2.
Physical and simulated phantom objects. (A) Experimental phantom: top and oblique views of the gel phantom, and (B) Three-dimensional finite-element model (FEM) mesh of the conductivity phantom (σ = 0.71 Sm−1) showing an insulating cylindrical inclusion placed in the middle of the phantom. Four carbon-hydrogel electrodes were attached on the perimeter of the octagonal surface to inject electric currents into the phantom.
Numerical simulation of current distribution and Bz data
A three-dimensional finite element model (FEM) approximating the phantom was constructed using COMSOL Multiphysics 5.0 (COMSOL Inc., Burlington, MA, USA). Fig. 2B shows the 72326 tetrahedral element FEM mesh, including the hollow cylindrical anomaly at the center. The voltage distribution u within the phantom domain Ω was solved using the Laplace equation
| [1] |
Where ∂Ω is the boundary of Ω, n is the outward normal vector on ∂Ω, g is the normal component of current density on ∂Ω, σ(r) is the conductivity distribution in Ω, and r = (x, y, z) is a position vector. A total current of approximately 10 mA was applied pairwise through opposite sets of electrodes by specifying the anode surface to pass a normal current density of 100 A/m2, and setting the cathode to be at ground potential.
The current density J in Ω was computed via
| [2] |
The z-component of the induced magnetic flux density Bz in Ω may be calculated via the Biot-Savart law
| [3] |
where μ0 = 4π × 10−7 Tm/A is the permeability of free space. Equations [1] and [2] were solved for u and J using COMSOL, and J values were exported to MATLAB (The Mathworks Inc., USA). A C++/MATLAB code was then used to compute Bz distributions using a fast Fourier transform implementation of [3]. Finely sampled synthetic Bz data were then coregistered to experimental data, averaged over regions corresponding to focal slice voxels and presented as a 64 × 64 matrix that could be directly compared with experimental MREIT data.
EPI Image correction
The techniques of Chen and Wyrwicz (15) and Chiou et al. (14) were used for ghost and geometric correction respectively. Details of each method are described in the sections below.
Ghost Correction
To correct Nyquist ghost artifacts, two reference scans were initially acquired with the phase-blipped reference EPI sequence reported by Hu and Le (20). A new k-space data regrouping protocol was used to map phase errors due to inconsistencies between odd-even EPI echoes (15). The calculated 2D phase map was used to remove Nyquist ghost artifacts in subsequently acquired EPI data.
Geometric Distortion correction
The long readout period in EPI sequences causes a narrow bandwidth per pixel in the phase encoding direction. This reduction in bandwidth exacerbates effects of off-resonance related factors such as field inhomogeneity and chemical shift effects, and thereby results in significant geometric distortions and phase errors. Phase errors, independent of readout and phase encoding gradients, cause pixel shifts proportional to local resonance offsets. These pixel shifts cause geometric distortion and non-uniformity in image intensity. In this study, a phase modulation factor was used to remove geometric distortions, as suggested by (14). The phase modulation factor was obtained experimentally by collecting (no current) EPI images with a spin-echo spacing, ΔTE, equal to the inter-echo time interval, Ti. Nine phase modulation factor maps were then produced by computing the ratio of pixels in consecutive image pairs of MS SE-EPI data, and averaged to improve the SNR of the phase map. Note that the combination of methods was applied to k-space and corrected both magnitude and phase data.
SNR Evaluations
To evaluate image quality before and after corrections, we used two approaches to calculate SNR in MR magnitude images. The first approach was a commonly used technique based on analysis of signal statistics in two separate regions of interest (ROIs) within a single image (one ROI in the phantom to determine average signal intensity MeanS, and one in the image background to measure the noise standard deviation sdair (21). The SNR computed from this method is
| [4] |
where the factor 0.655 arises due to the Rician distribution of the background noise in magnitude images.
An alternative SNR determination is the “difference method,” based on evaluation of difference image of two repeated (identical) acquisitions (21). In this method SNR is calculated using a single ROI, as the quotient of the mean of the sum of voxels from the two images (Meansum) and the standard deviation of the signal in the difference image (sddiff), divided by .
| [5] |
The factor of 1/√2 in [5] arises because sddiff is derived from the subtracted image.
Magnetic Flux density (Bz) Calculation
In each MREIT image, k-space data was collected twice, with two injection currents I± that had the same amplitude and duration, but opposite polarities. The raw data S± corresponding to I+ and I−, respectively, are described by
| [6] |
where M is the MR magnitude image, δ is a systematic phase artifact, γ is the gyromagnetic ratio of hydrogen, and Tc is the duration of the injected current. A discrete inverse Fourier transformation of the k-space data S±, was used to obtain the complex images
| [7] |
Finally, the Bz image induced by externally injected currents was determined by complex dividing data sets for positive and negative currents, removing the influence of systematic phase artifact distributions δ and doubling MREIT signal amplitude.
| [8] |
Since Bz(x, y) in [8] is wrapped due to branch cutting in the argument operator, Goldstein’s algorithm (22) was always applied for two-dimensional phase unwrapping, after EPI ghost and geometrical distortion corrections were performed.
Noise in measured Bz data
The noise standard deviation sdBz in measured Bz data is inversely proportional to SNR of MR magnitude images ψm and total current-injection time Tc (5,6)
| [9] |
The experimental noise standard deviation sBz in the measured Bz can be calculated using (6)
| [10] |
where Δ, and Δz are the distance between two consecutive pixels along x–y and z directions, respectively. Equation [10] was used to compare SE and EPI images at different correction levels.
Projected Current Density and Electric Field distributions
The projected current density (23,24) is a uniquely and stably determined component of the internal current density generated by the injected current that can be derived from the measured Bz data in conjunction with a uniform model of the imaged object. In the case of uniform and isotropic conductivity distributions, a projected electric field (EP) within the xy-plane can be calculated from projected current density (JP) data using Ohm’s law (25),
| [11] |
where σMREIT is the isotropic electric conductivity distribution of the object obtained using an MREIT conductivity reconstruction method. Two alternative methods of conductivity image reconstruction are described below.
Conductivity image reconstruction
Harmonic Bz algorithm
CoReHA 2.0 software (26), a single-step implementation of the harmonic Bz algorithm (27) was used to reconstruct relative conductivity distributions. The harmonic Bz algorithm estimates the conductivity distribution σ in a given slice by incorporating the harmonic relationship between the two-dimensional ∇σ and the Laplacian of Bz (1).
The noise level in measured Bz data or magnitude image SNR is the primary factor determining reconstructed conductivity image quality, as shown in (5,6). Because of the very low signal levels in the insulating cylindrical shell, Bz recovery in this region was unreliable. Therefore, harmonic in-painting of phase data (28) was implemented to replace data in this area. A ramp-preserving denoising preprocessing step (26,28,29) was also applied to the data to improve overall SNR. As implemented in CoReHA, the harmonic Bz algorithm is capable of producing only equivalent isotropic scaled conductivity images. It therefore provides only conductivity contrast images instead of absolute conductivity images.
Absolute conductivity (projected current density method)
Absolute conductivity images can be reconstructed via an intermediate step of estimating a projected current density JP distribution. In this study, absolute conductivity images were reconstructed from measured magnetic flux densities by applying the projected current density method, following Sajib et al. (30).
Current Density and Conductivity Reconstruction Error Analysis
A relative L2-error in reconstructed current density was defined as
| [12] |
where || · || represents L2-norm and Jt is the true current density.
To quantitatively analyze the conductivity images generated by harmonic Bz and absolute conductivity reconstructions, a relative conductivity contrast ratio (rCCR), defined as
| [13] |
was calculated, where σanomaly and σbackground represent mean reconstructed conductivity values in ROIs within anomaly and background regions respectively. A root mean square error (RMSE) measure was also used to calculate reconstructed EPI conductivity error with respect to spin echo images.
| [14] |
where n in [14] was the total number of pixels in a ROI covering the phantom body.
Results
Simulation results
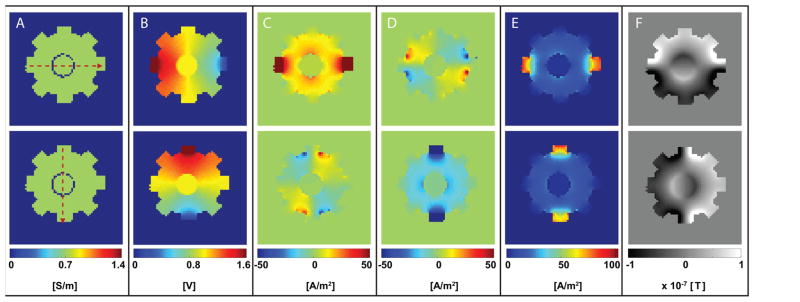
FEM model results are presented in Fig. 3. Distributions corresponding to simulated 10 mA horizontal and vertical current injections are shown in the top and bottom rows of Fig. 3, respectively. The COMSOL model phantom was solved with the bulk conductivity assigned to be 0.71 S/m, the same as measured in the agarose gel (σ, Fig. 3A). Resulting voltage distributions (u), and ‘true’ current densities ( , and Jt) are shown in Fig. 3B and, Fig. 3C–E respectively. Because of the phantom geometry, in-plane current magnitudes were 100 to 1000 times . Simulated magnetic flux densities ( , and , Fig. 3F) were calculated based on and data exported from COMSOL. Horizontal ( ), and vertical ( ) data were then used to generate projected current densities ( , and magnitude JP). Predicted Bz values were of the order of 100 nT. Maximal true and projected current densities were of the order of 100 A/m2. Electric field magnitudes around 140 V/m were predicted in electrode neighborhoods in each case. Synthetic magnetic flux densities ( and ) were used to reconstruct predicted conductivity distributions within the phantom using both relative and absolute methods for comparison with experimental data, as discussed below.
Figure 3.
Simulated phantom data produced using finite element model. Images corresponding to horizontal (I1) and vertical (I2) current injections are shown in top and bottom rows, respectively. From left to right, distributions of conductivity (A: σ), voltage (B: V), true current density (C: , D: , E: ), and magnetic flux density (F: ) in a central slice with a 10 mA current injection are shown.
Experimental results
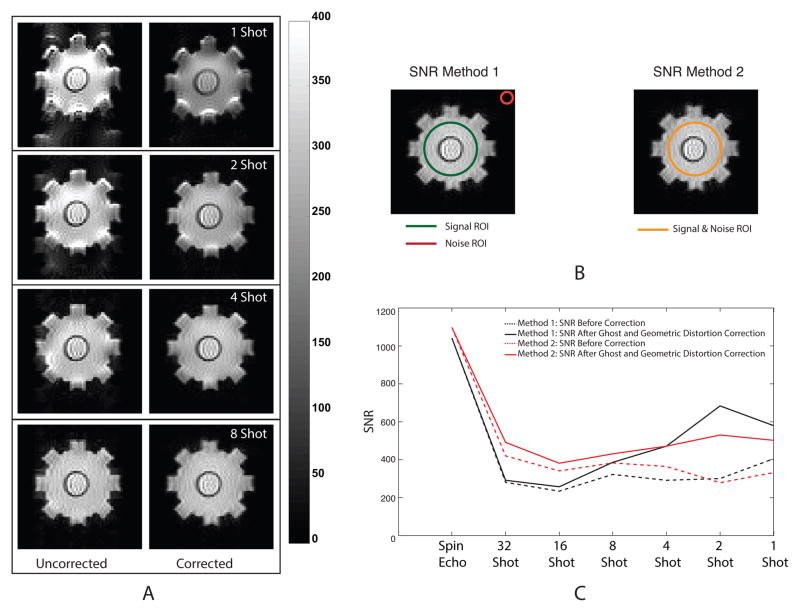
Fig. 4A shows raw uncorrected (left) and corrected (right) MR magnitude images of the phantom acquired using SE-EPI images. Ghost and geometrical distortion artifacts were most dominant in EPI images with fewer shots. These have been highlighted by showing only 1-, 2-, 4-, and 8-shot SE-EPI images in Fig. 4A. Large SNR improvements were observed in MS SE-EPI images after corrections (Fig. 4B). ROIs used in calculating SNR measures are shown in the inset of Fig. 4B. SNR values in SE images were of the order of 1000, and without correction in SE-EPI were around 250. Application of ghost and geometric distortion corrections improved low shot number images by factors of 2–3, with the maximum corrected image SNR of about 600 emerging in 2-shot data. Corrections had little effect on SNR of larger shot number EPI images, with 32-shot data unaffected by corrections. SNR1 values were always lower than SNR2 for SE and higher shot numbers. However, SNR1 was higher than SNR2 for 2- and 1- shot sequences. The differences between the measures most likely arose because of effects of shot number and corrections on ghost and systematic artifacts with respect to the noise statistics in the phantom and background ROIs used in SNR calculations.
Figure 4.
Magnitude images and SNR plots for multi-shot images. (A) MR magnitude images of the conductivity phantom before (left column) and after (right column) EPI image correction, (B) ROI for each SNR calculation method, and (C) Comparison of SNR in EPI acquisitions before and after EPI image correction for both methods.
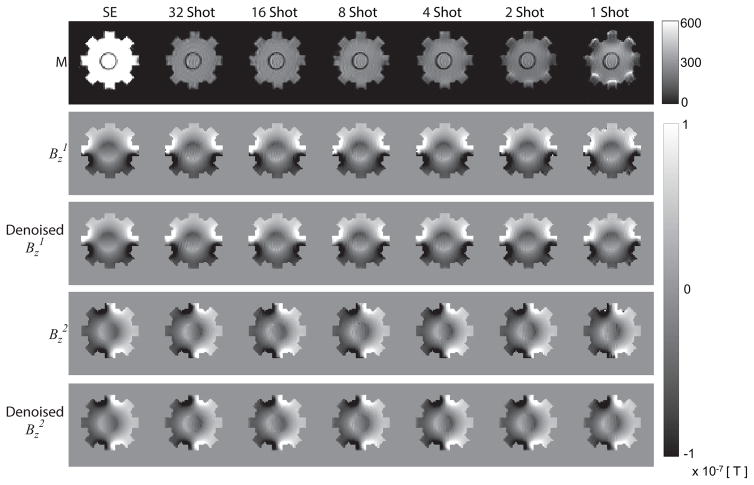
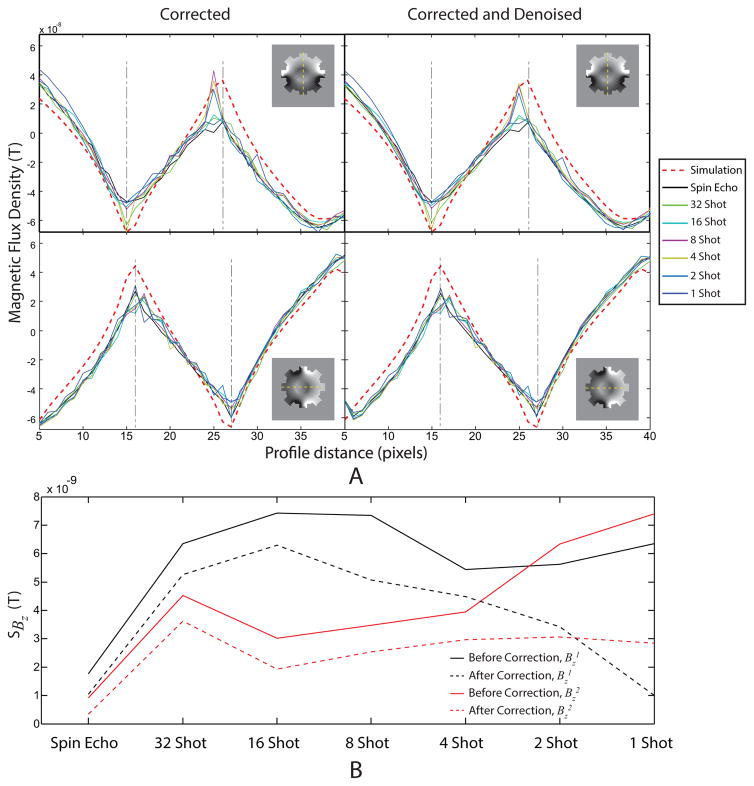
Experimental magnetic flux densities ( and ) were recovered from corrected complex MR data using [8] and denoised and in-painted. Fig. 5 shows (from top to bottom rows) (ghost and geometric) corrected MR magnitudes, corrected , corrected, denoised and in-painted , corrected and corrected, denoised and in-painted images in the spin-echo image (left column) as well as (left to right) MS SE-EPI (32-, 16-, 8-, 4-, 2-, and 1-shot) acquisitions, respectively. To more closely evaluate the effect of denoising, synthetic and experimental Bz data were also plotted on profiles through the center of the phantom, as shown in Fig. 6A. Bz profiles were broadly similar for all corrected and denoised data for all shot numbers. Simulated data are also shown in Fig. 6A. The scale of simulated and actual data agreed within about 10% of peak scale. Profile comparisons in Fig. 6A were worst near the boundary of the insulating object, likely due to susceptibility artifacts from changes in material properties or air inclusions.
Figure 5.
Magnitude and Bz data corresponding to different EPI acquisitions with different levels of correction. Experimental results from acquisitions (Left-Right: Spin Echo, 32-, 16-, 8-, 4-, 2-, and 1-shot SE-EPI) are shown as: Geometric and ghost-corrected (‘corrected’) MR magnitude images (first row), corrected (second row), corrected, denoised and in-painted (‘denoised’) (third row), corrected (fourth row) and corrected and denoised (fifth row).
Figure 6.
(A) Profiles of experimental Bz data in a slice through the center of the phantom before and after denoising and in-painting (‘denoising’). Data are shown before (left) and after (right) denoising for both horizontal (top) and vertical (bottom) 10 mA current injection. (B) Standard deviations in MREIT data calculated using [10] for (black) and (red) data both before (solid lines) and after (dashed lines) correction and denoising.
The standard deviation of noise in experimental Bz (sdBz) before and after correction, denoising and in-painting were calculated using [10] and are compared in Fig. 6B for each current direction. In spin echo Bz data, sdBz was around 1 nT, with values increasing to about 7 nT in 1-shot corrected data. Application of correction, denoising and in-painting to images reduced sdBz levels close to those for spin echo data in the case of horizontal current application ( ) data, and to around 3 nT for the vertical ( ) image.
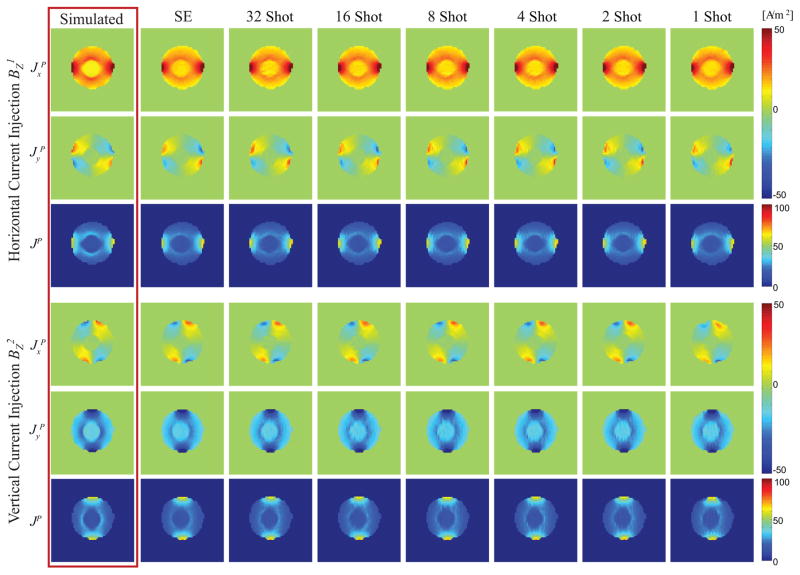
Projected current density components ( , and magnitude JP) for an ROI including the phantom body only were computed using both synthetic and corrected and denoised experimental magnetic flux densities acquired using both current directions (horizontal: ; vertical: ). Fig. 7 shows JP components of synthetic data, spin echo and MS SE-EPI (32-, 16-, 8-, 4-, 2-, and 1-shot) acquisitions, respectively. Simulated and measured data agreed well in terms of scale (with a discrepancy similar to that found in the Bz data shown in Fig. 5), although reconstructions of experimental current densities were affected by asymmetry in the physical phantom.
Figure 7.
Projected current density distributions ( , JP) established under horizontal (top panel) and vertical (bottom panel) current injections. Within each row (left to right), the projected current densities displayed were obtained from simulation, spin-echo, 32-, 16-, 8-, 4-, 2-, and 1-shot SE-EPI acquisitions respectively.
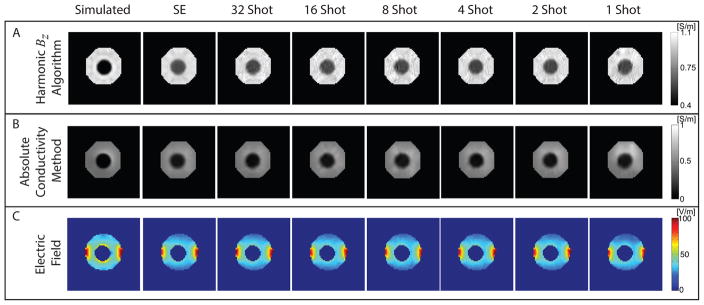
Finally, both harmonic Bz and absolute conductivity MREIT reconstruction algorithms were applied to corrected data. Reconstructed conductivity images for each method are shown in Fig. 8 with computed electric fields.
Figure 8.
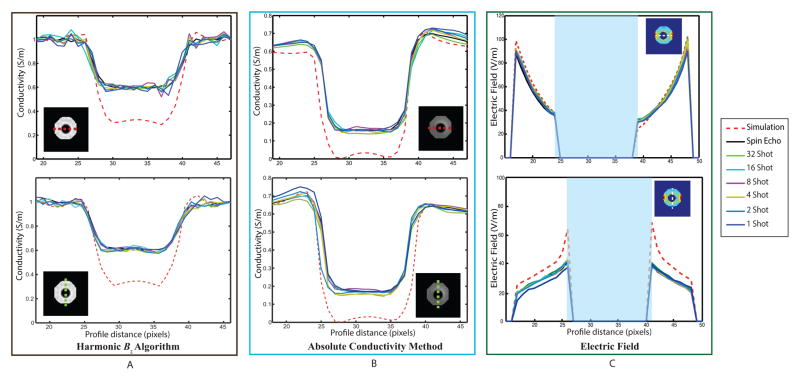
Conductivity and electric field distributions reconstructed from corrected and denoised Bz data. (A) Conductivity images reconstructed using the harmonic Bz algorithm, (B) conductivity images reconstructed using the absolute conductivity method, and (C) Projected electric field images calculated for horizontal current injections as a function of shot number. Electric field values inside the anomaly have been masked out.
The phantom consisted of an agarose background and an electrically insulating and low signal shell anomaly object that was filled with the same gel. Thus, while magnitude images of the phantom recovered images of agarose both within and without the shell, MREIT currents applied to the phantom ports only flowed in the background. This should lead to the reconstructed apparent conductivity of material within the shell being zero. Fig. 8A shows reconstructed conductivity images for the harmonic Bz method for synthetic and experimental Bz (L-R: Spin echo, 32-, 16-, 8-, 4-, 2-, and 1-shot SE-EPI). Reconstructed values of background and anomaly conductivities for this algorithm were approximately 1 and 0.6 S/m, respectively. Reconstructions produced using simulated data yielded better background and anomaly conductivities of 1 and 0.3 S/m respectively. A background conductivity of 1 S/m is encoded in the CoReHA 2.0 program, which seeks only to reconstruct conductivity contrast. Fig. 8B shows reconstructed absolute conductivity images. Absolute conductivity values for experimental data were found to be approximately 0.68 and 0.17 S/m, for background and anomaly conductivities respectively. These values were closer to the measured gel conductivity of 0.71 S/m and the predicted apparent anomaly conductivity of 0 S/m than found using CoReHA 2.0. Reconstructions of simulated data yielded background and anomaly conductivities of around 0.6 and 0.05 S/m respectively. Profiles through centers of reconstructed conductivity images for both harmonic Bz and absolute conductivity methods are plotted in Fig. 9A and 9B, respectively. Note that variability in absolute reconstructions across all shot numbers was smaller than that found using CoReHA, with almost identical results being recovered for all shot numbers. Fig. 8C shows projected electric field magnitudes (EP), useful in electroporation studies, computed using [9]. Electric field profile plots are shown in Fig. 9C. Because absolute conductivities in vertical profiles were overestimated (Figure 9B), possibly due to increased noise in the phase encoding direction, this resulted in vertical profile E values being underestimated via [9].
Figure 9.
Vertical and horizontal profile plots of reconstructions. (A) Harmonic Bz algorithm, (B) absolute conductivity method. (C) projected electric field for horizontal current injections. In (C) electric field values inside the anomaly have been masked out.
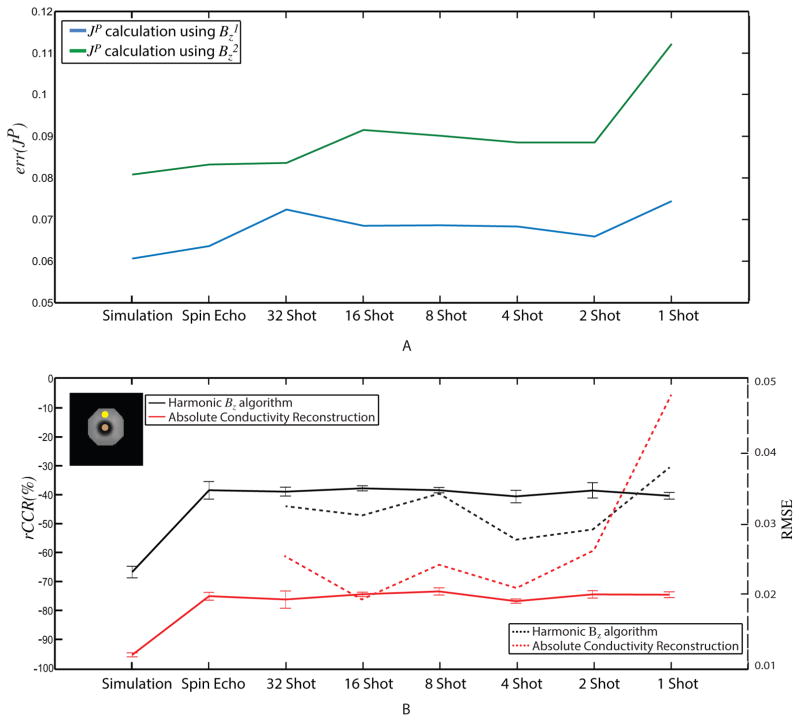
Reconstruction errors in projected current densities, relative, and absolute conductivities are summarized in Fig. 10. Relative L2-errors for derived projected current density are plotted for horizontal data (blue) and vertical data (green line), in Fig. 10A. Maximal errors of 0.11 for one shot data using horizontal ( ) current injection data and around 0.075 for the same settings with vertical current injection were observed. Fig. 10B shows rCCR values for both reconstruction methods, with ROIs used in calculating rCCR mean and standard deviations shown in the inset. Ideally, rCCR should be −100%, since MREIT conductivity contrast inside the anomaly region should be zero. Experimental rCCR values of reconstructed conductivity images using the Harmonic Bz algorithm were close to −40%, while absolute conductivity reconstructions showed excellent contrast ratios close to −80%. MS-EPI to SE RMSE comparisons are also shown in Fig. 10B. Because RMSE values were calculated over the entire phantom, these values were dominated by large discrepancies at the non-conducting anomaly boundary, particularly for low shot numbers.
Figure 10.
Errors in projected current density and conductivity as a function of shot number. (A) L2 error in recovered JP from horizontal (blue) and vertical (green) currents. (B) The relative conductivity contrast ratio (rCCR) in Harmonic Bz (black) and Absolute conductivity reconstructions (red) are shown on the left vertical axis. Calculated conductivity RMSE plots are shown on the right vertical axis. ROIs used in computing mean and standard deviations in rCCR measures are shown in the inset image (top left).
Discussion
Overall, the greatest improvements in magnitude image SNR after ghost and geometric distortion corrections were achieved in 1- and 2-shot data, as expected (31). This correlated with decreases in sdBz achieved after these corrections. Some susceptibility artifacts caused by external ports on the phantom remained. Application of denoising and harmonic in-painting to corrected Bz data produced modest improvements in image quality. Excellent agreement was observed in reconstructions of projected current density and conductivity in low-number-shot EPI data compared with ‘gold standard’ SE results. Projected current densities were in error by at most around 10%, and absolute conductivity reconstructions were more faithful (producing up to 80% of the actual contrast) than relative CoReHA reconstructions, where only around 40% of actual contrast was recovered. While JP reconstructions showed increases in relative L2-error as shot number decreased, maximal overall errors in one shot images were only 5% larger than those gathered using SE sequences. Ultimately, rCCR errors in conductivity reconstruction algorithms were similar whether imaging time was 128 s (spin echo) or 2 s (1-shot). RMSE values were more affected by susceptibility errors near the anomaly boundary (Figure 10B).
Different noise levels in Bz data were observed depending on the direction of current flow, probably due to differences in effective bandwidth in phase and frequency encoding directions. In Fig. 5, sdBz in corrected and denoised Bz data calculated via [10] was generally higher for than for . However, JP errors were lower for data than for , possibly indicating estimations from [10] were not fully reflective of data quality. Overall, L2 errors in JP reconstructions did not correlate with sdBz values found using [10]. This correspondence may be further explored by measuring sdBz as current amplitudes are varied. In this method, in contrast to (16), current was only injected in one portion of the current sequence, directly after the initial RF pulse. This was because of the short time between refocusing pulses and encoding gradients.
While sdBz depends inversely on Tc (6), Bz data quality also depends on current amplitude. Therefore, this method should be well-suited to fast imaging of electroporation-related processes, since electroporation current amplitudes are very high and standard deviations would be much smaller than overall signal sizes, even with very small Tc. However, we note that algorithm performance may be different at current amplitudes causing multiple phase turns. While phase unwrapping was applied to all data acquired here, we have not tested the method in circumstances (e.g. corresponding to higher injected currents) where multiple phase unwrapping of data would be required. In general cases where sdBz is a concern, a possible extension of this technique would be to increase Tc by also injecting current during read gradients, as suggested in Park et al. (32).
The 2- and 1-shot SE-EPI sequences introduced here may be useful for functional magnetic resonance electrical impedance tomography (fMREIT, (4)), which requires high temporal resolution. This work shows that ghost and geometrical distortion corrections can be used to produce good quality MREIT phase data while avoiding typical drawbacks of EPI sequences. These corrections require additional pre-interventional scans, but do not require modification of basic pulse sequences.
The methods used here may be compared with those of Serša (33) and Yan et al. (34) for applications in fast current density imaging. The method of (33) requires sequence modification, and if the sample to be imaged is asymmetric it must be rotated to collect all data, which is problematic for biological samples. There was also a problem with instability at initial phases of transverse magnetization, which is not an issue for EPI-based sequences. EPI-based sequences used here also have lower specific absorption rate (SAR) over the method suggested by (33).
The method for RF-CDI introduced in Yan et al. (34) also required sequence modification, and may not result in as direct a reduction in imaging time as the one implemented here. Reconstruction was also more involved in (34) than for this EPI-based method. In Lee et al. (35), SNR or SNR per unit time measures were considered. Because the SNR measures, imaging techniques and imaging times are so different, it would be difficult to directly compare these measures between this technique and (35). However, SNR per time quantities may be useful in comparing different shot number data within the framework used here.
In this study, currents were applied perpendicular to the main magnetic field, which meant that there was only small current flow out of the focal plane. Consequently, Bz images contained almost complete information about current flow. Isotropic reconstructions used here would produce less faithful results where contributions from Jz were significant. At low frequencies, white matter and skeletal muscle exhibit anisotropic conductivity. Alternative approaches such as DT-MREIT could be also be used with these data to reconstruct anisotropic conductivity distributions and current densities in tissue (36) to further evaluate these methods.
Finally, the results demonstrated here relate to a single, small diameter (~ 50 mm) phantom. If implemented in humans at typical field strengths the FOV would be at least four times this size in neuroimaging, or a factor of eight or more for abdominal imaging. There should be little difference in the overall performance of the method if phase encoding step number (PE) is constant. If PE increased, it is anticipated slight decreases in reconstruction quality may result from increases in timing uncertainty. Because phase changes caused by injected current are independent of B0, phase amplitudes will be similar if experiments are repeated at lower fields typical of clinical scanners. However, sdBz will increase at identical resolution for lower fields since magnitude SNR decreases with B0 (6). Use of larger voxels with larger objects, lower current amplitudes or lower B0 is therefore indicated to maintain data quality. However, it is anticipated that susceptibility effects would be reduced at lower B0. Robustness of this technique should be evaluated in the future using an FBIRN-like phantom and methods (37).
Conclusion
These results indicate MREIT images can be acquired fast and with reasonable image quality using the correction techniques implemented in this work. Reconstructed JP and conductivity data quality were maintained in multi-shot and single-shot EPI techniques compared to SE. It should therefore be possible to adapt MREIT EPI imaging strategies to specific fast imaging requirements.
In fMREIT and electroporation studies, long wire-like electrodes are implanted in the imaged object. This may lead to different susceptibility and current flow patterns, which may necessitate augmentation to the methods used here. In future work these techniques will be tested using implanted wire MREIT injection strategies and anisotropic reconstruction methods.
Acknowledgments
Research reported in this publication was supported by the National Institute of Neurological Disorders and Stroke of the National Institutes of Health under Award Number R01NS077004 to RJS.
References
- 1.Woo EJ, Seo JK. Magnetic resonance electrical impedance tomography (MREIT) for high-resolution conductivity imaging. Physiological Measurement. 2008;29:R1–R26. doi: 10.1088/0967-3334/29/10/R01. [DOI] [PubMed] [Google Scholar]
- 2.Meng Z, Sajib SZK, Chauhan M, Jeong WC, Kim YT, Kim HJ, JWE Improved conductivity image of human lower extremity using MREIT with chemical shift artifact correction. Biomedical Engineering Letters. 2011;2:62–68. [Google Scholar]
- 3.Kasinadhuni AK, Chauhan M, Indahlastari A, Anderson C, Carney P, Mareci TH, Sadleir RJ. Mapping magnetic fields due to electrical stimulation in the human brain: First Measurements. Vol. 2016. Singapore: International Society for Magnetic Resonance in Medicine; 2016. May 7–13, pp. 1–4. [Google Scholar]
- 4.Sadleir RJ, Grant SC, Woo EJ. Can high-field MREIT be used to directly detect neural activity? Theoretical Considerations Neuro Image. 2010;52(1):205–216. doi: 10.1016/j.neuroimage.2010.04.005. [DOI] [PMC free article] [PubMed] [Google Scholar]
- 5.Scott GC, Joy MLG, Armstrong RL, Henkelman RM. Sensitivity of magnetic-resonance current-density imaging. Journal of Magnetic Resonance. 1992;97:235–254. [Google Scholar]
- 6.Sadleir RJ, Grant S, Zhang SU, Lee BI, Pyo HC, Oh SH, Park C, Woo EJ, Lee SY, Kwon O, Seo JK. Noise analysis in magnetic resonance electrical impedance tomography at 3 and 11T field strengths. Physiological Measurement. 2005;26:875–884. doi: 10.1088/0967-3334/26/5/023. [DOI] [PubMed] [Google Scholar]
- 7.Minhas A, Jeong WC, Kim YT, Han Y, Kim HJ, Woo EJ. Experimental performance evaluation of multi-echo ICNE pulse sequence in magnetic resonance electrical impedance tomography. Magnetic Resonance in Medicine. 2011;66:957–965. doi: 10.1002/mrm.22872. [DOI] [PubMed] [Google Scholar]
- 8.Bernstein MA, King KF, Zhou XJ. Handbook of MRI Pulse Sequences. Academic Press; 2004. [Google Scholar]
- 9.Kranjc M, Bajd F, Sersa I, Miklavcic D. Magnetic resonance electrical impedance tomography for monitoring electric field distribution during tissue electroporation. IEEE Transactions on Medical Imaging. 2011;30(10):1771–1777. doi: 10.1109/TMI.2011.2147328. [DOI] [PubMed] [Google Scholar]
- 10.Kranjc M, Markelc B, Bajd F, Caemazar M, Sersa I, Blagus T, Miklavcic D. In situ monitoring of electric field distribution in mouse tumor during electroporation. Radiology. 2015;274(1):115–123. doi: 10.1148/radiol.14140311. [DOI] [PubMed] [Google Scholar]
- 11.Yang QX, Posse S, Le Bihan D, Smith MB. Double-sampled echo-planar imaging at 3 Tesla. Journal of Magnetic Resonance, Series B. 1996;113:145–150. doi: 10.1006/jmrb.1996.0167. [DOI] [PubMed] [Google Scholar]
- 12.Buonocore MH, Gao L. Ghost artifact reduction for echo planar imaging using image phase correction. Magnetic Resonance in Medicine. 1997;38:89–100. doi: 10.1002/mrm.1910380114. [DOI] [PubMed] [Google Scholar]
- 13.Wan X, Gullberg GT, Parker DL, Zeng GL. Reduction of geometric and intensity distortions in echo-planar imaging using a multireference scan. Magnetic Resonance in Medicine. 1997;37:932–944. doi: 10.1002/mrm.1910370619. [DOI] [PubMed] [Google Scholar]
- 14.Chiou J-Y, Ahn CB, Muftuler LT, Nalcioglu O. A simple simultaneous geometric and intensity correction method for echo-planar imaging by EPI-based phase modulation. IEEE Transactions on Medical Imaging. 2003;22(7):200–205. doi: 10.1109/TMI.2002.808362. [DOI] [PubMed] [Google Scholar]
- 15.Chen N-K, Wyrwicz AM. Removal of EPI Nyquist ghost artifacts with two-dimensional phase correction. Magnetic Resonance in Medicine. 2004;51:1247–1253. doi: 10.1002/mrm.20097. [DOI] [PubMed] [Google Scholar]
- 16.Hamamura MJ, Muftuler LT. Fast imaging for magnetic resonance electrical impedance tomography. Magnetic Resonance Imaging. 2008;26(6):739–745. doi: 10.1016/j.mri.2008.01.031. [DOI] [PMC free article] [PubMed] [Google Scholar]
- 17.Oh TI, Cho Y, Hwang YK, Oh SH, Woo EJ, Lee SY. Improved current source design to measure induced magnetic flux density distributions in MREIT. Journal of Biomedical Engineering Research. 2006;27:30–37. [Google Scholar]
- 18.Grimnes S, Martinsen OG. Bioimpedance & Bioelectricity Basics. London, San Diego: Academic Press; 2000. p. 359. [Google Scholar]
- 19.Rooney WD, Johnson G, Li X, Cohen ER, Kim SG, Ugurbil K, Springer CS. Magnetic field and tissue dependencies of human brain longitudinal 1H2O relaxation in vivo. Magnetic Resonance in Medicine. 2007;57(2):308–318. doi: 10.1002/mrm.21122. [DOI] [PubMed] [Google Scholar]
- 20.Hu XP, Le TH. Artifact reduction in EPI with phase-encoded reference scan. Magnetic Resonance in Medicine. 1996;36(1):166–171. doi: 10.1002/mrm.1910360126. [DOI] [PubMed] [Google Scholar]
- 21.Dietrich O, Raya JG, Reeder SB, Reiser MF, Schoenberg SO. Measurement of signal-to-noise ratios in MR images: Influence of multichannel coils, parallel imaging, and reconstruction filters. Journal of Magnetic Resonance Imaging. 2007;26(2):375–385. doi: 10.1002/jmri.20969. [DOI] [PubMed] [Google Scholar]
- 22.Ghiglia DC, Pritt MD. Two-Dimensional Phase Unwrapping: Theory, Algorithms and Software. New York: Wiley-Interscience; 1998. [Google Scholar]
- 23.Nam HS, Kwon O. Non-iterative conductivity reconstruction algorithm using projected current density in MREIT. Phys Med Biol. 2008;53:6947–6961. doi: 10.1088/0031-9155/53/23/019. [DOI] [PubMed] [Google Scholar]
- 24.Kim HJ, Sajib SZK, Jeong WC, Kim MN, Kwon O, JWE Analysis of local projected current density from one component of magnetic flux density in MREIT. Inverse Problems. 2013;29:1–17. [Google Scholar]
- 25.Kranjc M, Bajd F, Sersa I, Woo EJ, Miklavcic D. Ex Vivo and In Silico Feasibility Study of Monitoring Electric Field Distribution in Tissue during Electroporation Based Treatments. Plos One. 2012;7(9) doi: 10.1371/journal.pone.0045737. [DOI] [PMC free article] [PubMed] [Google Scholar]
- 26.Jeon K, Lee C-O. CoReHA 2.0: A Software Package for In Vivo MREIT Experiments. Computational and Mathematical Methods in Medicine. 2013:941745. doi: 10.1155/2013/941745. [DOI] [PMC free article] [PubMed] [Google Scholar]
- 27.Seo JK, Yoon JR, Woo EJ, Kwon O. Reconstruction of conductivity and current density images using only one component of magnetic field measurements. IEEE Transactions on Biomedical Engineering. 2003;50:1121–1124. doi: 10.1109/TBME.2003.816080. [DOI] [PubMed] [Google Scholar]
- 28.Jeon K, Kim HJ, Lee C-O, Seo JK, JWE Integration of the denoising, inpainting and local harmonic Bz algorithm for MREIT imaging of intact animals. Physics in medicine and biology. 2010;55(24):7451–7556. doi: 10.1088/0031-9155/55/24/010. [DOI] [PubMed] [Google Scholar]
- 29.Lee BI, Lee SH, Kim T-S, Kwon O, Woo EJ, Seo JK. Harmonic decomposition in PDE-based denoising technique for magnetic resonance electrical impedance tomography. IEEE Transactions on Biomedical Engineering. 2005;52:1912–1920. doi: 10.1109/TBME.2005.856258. [DOI] [PubMed] [Google Scholar]
- 30.Sajib SZK, Kim HJ, Kwon OI, Woo EJ. Regional absolute conductivity reconstruction using projected current density in MREIT. Physics in Medicine and Biology. 2012;57(18):5841. doi: 10.1088/0031-9155/57/18/5841. [DOI] [PubMed] [Google Scholar]
- 31.Poustchi-Amin M, Mirowitz SA, Brown JJ, McKinstry RC, Li T. Principles and applications of echo-planar imaging: a review for the general radiologist. Radiographics. 2001;21:767–779. doi: 10.1148/radiographics.21.3.g01ma23767. [DOI] [PubMed] [Google Scholar]
- 32.Park C, Lee BI, Kwon O, Woo EJ. Measurement of induced magnetic flux density using injection current nonlinear encoding (ICNE) in MREIT. Physiological Measurement. 2007;28:117–127. doi: 10.1088/0967-3334/28/2/001. [DOI] [PubMed] [Google Scholar]
- 33.Serša I. Auxiliary phase encoding in multi spin-echo sequences: application to rapid current density imaging. Journal of Magnetic Resonance. 2008;190:86–94. doi: 10.1016/j.jmr.2007.10.009. [DOI] [PubMed] [Google Scholar]
- 34.Yan R, Yoon RS, Joy MLG. Fast current density imaging with spiral acquisition. Vancouver, British Columbia, Canada: ISMRM; 1997. p. 1815. [Google Scholar]
- 35.Lee H, Sohn C-H, Park J. Current-induced alternating reversed dual-echo-steady-state for joint estimation of tissue relaxation and electrical properties. Magnetic Resonance in Medicine. 2016:14. doi: 10.1002/mrm.26350. preprint. [DOI] [PubMed] [Google Scholar]
- 36.Kwon OI, Jeong WC, Sajib SZK, Kim HJ, Woo EJ. Anisotropic conductivity tensor imaging in MREIT using directional diffusion rate of water molecules. Physics in Medicine and Biology. 2014;59(12):2955. doi: 10.1088/0031-9155/59/12/2955. [DOI] [PubMed] [Google Scholar]
- 37.Glover GH, Mueller BA, Turner JA, van Erp TGM, Liu TT, Greve DN, Voyvodic JT, Rasmussen J, Brown GG, Keator DB, Calhoun VD, Lee HJ, Ford JM, Mathalon DH, Diaz M, O’Leary DS, Gadde S, Preda A, Lim KO, Wible CG, Stern HS, Belger A, McCarthy G, Ozyurt B, Potkin SG. Function biomedical informatics research network recommendations for prospective multicenter functional MRI studies. Journal of Magnetic Resonance Imaging. 2012;36(1):39–54. doi: 10.1002/jmri.23572. [DOI] [PMC free article] [PubMed] [Google Scholar]


