Abstract
The implementation and evaluation of malaria control programs would be greatly facilitated by new tools for the rapid assessment of malaria transmission intensity. Because acquisition and maintenance of antimalarial antibodies depend on exposure to malaria infection, such antibodies might be used as proxy measures of transmission intensity. We have compared the prevalence of IgG antibodies with three Plasmodium falciparum asexual stage antigens in individuals of all ages living at varying altitudes encompassing a range of transmission intensities from hyper- to hypoendemic in northeastern Tanzania, with alternative measures of transmission intensity. The prevalence of antibodies to merozoite surface protein-119 was significantly more closely correlated with altitude than either point-prevalence malaria parasitemia or single measures of hemoglobin concentration. Analysis of age-specific seroprevalence rates enabled differentiation of recent (seasonal) changes in transmission intensity from longer-term transmission trends and, using a mathematical model of the annual rate of seroconversion, estimation of the longevity of the antibody response. Thus, serological tools allow us to detect variations in malaria transmission over time. Such tools will be invaluable for monitoring trends in malaria endemicity and the effectiveness of malaria control programs.
Keywords: antibody, Plasmodium falciparum, transmission intensity, altitude
Malaria, especially Plasmodium falciparum, is a major cause of human morbidity and mortality in Africa but varies greatly in endemicity across the continent with consequent variation in levels of immunity and age-specific patterns of disease (1) and differing priorities for malaria control activities. Direct (i.e., entomological) measures of transmission intensity are expensive, time-consuming, and imprecise because of microheterogeneity of malaria transmission (2), especially in areas of low transmission. Proxy measures, such as climate-based models, have been shown to provide a good fit to empirical data at the regional or country level (3) but are generally less suited to making predictions of malaria endemicity at the level of individual communities (4). However, one-off estimates of parasite prevalence can also be misleading indicators of long-term transmission potential, because prevalence may vary markedly with season. For example, we have previously observed significant associations among malariometric parameters, altitude, and recent rainfall, but the absolute correlation between age-adjusted parasite prevalence (or mean hemoglobin concentration) and altitude was poor, with considerable variation among villages situated at similar altitudes (5). Serological parameters offer a theoretical advantage over parasite prevalence as a measure of endemicity, in that antibodies can persist for months or years after infection, thereby smoothing out the effects of seasonal or unstable malaria transmission. Serological markers have been suggested as indicators of malaria transmission dynamics (6), and age-adjusted rates of acquisition of immune responses have been used to estimate force of infection (7), suggesting that immunological markers might provide a tool for rapid assessment of malaria transmission intensity. However, inappropriate serological markers might underestimate exposure because of lack of sensitivity, especially in infants (8), or a tendency to saturate at low-moderate transmission. We have, therefore, evaluated the utility of age-specific prevalences of antibodies to various malaria antigens for exploration of trends in malaria endemicity in northeastern Tanzania, where altitude has been evaluated as a proxy for transmission intensity (which varies from hypo- to hyperendemic over short distances) (5). We conclude that seroprevalence reflects cumulative exposure over time and can, in combination with parasite prevalence data, be used to infer changes in malaria transmission over time.
Methods
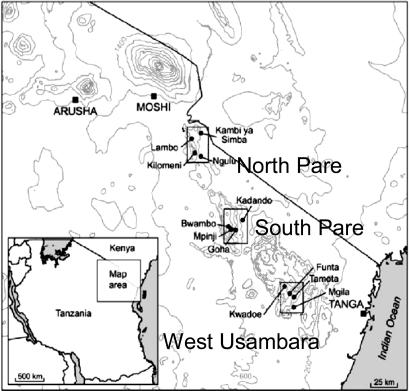
Study Site. Serum samples, collected during two age-stratified randomized cross-sectional surveys of 250 people in each of 12 villages, arranged in three altitude transects in the North Pare, South Pare, and Western Usambara mountains of northeastern Tanzania (Fig. 1 and Table 1), were analyzed. The study design and epidemiology of malaria in this area have been described in detail elsewhere (5). Parasite prevalence is consistent with entomological inoculation rates (EIR) of less than one infected bite per person per year (ib/p/yr) in the highest-altitude villages (>1,600 m) to ≈100 ib/p/yr in low-altitude villages (<300 m) closest to the coast; clinical, socioeconomic, and malariometric data were also recorded (5). Ethical approval was obtained from the institutional review boards of the National Institute of Medical Research of Tanzania, Kilimanjaro Christian Medical Centre, and the London School of Hygiene and Tropical Medicine.
Fig. 1.
Map of the study area showing the three altitude transects and 12 study villages.
Table 1. Characteristics of the 12 study villages.
| Altitude, m
|
Ethnic origin, %
|
Total n
|
||||
|---|---|---|---|---|---|---|
| Transect | Village | Wapare | Wasambaa | Other | ||
| North Pare | Ki | 1,556 | 97.7 | 0.3 | 2.0 | 399 |
| La | 1,188 | 96.1 | 0.6 | 3.3 | 362 | |
| Ng | 832 | 93.0 | 1.7 | 5.3 | 474 | |
| KyS | 746 | 76.1 | 0.6 | 23.3 | 497 | |
| South Pare | Bw | 1,598 | 98.6 | 0.0 | 1.4 | 505 |
| Mp | 1,445 | 95.4 | 1.2 | 3.4 | 499 | |
| Go | 1,163 | 94.9 | 3.7 | 1.4 | 491 | |
| Ka | 528 | 71.9 | 18.0 | 10.2 | 501 | |
| West Usambara | Kw | 1,564 | 1.2 | 94.6 | 4.2 | 501 |
| Fu | 1,240 | 0.4 | 97.2 | 2.4 | 500 | |
| Ta | 1,055 | 2.2 | 94.0 | 3.8 | 500 | |
| Mg | 375 | 8.2 | 68.9 | 22.9 | 546 | |
| Total | 59.2 | 33.5 | 7.3 | 5,775 | ||
The villages were as follows. North Pare transect: Kilomeni (Ki), Lambo (La), Ngulu (Ng), and Kambi ya Simba (KyS); South Pare transect: Bwambo (Bw), Mpinji (Mp), Goha (Go), and Kadando (Ka); West Usambara transect: Kwadoe (Kw), Funta (Fu), Tamota (Ta), and Mgila (Mg).
Laboratory Methods. IgG antibodies were detected by indirect ELISA, as described (9), by using recombinant blood-stage malaria antigens MSP-119 (Wellcome genotype), MSP-2 (3D7), and AMA-1 (3D7), which were produced as described (10–12). Sera were tested at a single dilution (1:1,000), which had been confirmed in pilot experiments to generate accurate antibody prevalences and to give information comparable to end-point titrations (data not shown, but provided for review as Fig. 7, which is published as supporting information on the PNAS web site). The binding of antibodies in serum from 37 Europeans never exposed to malaria was used to define a cutoff (mean OD + 3 SD) for positive and negative responses to each antigen.
Data Analysis. Results are reported as seroprevalence (i.e., the proportion of individuals whose serum gave an ELISA value above the normal range for serum from nonexposed European individuals). Reversible catalytic conversion models using the mean annual rate of conversion to seropositive, λ, and the mean annual rate of reversion from seropositive to seronegative, ρ (13, 14), were fitted by using standard maximum likelihood and assuming a binomial error distribution (15).
The equation fitted was of the form
 |
for each village, where Pt is the proportion of individuals aged t that are seropositive, λ is the village-specific annual rate of seroconversion, and ρ is the village-specific or overall annual rate of reversion to seronegative. Models were fitted independently for each village, allowing both λ and ρ to vary, and to all villages simultaneously, allowing λ to vary among villages but with the constraint of a single value of ρ. Seroprevalence was calculated for eight age groups of approximately equal size and the median group age used. In each case, the 0- to 2-yr age group was omitted because of distortions caused by the presence of maternal antibody in highly endemic villages. The models were fitted by using the solver add-in in excel (Microsoft, Reading, U.K.)
Results
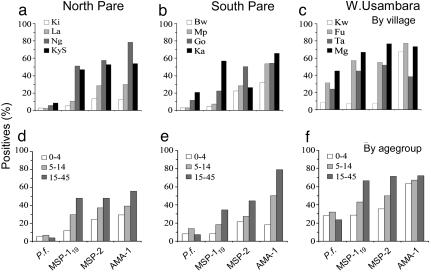
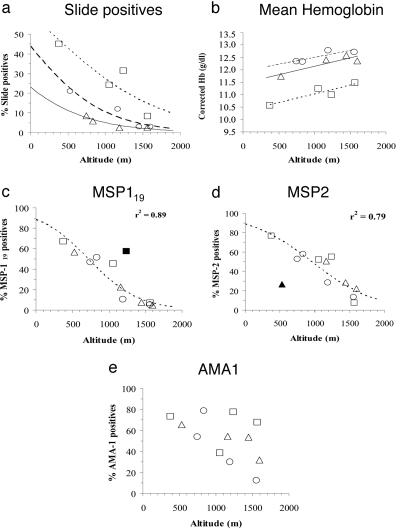
A total of 5,341 blood samples was collected over the course of the two cross-sectional surveys, 2,636 in the first survey and 2,653 in the second. The overall parasite prevalence was 14.6% (survey 1 = 12.1%; survey 2 = 17.0%), and overall mean Hb concentration was 11.9 g/dl (survey 1 = 11.8 g/dl; survey 2 = 12.0 g/dl), but both parameters varied significantly by both age and altitude, as shown in Fig. 2. Parasite prevalence decreased significantly with increasing altitude in the November 2001 survey (r2 = 0.60, P < 0.01), but this trend was less obvious in the June 2002 survey (r2 = 0.26, P = 0.09) (combined surveys: r2 = 0. 51 P < 0.001). Parasite prevalence correlated closely with prevalence of mild (Hb <11g/dl; r2 = 0.88) and moderate (Hb <8 g/dl; r2 = 0.86) anemia. For all three antigens, antibody prevalence was higher than parasite prevalence, and this difference was most marked in the two transects in the Pare mountains, where parasite prevalence was lowest (Fig. 2). Seroprevalence was highest for AMA-1 and lowest for MSP-119, consistent with previously reported differences in seroprevalence for these antigens (16–18), and these differences were most marked in villages at medium altitude/moderate vectorial capacity. Thus, for MSP-119 and MSP-2, seroprevalence increased with decreasing altitude (r2 = 0.75, P < 0.001 and r2 = 0.49, P = 0.011, respectively), but these trends were less evident for AMA-1 (r2 = 0.26, P = 0.088), indicating saturation of anti-AMA-1 antibody responses at medium-low altitude.
Fig. 2.
Prevalence of P. falciparum parasites and antimalarial antibodies. The prevalence of P. falciparum (as determined by microscopy) and antibodies to MSP-119, MSP-2, and AMA-1 (determined by ELISA) in each altitude transect by village (a–c) or age group (d–f). Data are shown for both surveys combined. The total numbers of samples tested were, n = 5,801; MSP-119, n = 5,341; MSP-2, n = 3,706; and AMA-1, n = 2,271.
Seroprevalence also increased with age for all antigens ( , df = 1, P < 0.0001 for all antigens for individual surveys and for both surveys combined), but again, responses to AMA-1 tended to saturate very quickly in high-transmission villages (e.g., Fig. 2f). There were few systematic differences between surveys, except that parasite rates were higher in the second survey. Village-level antibody prevalences and slide positivity rates were highly correlated for the two surveys, and both the ranking of the transects and the trends with altitude were similar between surveys.
Antibody Prevalence as an Indicator of Malaria Transmission Intensity. The utility of serology for estimating malaria transmission depends on finding a suitable serological marker. Our data indicate that AMA-1, MSP-2, and MSP-119 provide a range of immunogenicities from which it might be possible to select such a marker.
Despite the overall strong associations among altitude, parasite prevalence, and mean Hb concentration, the exact relationship varies from one altitude transect to another (Fig. 3a). The reason for intertransect variation is unclear but may reflect either short-term differences in climate and thus timing of the peak transmission season or stable climatic differences leading to differences in vectorial capacity (5). Interestingly, prevalences of antibodies to MSP-119 and, to a slightly lesser extent, MSP-2 were highly correlated with altitude, and differences among transects were much less apparent (Fig. 3 c and d). AMA-1 seroprevalence correlated less well with altitude; seroprevalences for six villages fell on a line of a similar slope to that given for MSP-119 and MSP-2 but were significantly higher than expected for their altitude for the other six villages.
Fig. 3.
Association between malariometric parameters and altitude. Prevalence of parasitemia (a), mean hemoglobin concentration (b), IgG antibodies to MSP-119 (c), IgG antibodies to MSP-2 (d), and IgG antibodies to AMA-1 (e) by village altitude (m) for all age groups (data from both surveys combined). □, West Usambara transect; Δ, South Pare transect; ○, North Pare transect. Lines represent logistic functions fitted for each individual transect (a) or for all points combined (c and d) or fitted for each transect by linear least squares (b). Outliers omitted from calculation of the fitted functions are shown by filled symbols (▪, Funta; ▴, Kadando). No close fit could be obtained for e. Mean Hb concentrations were adjusted for the direct physiological effects of altitude and sex on Hb concentration (5).
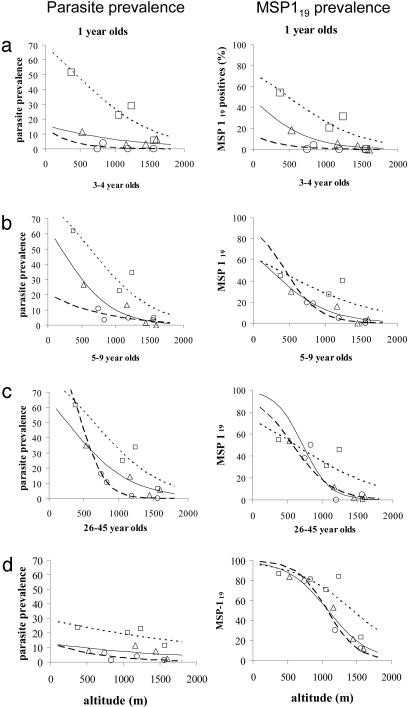
These data suggest that differences in the parasite prevalence–altitude relationship among transects may be due simply to recent short-term fluctuations in malaria transmission rather than to stable differences in endemicity, and that serological markers, which persist for longer than individual episodes of patent parasitemia, reflect longer-term trends in malaria transmission. To explore the possibility that serological markers reflect exposure to malaria over a prolonged period, antibody and parasite prevalence data were stratified by age (Fig. 4). In children under the age of 3 yr, the relationship between altitude and MSP-119 seroprevalence mirrored the relationship between altitude and slide positivity, with clear differences among transects. In other words, antibody prevalence in young children correlates closely with point-prevalence parasitemia. The intertransect differences in seroprevalence become much smaller in 3- to 4-yr olds, and by the time children reach the age of 5–9 yr, these differences have completely disappeared, although intertransect differences in parasite prevalence are still very obvious. Thus the correlation between parasite prevalence and seroprevalence decreases with increasing age (MSP-119, r = 0.41, 0.29, and 0.17; MSP-2, r = 0.24, 0.20, and 0.13; AMA-1, r = 0.28, 0.19, and 0.05, in individuals aged 0–4, 5–14, and 15–45 yr, respectively). Among adults, seroprevalence is very high and very similar among transects, whereas parasite prevalence has fallen, as would be expected among individuals who have acquired a significant degree of antiparasite immunity. The very high prevalence of antibodies in this group indicates that seropositivity can be retained in the absence of patent parasitemia.
Fig. 4.
Association among malariometric parameters, altitude, and age. Prevalence of parasitemia (Left) and IgG antibodies to MSP-119 (Right) by village altitude (m) for individual age groups (data from both surveys combined). Individuals aged 12–24 months (a), 3–4 years (b), 5–9 years (c), or 26–45 years (d). The lines represent logistic functions fitted for each transect. □, West Usambara transect; Δ, South Pare transect; ○, North Pare transect.
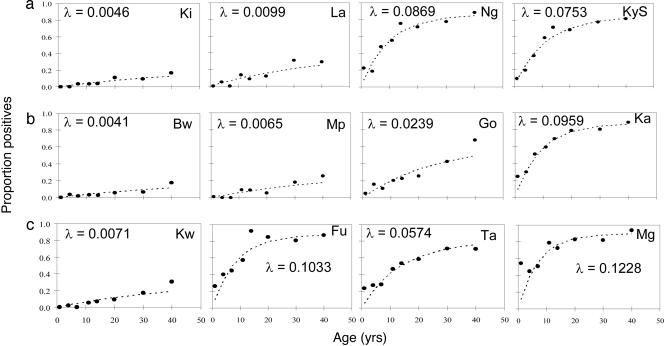
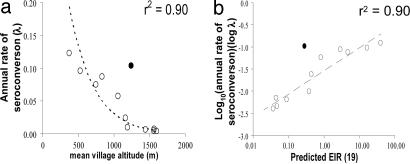
Estimating the Annual Rate of Seroconversion and Longevity of Antibody Responses from the Age Prevalence of MSP-119 Antibodies. That the relationship among seropositivity, parasite prevalence, and altitude changes with age suggested that seropositivity reflects cumulative exposure to malaria infection over many years, which, in turn, implies that seropositivity may be long-lived in the absence of recent reinfection. The simplest model of age-dependent changes in seroprevalence that fitted the serological data was a reversible catalytic conversion model in which the annual rate of becoming seropositive varied among villages, and the annual rate of reverting from seropositivity to seronegativity was constant across villages (Fig. 5). Omitting the reversion term significantly reduced the quality of fit (χ2 = 24.30, df = 1, P < 0.001). Allowing independent reversion rates for each village gave no improvement in fit compared with the use of a common rate of reversion (χ2 = 4.36; df = 11; P = 0.96). The best estimate for the common rate of reversion to seronegativity was 0.0139 yr–1 [95% confidence interval (C.I.) 0.0095–0.0190], giving a half life of the antibody response of 49.8 yr (95% C.I. 36.4–72.7 yr). Importantly, log (λ) (the village-specific annual rate of seroconversion) is linearly correlated (r = 0.95, P < 0.001 omitting outlier village Fu) with log(EIR) (estimated from published data from the same mountain ranges; ref. 19) (Fig. 6).
Fig. 5.
Association among altitude, age, and annual probability of conversion from MSP-119 seronegative to seropositive. Maximum-likelihood fits from reversible catalytic equilibrium model for each village are shown. The model was constrained to fit a single value for the annual probability of reversion to seronegative (ρ) (see text), which was estimated to be 0.01393 yr–1 (95% confidence interval 0.0095–0.0191). λ, the village-specific annual rate of seroconversion. (a) North Pare transect. (b) South Pare transect. (c) West Usambara transect. In each transect, villages are arranged in descending altitude from left (highest altitude) to right (lowest altitude).
Fig. 6.
Association between altitude or EIR and annual rate of seroconversion from MSP119 seronegative to seropositive. (a) Plot of estimated seroconversion rates (λ) (calculated as for Fig. 5) against altitude. The line and r2 value are for the least-squares fitted function λ = 0.59 e–0.003 h, where h is the altitude in m. Filled symbol, village Fu, which was omitted from the fit. (b) Plot of log(λ) against log (predicted annual EIR) (EIR, mean number of infectious bites per person per year). The least-squares fitted line has the equation Log10(λ) = 0.521·Log10(EIR) – 1.54. Filled symbol, village Fu, which was omitted from the fit. EIR was calculated from the equation EIR = 331.5 e–0.0057 h, where h is the altitude in m (19).
Discussion
Serology offers theoretical advantages over entomological and parasitological measures of malaria transmission in that a single measurement reflects exposure over an extended period, thus overcoming the sampling bias associated with seasonal variation in transmission levels and year-to-year variations in the timing and extent of peak transmission. The potential disadvantage of the serological approach is that if antibody responses saturate at low transmission intensity (as seen here for AMA-1) or are very long-lived, then serology may not detect significant recent deviations from the historic pattern of transmission. The significance of the data presented here is thus (i) that we have identified a serological marker (P. falciparum MSP-119), which shows a simple correlation with altitude (as a proxy for vectorial capacity) across the whole range of vectorial capacities likely to be encountered in Africa; (ii) that modeling of these data reveals that the village-specific annual rate of seroconversion is very closely correlated with independent estimates of the EIR; and (iii) that, by age stratification, we have been able to dissect long-term patterns of malaria transmission from short-term (seasonal and year-to-year) variations. Moreover, our data strongly suggest that, once acquired, antibody responses to PfMSP-119 are extremely long-lived.
Altitude has long been assumed to represent a proxy for malaria transmission, because there is a relatively constant relationship between mean temperature (which is a major determinant of vectorial capacity) (20) and altitude at any given latitude (21). Accordingly, a semilogarithmic relationship between EIR and altitude has been demonstrated within our study area (19). Thus, in principle, malaria transmission intensity would be expected to show a closer relationship to altitude than is evident from the parasite prevalences obtained in this study.
We have previously considered whether differences in vector composition, rainfall, and or socioeconomic status might explain intertransect differences in parasite prevalence (5); however, the data presented here argue strongly against there being any stable differences in malaria transmission intensity among the transects. Rather, in contrast to other measures of malaria infection (point prevalence parasitemia and mean Hb concentration), the relationship between seroprevalence and altitude was similar across three independent altitude transects; this remained true for both surveys when analyzed separately (data not shown) as well as when data from the two surveys were pooled. Thus, the serological data suggest that altitude-independent differences between transects reflect relatively recent changes in transmission rather than persistent differences in malaria endemicity.
In an attempt to put an actual time scale onto “recent” and “long-term” differences in transmission intensity, we examined the relationship between altitude and seroprevalence in individuals of different ages, where the presence of antibody reflects exposure over different numbers of years and months. That seroprevalence is very closely correlated with point prevalence in children under 2 years of age and that this correlation wanes with increasing age thereafter suggest that parasite rates indicate malaria transmission intensity within the previous 12–24 months. On the other hand, seroprevalence in the population as a whole seems to reflect transmission patterns over much longer periods. We propose, therefore, that a combination of parasite prevalence data and serological parameters with age stratification can be used to determine both current and past levels of malaria transmission and can thus be of considerable value for monitoring long-term trends in malaria endemicity in the context, for example, of malaria control programs or environmental impact assessments.
The utility of any particular serological marker of malaria transmission, however, will depend on the immunogenicity of the antigen, the extent of antigenic polymorphisms that might reduce the sensitivity of the assay, and the selection of appropriate assay conditions to ensure the detection of relevant antibody titers. After careful titration of specimen samples, we elected to screen all sera at a dilution of 1:1,000, because this consistently allowed us to detect sera that bound to recombinant antigens at an OD significantly above that of control sera from malaria-nonexposed donors, without excluding sera containing low concentrations of specific antibody. Although all of the antigens used here are polymorphic to varying extents, they are also known to contain conserved or relatively conserved sequences that induce strong antibody responses; thus, we do not consider that antigenic polymorphism imposes significant limitations on the interpretation of these data. In particular, considerable serological crossreactivity has been demonstrated among the four commonly occurring allelic sequences of MSP-119 (22, 23). As a general rule, it would appear prudent to use antigens with limited serological diversity. Although monitoring endemicity in one location will be unaffected by allelic diversity unless parasite genotype frequencies change over time, diversity is an issue when comparing endemicity among locations unless the predominant genotypes are known in each location. However, the three antigens clearly vary in immunogenicity, and this affects their value for the prediction of malaria endemicity. AMA-1 especially appeared to be very highly immunogenic, leading to saturation of antibody prevalence at moderate malaria endemicity. Thus, AMA-1 seroprevalence (at least at a titer of 1:1,000) does not appear useful for differentiating areas of moderate endemicity from areas of very high endemicity. However, assuming that seroconversion to AMA-1 occurs after only a single or very few malaria infections and/or that anti-AMA-1 antibodies are maintained for a very long time in the absence of reinfection, AMA-1 seroprevalence may be a useful indicator of transmission in areas of extremely low endemicity or for determining the extent of malaria epidemics. By contrast, MSP-119 appeared much less immunogenic, and antibody prevalence was closely correlated with altitude across the whole range, allowing clear differentiation of low-, moderate-, and high-transmission villages. These differences in inherent immunogenicity between AMA-1 and MSP-119 are supported by data emerging from vaccination trials and other seroepidemiological studies (24, 25).
From an immunological viewpoint, the most interesting finding of this study is that, once acquired, antibody responses to MSP-119 seem to persist for many, many years and may indeed be lifelong. The longevity of antibody responses to malaria has been hotly debated (26–28) but, having reviewed the immunological and epidemiological evidence, we have argued that, in the absence of effective antimalarial treatment, frequent or persistent subpatent malaria infection is sufficient to maintain seropositivity (29). This is compatible with the concept of premunition originally proposed by Sergent et al. (30) that existing infections protect against superinfections. The output from our model (giving an estimate of ≈50 years for the half life of the antibody response) is consistent with data derived from therapeutic malaria infections (31), isolated malaria outbreaks (32, 33), and migrants from malaria endemic areas who had not been reexposed for up to 11 years (34), all of which suggests that antibody levels to whole parasites or to individual antigens may persist for at least 10 years even in the absence of periodic or subpatent infection. The data are also consistent with a report of persistence of antibodies to Plasmodium vivax MSP-119 >30 years after malaria eradication (35), although in this case periodic recrudescence from hypnozoites may have conferred a state of premunition. The practical consequence of a very slow reversion rate of seropositivity is that there would be little serological impact in adults or older children of introducing an effective malaria control program. However, we would expect to observe changes in seroconversion rates in infants and younger children born after the implementation of the program. Age stratification of the seroprevalence data is thus very important.
Conclusion
We have shown that malariometric and serological indicators provide information about malaria transmission intensity over different periods of time. Parasite prevalence and Hb concentration provide information about malaria infection in the previous few months (perhaps as long as 1 or 2 yr), whereas antibodies to defined immunologically conserved malaria antigens accumulate within the population at different rates, depending on their immunogenicity, and reflect transmission intensity over periods of several years. Judicious selection of serological tools for estimating malaria transmission intensity, for example, antibody responses of all age groups to a highly immunogenic antigen in areas of very low or sporadic transmission or responses of young children to somewhat less immunogenic antigens in areas of very high transmission, may allow us to build up detailed pictures of malaria epidemiology over large areas rapidly and comparatively cheaply. This approach also offers the opportunity to examine variations in endemicity over time as an important additional component of this picture.
Supplementary Material
Acknowledgments
We thank A. Kitua (National Institute for Medical Research, Amani, Tanzania), B. M. Greenwood (London School of Hygiene and Tropical Medicine), J. Shao (Kilimanjaro Christian Medical College, Moshi, Tanzania), and I. Bygbjerg (University of Copenhagen) for their support and advice. We also thank C. Jones, F. Lazier, M. Mosha, B. P. Mmbando, members of the Joint Malaria Programme community studies team, F. Magogo, E. Lyatuu, J. Akida, and the laboratory staff at Kilimanjaro Christian Medical College and the National Institute for Medical Research. The assistance and support of regional medical officers are gratefully acknowledged. Finally, we thank Dr. A. Holder (National Institute for Medical Research, U.K.) for providing the MSP-119–GST transformed Escherichia coli clones and Prof. R. Anders (La Trobe University, Victoria, Australia) for the recombinant AMA-1. This study was conducted as part of the Joint Malaria Programme, a collaboration between the National Institute for Medical Research; Kilimanjaro Christian Medical College; the London School of Hygiene and Tropical Medicine; and the Centre for Medical Parasitology; University of Copenhagen, with funding from the U.K. Medical Research Council, the Danish International Development Agency, and the Gates Malaria Partnership (Bill and Melinda Gates Foundation). C.J.D. is supported by a Wellcome Trust Research Training Fellowship.
Author contributions: C.J.D., P.H.C., J.E.T., W.M.M.N., M.M.L., and E.M.R. designed research; C.J.D., J.E.T., S.L.R.M., R.M., J.L., A.M., and H.R. performed research; J.C. contributed new reagents/analytic tools; C.J.D., P.H.C., P.G.C., J.E.T., S.L.R.M., I.C., J.C., and E.M.R. analyzed data; C.J.D., P.H.C., J.E.T., and E.M.R. wrote the paper; C.J.D. and M.M.L. supervised data collection; C.J.D. supervised testing of sera; P.H.C. designed serological analyses; P.G.C. modeled data; J.C. provided the climatic model; and E.M.R. supervised all aspects of the project.
This paper was submitted directly (Track II) to the PNAS office.
Abbreviation: EIR, entomological inoculation rate.
References
- 1.Snow, R. W., Omumbo, J. A., Lowe, B., Molyneux, C. S., Obiero, J., Palmer, A., Weber, M. W., Pinder, M., Nahlen, B. L., Obonyo, C., et al. (1997) Lancet 349, 1650–1654. [DOI] [PubMed] [Google Scholar]
- 2.Mbogo, C., Mwangangi, J., Nzovu, J., Gu, W., Yan, G., Gunter, J., Swalm, C., Keating, J., Regens, J., Shililu, J., et al. (2003) Am. J. Trop. Med. Hyg. 68, 734–742. [PubMed] [Google Scholar]
- 3.Craig, M., Snow, R. & le Sueur, D. (1999) Parasitol. Today 15, 105–111. [DOI] [PubMed] [Google Scholar]
- 4.Omumbo, J. A., Hay, S. I., Guerra, C. A. & Snow, R. W. (2004) Malar. J. 3, 17. [DOI] [PMC free article] [PubMed] [Google Scholar]
- 5.Drakeley, C., Carneiro, I. A., Reyburn, H., Malima, R., Lusingu, J., Cox, J., Theander, T. G., Nkya, W., Lemnge, M. & Riley, E. (2005) J. Infect. Dis., in press. [DOI] [PubMed]
- 6.Webster, H. K., Gingrich, J. B., Wongsrichanalai, C., Tulyayon, S., Suvarnamani, A., Sookto, P. & Permpanich, B. (1992) Am. J. Trop. Med. Hyg. 47, 489–497. [DOI] [PubMed] [Google Scholar]
- 7.Snow, R. W., Molyneux, C. S., Warn, P., Omumbo, J. A., Nevill, C. G., Gupta, S. & Marsh, K. (1996) Am. J. Trop. Med. Hyg. 55, 144–149. [PubMed] [Google Scholar]
- 8.Riley, E., Wagner, G. & Roper, C. (1996) Parasitol. Today 12, 410–411. [DOI] [PubMed] [Google Scholar]
- 9.Okech, B., Corran, P., Todd, J., Joynson-Hicks, A., Uthaipibull, C., Egwang, T., Holder, A. & Riley, E. (2004) Infect. Immun. 72, 1557–1567. [DOI] [PMC free article] [PubMed] [Google Scholar]
- 10.Burghaus, P. A. & Holder, A. A. (1994) Mol. Biochem. Parasitol. 64, 165–169. [DOI] [PubMed] [Google Scholar]
- 11.Franks, S., Baton, L., Tetteh, K., Tongren, E., Dewin, D., Akanmori, B. D., Koram, K. A., Ranford-Cartwright, L. & Riley, E. M. (2003) Infect. Immun. 71, 3485–3495. [DOI] [PMC free article] [PubMed] [Google Scholar]
- 12.Hodder, A. N., Crewther, P. E. & Anders, R. F. (2001) Infect. Immun. 69, 3286–3294. [DOI] [PMC free article] [PubMed] [Google Scholar]
- 13.Charlwood, J. D., Smith, T., Lyimo, E., Kitua, A. Y., Masanja, H., Booth, M., Alonso, P. L. & Tanner, M. (1998) Am. J. Trop. Med. Hyg. 59, 243–251. [DOI] [PubMed] [Google Scholar]
- 14.Bekessy, A., Molineaux, L. & Storey, J. (1976) Bull. World Health Org. 54, 685–693. [PMC free article] [PubMed] [Google Scholar]
- 15.Williams, B. G. & Dye, C. (1994) Parasitol. Today 10, 489–493. [DOI] [PubMed] [Google Scholar]
- 16.Thomas, A. W., Trape, J. F., Rogier, C., Goncalves, A., Rosario, V. E. & Narum, D. L. (1994) Am. J. Trop. Med. Hyg. 51, 730–740. [DOI] [PubMed] [Google Scholar]
- 17.Egan, A. F., Morris, J., Barnish, G., Allen, S., Greenwood, B. M., Kaslow, D. C., Holder, A. A. & Riley, E. M. (1996) J. Infect. Dis. 173, 765–769. [DOI] [PubMed] [Google Scholar]
- 18.Taylor, R. R., Smith, D. B., Robinson, V. J., McBride, J. S. & Riley, E. M. (1995) Infect. Immun. 63, 4382–4388. [DOI] [PMC free article] [PubMed] [Google Scholar]
- 19.Bodker, R., Akida, J., Shayo, D., Kisinza, W., Msangeni, H. A., Pedersen, E. M. & Lindsay, S. W. (2003) J. Med. Entomol. 40, 706–717. [DOI] [PubMed] [Google Scholar]
- 20.Lindsay, S. W. & Birley, M. H. (1996) Ann. Trop. Med. Parasitol. 90, 573–588. [DOI] [PubMed] [Google Scholar]
- 21.Tabony, R. C. (1985) Meteorol. Mag. 114, 37–48. [Google Scholar]
- 22.Egan, A. F., Chappel, J. A., Burghaus, P. A., Morris, J. S., McBride, J. S., Holder, A. A., Kaslow, D. C. & Riley, E. M. (1995) Infect. Immun. 63, 456–466. [DOI] [PMC free article] [PubMed] [Google Scholar]
- 23.Apio, B., Nalunkuma, A., Okello, D., Riley, E. & Egwang, T. G. (2000) East Afr. Med. J. 77, 189–193. [DOI] [PubMed] [Google Scholar]
- 24.Riley, E., Wagner, G., Ofori, M., Wheeler, J., Akanmori, B., Tetteh, K., McGuinness, D., Bennett, S., Nkrumah, F., Anders, R., et al. (2000) Infect. Immun. 68, 5856–5863. [DOI] [PMC free article] [PubMed] [Google Scholar]
- 25.Stowers, A. W., Kennedy, M. C., Keegan, B. P., Saul, A., Long, C. A. & Miller, L. H. (2002) Infect. Immun. 70, 6961–6967. [DOI] [PMC free article] [PubMed] [Google Scholar]
- 26.Good, M. F. & Zevering, Y. (1994) Res. Immunol. 145, 455–460. [DOI] [PubMed] [Google Scholar]
- 27.Cavanagh, D. R., Elhassan, I. M., Roper, C., Robinson, V. J., Giha, H., Holder, A. A., Hviid, L., Theander, T. G., Arnot, D. E. & McBride, J. S. (1998) J. Immunol. 161, 347–359. [PubMed] [Google Scholar]
- 28.Taylor, R. R., Egan, A., McGuinness, D., Jepson, A., Adair, R., Drakely, C. & Riley, E. (1996) Int. Immun. 8, 905–915. [DOI] [PubMed] [Google Scholar]
- 29.Struik, S. & Riley, E. (2004) Immun. Rev. 201, 268–290. [DOI] [PubMed] [Google Scholar]
- 30.Sergent, E., Parrott L.& Donatien A. (1924) Bull. Soc. Path. Exot. 17, 37–38 [Google Scholar]
- 31.Collins, W. E., Skinner, J. C. & Jeffery, G. M. (1968) Am. J. Epidemiol. 87, 592–598. [DOI] [PubMed] [Google Scholar]
- 32.Luby, J. P., Collins, W. E. & Kaiser, R. L. (1967) Am. J. Trop. Med. Hyg. 16, 255–257. [PubMed] [Google Scholar]
- 33.Deloron, P. & Chougnet, C. (1992) Parasitol. Today 8, 375–378. [DOI] [PubMed] [Google Scholar]
- 34.Druilhe, P., Pradier, O., Marc, J.-P., Miltgen, F., Mazier, D. & Parent, G. (1986) Infect. Immun. 53, 393–397. [DOI] [PMC free article] [PubMed] [Google Scholar]
- 35.Lim, K. J., Park, J. W., Yeom, J. S., Lee, Y. H., Yoo, S. B., Oh, J. H., Sohn, M. J., Bahk, Y. Y. & Kim, Y. S. (2004) Parasitol. Res. 92, 384–389. [DOI] [PubMed] [Google Scholar]
Associated Data
This section collects any data citations, data availability statements, or supplementary materials included in this article.


