Abstract
Background:
Urinary Ethyl glucuronide (EtG) and Ethyl sulfate (EtS) are established markers of alcohol conumption. Measurement of these markers in serum offers certain advantages. This outpatient department based study evaluated performance of serum Ethyl glucuronide (EtG) and Ethyl sulphate (EtS) as biomarkers of recent alcohol consumption in alcohol dependent subjects. It also evaluated effect of alcohol dose and time since consumption on serum EtG and EtS concentration.
Methods:
Information regarding alcohol intake was collected using Time line follow back calendar method from 152 subjects. Blood samples were collected to determine serum EtG and EtS concentration.
Results:
The results revealed that serum EtG (at a threshold of 45 ng/mL) could detect recent moderate to heavy alcohol consumption with 85 percent sensitivity and 89 percent specificity. The results also show that simultaneous measurement of EtS does not increase test accuracy. We found that dose of alcohol and time since alcohol consumption explain 68 and 62 percent variance in serum EtG and EtS levels.
Conclusion:
EtG testing in blood was found useful as a way to detect recent drinking. This sensitive and specific short-term biomarker provides valuable information about recent alcohol consumption.
Keywords: Alcohol, alcoholism, biomarkers, ethyl glucuronide, ethyl sulfate
INTRODUCTION
Nonoxidative metabolism of ethanol generates compounds, which are called direct markers of alcohol. This group includes ethyl glucuronide (EtG), ethyl sulfate (EtS), and phosphatidylethanol (PEth).[1] EtG and EtS are the products of conjugation reactions catalyzed by Uridine 5’–diphospho–glucuronosyltransferase (UDP-glucuronosyltransferase) and sulfotransferases.[2,3] EtG and EtS are nonvolatile, water-soluble, stable, and detectable long after complete elimination of alcohol. Due to these properties, EtG and EtS are used as markers of alcohol use in forensic settings, treatment programs, and clinical trials.[1] EtG and EtS are concentrated by almost 200 times in urine as compared to serum; hence, their window of detection in urine is up to 90 h.[4] This makes urine a preferred matrix for detection of EtG and EtS. Accordingly, most of the research has focused on urinary EtG, EtS detection, quantification, and decision regarding thresholds.[1]
The collection of a urine sample is noninvasive and allows for simultaneous testing of other drugs, but it has certain shortcomings. First, in certain clinical settings like the emergency department, it may not be possible to obtain a urine sample. Neumann et al. have reported the usefulness of serum EtG and EtS in the emergency department to detect recent alcohol use, in addition to self-report and gamma-glutamyl transferase (GGT) and carbohydrate-deficient transferrin (CDT).[5]
Second, direct observation of urine sample collection is impractical. A participant can dilute the urine sample by drinking a large quantity of water, using diuretics, adding water after collection of a sample, or can give a substituted sample. Third, various markers of alcohol abuse such as CDT, hepatic enzymes, mean corpuscular volume, and PEth require collection of a blood sample.[6] Thus, it may be convenient to use serum EtG and EtS. Lastly, both EtG and EtS are concentrated manifold before excretion. This has led to concerns about false-positive results after unintentional exposure to the products containing alcohol. False-positive results are a serious concern in forensic settings, and thus, the threshold for reporting a positive urinary EtG has been increased to 500 ng/mL.[7] Jatlow et al. have recently reported that this may be a very high threshold for clinical use.[8] In this context, serum EtG and EtS concentrations may be easier to interpret.
Earlier studies have provided a well-defined pharmacokinetic model of EtG and EtS in healthy volunteers.[4] Schmitt et al. have developed computer models to simulate serum EtG and EtS levels with fair degree of certainty.[9,10] These models show that the concentration of serum EtG and EtS is a function of two opposing influences; dose of alcohol consumed and time elapsed between consumption and sample collection. Pharmacokinetic studies are conducted in a controlled manner; wherein, healthy volunteers are exposed to a definite dose of alcohol, and repeated blood samples are collected at predefined time intervals. In clinical settings, there is no control over dose of alcohol consumed or the time elapsed between alcohol consumption and sample collection. Hoiseth et al. have reported the kinetics of EtG and EtS in 16 participants undergoing detoxification.[11] We wish to extend this research to a bigger sample using a single sample per participant. This study aims to evaluate and compare the performance of serum EtG and EtS as diagnostic markers of alcohol intake. We also aim to analyze the effect of dose of alcohol and time since consumption in a clinical setting where only a single sample is available per participant.
METHODOLOGY
Subjects and assessment
This study reports the retrospective analysis of routinely collected clinical and biochemical data from the Centre for Addiction Medicine, National Institute of Mental Health and Neurosciences, Bangalore. We reviewed the records of 210 participants with a diagnosis of alcohol dependence syndrome (ADS) according to the International Classification of Diseases-10.[12] Patients using any substance other than nicotine were excluded from the study. Peak serum EtG and EtS levels are expected after 4-5 hours of alcohol consumption.[13] Keeping this in mind we excluded patients who had consumed alcohol in the 5 hours preceding recruitment and collection of sample.[13] We excluded patients using beer, wine, or country liquor due to two reasons. First, wine and beer have a high content of polyphenols and flavonoids that affect EtG and EtS metabolism.[14,15] Second, all hard drinks allowed by government regulations (whiskey, rum, vodka, or gin) have a content of 42.8% alcohol by volume. This allowed us to quantify a standard drink (30 mL) which is equivalent to approximately 14 g of ethanol. In addition, patients who presented to the clinic under the obligation of law enforcement agencies or employer were also excluded from the study as these factors are known to cause misreporting.[16] After these exclusions, we had a sample of 152 participants. For this study, we focused on data regarding last alcohol consumption. These data were collected using a calendar method, similar to the alcohol timeline follow back.[17] Self-reported time since last alcohol consumption in hours is recorded as a continuous integer. A number of standard drinks consumed at the most recent drinking episode is also assessed as a continuous integer.
Patients with a diagnosis of ADS attending our outpatient clinic are routinely evaluated for biomarkers of alcohol use including CDT, GGT, serum EtG, and serum EtS. We have used serum EtG and EtS data for this study. Blood samples are collected under aseptic precautions, and separated serum is used for EtG and EtS quantification. Samples were transported immediately to the laboratory, stored at − 20°C, and analyzed within a week of collection. The Institute Ethics Committee has approved this study involving analysis of routinely collected clinical and biochemical data.
Quantification of serum ethyl glucuronide and serum ethyl sulfate
Measurement of EtG and EtS in serum was performed by electrospray liquid chromatography-tandem mass spectrometry (LC-MS-MS) using selected ion monitoring of m/z 221 for EtG, 125 for EtS, and 226 for penta-deuterated internal standard (EtG-D5). A volume of 300 μL of acetonitrile was added to 200 μL of serum followed by vortex mixing and centrifugation. The resulting supernatant of 100 μL was added to 50 μL of EtG-D5 solution (100 ng/mL); the final volume was made 1000 μL using deionized water. A 3 μL aliquot was injected into the LCMS system. For EtG analysis, calibration curve was linear (r2 = 0.99, P < 0.001) in concentration range of 50–100,000 ng/mL, limit of quantification (LOQ) was 24 ng/mL, limit of detection (LOD) was 7.08 ng/mL, intraday precision was 3.5%, and interday precision was 3.48%. For EtS analysis, calibration curve was linear (r2 = 0.99, P < 0.001) in concentration range of 5–1000 ng/mL, LOQ was 2.8 ng/mL, LOD was 1.2 ng/mL, intraday precision was 6.11%, and interday precision was 8.81%. For this analysis, all results between LOQ and LOD are set to LOD, while results below LOD are reported as 0.
Statistical analysis
Statistical Analysis was done using MedCalc Statistical Software version 16.4.3 (MedCalc Software bvba, Ostend, Belgium; https://www.medcalc.org; 2016) and R package stats (version 2.14.0, Vienna, Austria).[18] All reported confidence intervals are calculated using a bootstrap technique where 1000 samples were nonparametrically simulated through resampling.[19]
Evaluation of serum ethyl glucuronide and ethyl sulfate as biomarkers of recent alcohol consumption
We conducted receiver operating characteristic (ROC) analyses for EtG, EtS, and a biomarker that combines EtG and EtS (EtG + EtS). For this purpose, a binary logistic regression analysis using EtG and EtS as independent variables was done. The value of “predicted probability” for each participant is used as a measure of EtG + EtS.[20] Self-reported alcohol use in the preceding 14 days was coded as “true state.” Summary statistics of ROC curve, area under curve (AUC) and Youden's index[21] (J), are calculated using the nonparametric empirical method of Delong.[22] Youden's index is independent of costs of a misclassification and prevalence of the disease state.[23] This allows generalization of results to a setting with a low prevalence of alcohol use than ours, like an emergency department. We compared the efficacy of EtG, EtS, and EtG + EtS using nonparametric significance testing of their AUC. We have used the optimal threshold corresponding to Youden's index to calculate sensitivity, specificity, positive likelihood ratio (LR), negative LR, and balanced accuracy of the tests.[24,25]
Effect of time and dose on ethyl glucuronide and ethyl sulfate levels
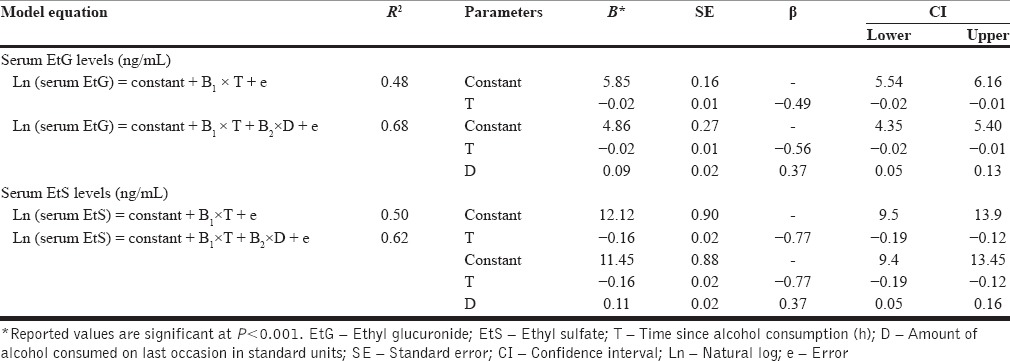
Effect of “time since alcohol consumption in hours” (T) and “amount of alcohol consumed on last occasion in standard units” (D) on EtG and EtS levels was explored using a multiple regression analysis. Model equations are mentioned in Table 1. Model diagnostics were performed using standardized residuals histogram, standardized residuals versus standardized predicted value plot, Cook's distance values, and leverage values.[26] We cross-validated both models using 20% of the sample, which was randomly excluded during model building.
Table 1.
Effect of time since alcohol consumption in hours (T) and dose of alcohol consumed in standard units (D) on serum ethyl glucuronide and ethyl sulfate concentration
RESULTS
Sample characteristics
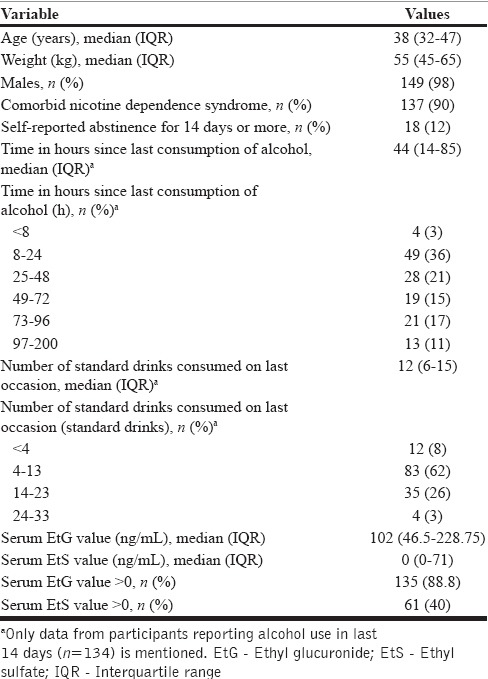
The sample comprised 152 participants. Table 2 summarizes sociodemographic and other characteristics. Serum EtG and EtS showed a bimodal distribution with values clustering at lower and upper end of the scale. Twelve percent of participants reported abstinence from alcohol for last 14 days.
Table 2.
Demographic, alcohol-related and serum ethyl glucuronide, ethyl sulfate measurements in 152 participants
Receiver operating characteristic analysis
AUC of EtG is 0.91 (standard deviation [SE] =0.03), which is significantly higher than 0.5 (Z = 15.41, P < 0.0001). Youden's index (J) is equal to 0.74 with an associated cutoff value of EtG > 45 ng/mL. AUC of EtS is 0.68 (SE = 0.03) which is significantly higher than 0.5 (Z = 5.5, P < 0.0001). Youden's index is equal to 0.38 with an associated cutoff value EtS > 14 ng/mL. AUC of EtG + EtS is 0.91 (SE = 0.03) which is also significantly higher than 0.5 (Z = 15.6, P < 0.0001). AUC of EtG (0.91) and EtG + EtS (0.91) is significantly higher than EtS (0.68) (Z = 6.136, P < 0.001 and Z = 6.25, P < 0.0001, respectively) [Figure 1]. Notably, AUC of EtG + EtS is same as AUC of EtG. Table 3 summarizes the features of EtG and EtS as diagnostic markers of recent alcohol use when empirically derived cutoff is used in this sample. Figure 2 depicts the change in sensitivity of EtG (at a cutoff of more than 45 ng/mL) with dose and time of alcohol consumption.
Figure 1.
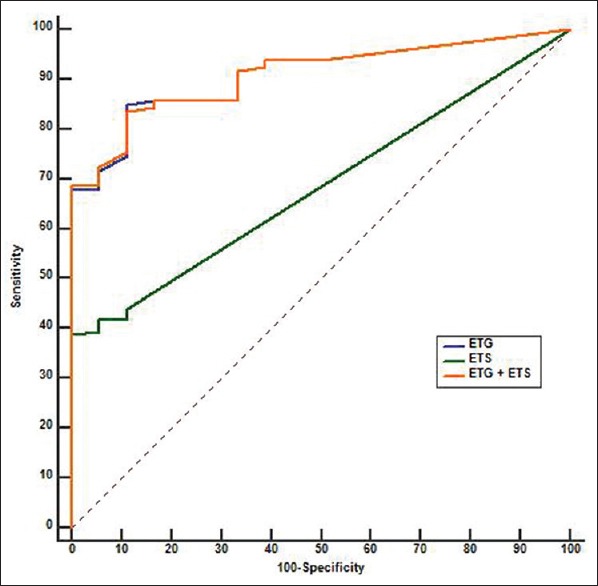
Performance of serum ethyl glucuronide and ethyl sulfate as biomarkers of recent alcohol consumption. Receiver operating characteristic curve of serum ethyl glucuronide (blue), ethyl sulfate (green), and ethyl glucuronide + ethyl sulfate (orange)
Table 3.
Characteristics of serum ethyl glucuronide and ethyl sulfate as a biomarker to detect recent alcohol use

Figure 2.
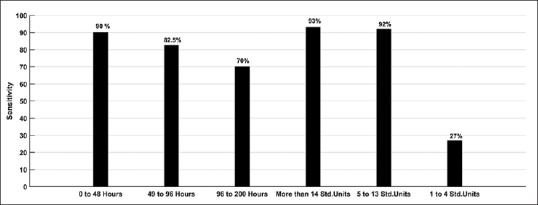
Change in sensitivity of serum ethyl glucuronide as a biomarker of recent alcohol use with time since consumption of alcohol (left three bars) and amount of alcohol consumed on last occasion (right three bars)
Effect of time and dose on ethyl glucuronide and ethyl sulfate levels
Scatter plots of EtG and EtS show an exponential relationship with time since alcohol consumption [Figure 3].
Figure 3.
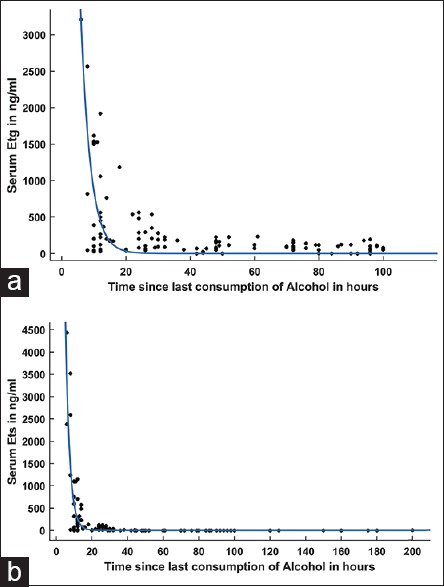
Relationship of time since last consumption of alcohol in hours with ethyl glucuronide (a) and ethyl sulfate (b) concentration
Results of multiple regression analysis of EtG concentration (n = 135, model specification = 120, model validation = 15) and EtS concentration (n = 61, model specification = 49, model validation = 12) are summarized in Table 1. Regression diagnostics did not show a violation of assumptions or influential cases. In summary, a dose of alcohol consumed and time since alcohol consumption explain 68% of variance in observed serum EtG values. Cross-validation process found that the model is valid; predicted values have a significant correlation with observed values (r = 0.9, R2 = 0.85, P < 0.001). In EtS model, a dose of alcohol consumed and time since alcohol consumption explain 62% of variance in observed EtS values. Cross-validation process found that model is valid; predicted values had a significant correlation with observed values (r = 0.8, R2 = 0.64, P < 0.001).
DISCUSSION
This study focused on serum EtG and EtS as biomarkers for recent alcohol use in ADS patients. Our main finding is that serum EtG, but not EtS, is a useful marker of heavy alcohol consumption up to 96 h. We could also model the effect of the amount of alcohol consumed and time since consumption on serum EtG and EtS. To our knowledge, this is the first study evaluating sensitivity and specificity of serum EtG and EtS as biomarkers of recent alcohol consumption in ADS patients.
We found that AUC of EtG, EtS, and EtG + EtS is significantly higher than 0.5, which means that all the three measures are better than chance at detecting alcohol used. AUC of EtG is higher than EtS. However, AUC of EtG + EtS is same as EtG; we infer that measuring EtS along with EtG does not increase accuracy. This is in agreement with recent studies that have failed to find a role of measuring urinary EtS in routine testing.[8] It is worth noting that EtG, but not EtS, is liable to bacterial degradation and production.[27,28] In comparison to urine samples, contamination of blood samples with bacteria is less likely. In conclusion, we did not find a role of serum EtS in detecting recent alcohol use; thus, we limit further discussion to serum EtG.
The sensitivity of EtG in our sample is 85 while specificity is 89%. Although sensitivity and specificity are the usual measures of validity, they do not translate into clinical use intuitively. LR is a Bayesian concept and is a more informative index for clinical use.[29] At an optimal cutoff (positive = EtG > 45 ng/mL), EtG has a positive LR of 7.7. For example, if a patient has a pretest odds of 1 (lapse is as likely as abstinence) and has serum EtG concentration above 45 ng/mL, posttest odds are 7.7.[29] In this case, the clinician has moved from an equivocal state (lapse-50% and abstinence-50%) to a state of strong suspicion (lapse-88.5% and abstinence-11.5%). Thus, using serum EtG to detect recent alcohol use will provide clinically useful information.
Jatlow et al. have studied the effect of dose of alcohol and time since consumption, on the sensitivity of urinary EtG at different cutoff thresholds. They concluded that at low dose (two standard units) even the lowest cutoff has poor sensitivity at 24 h.[8] Similarly, at 48 h, sensitivity is poor irrespective of dose of alcohol and cutoff used. We found similar results in this study; serum EtG has good sensitivity to detect consumption of more than four standard units (92%), but it cannot detect less than four standard drinks (sensitivity = 27%). However, in this sample, we did not find a precipitous drop in sensitivity with increasing time since alcohol consumption. Sensitivity to detect alcohol use that occurred 49–96 h before testing was 82.5%. This finding is not in agreement with earlier studies of EtG pharmacokinetics. Hoiseth et al. in 2009 studied blood kinetics of EtG after heavy alcohol intake (median = 12.2 standard units).[11] They have reported that serum EtG becomes undetectable by 48 h in all participants. It is possible that patients in our sample could have misreported the time of last drink. However, we find that 60% of participants reported their last use in < 48 h before sample collection; thus, a general trend toward withholding information is not apparent. Another reason for high serum EtG levels could be an accumulation of EtG over time with continuous heavy alcohol intake. This is also unlikely as metabolism and excretion of EtG are not saturated even at high doses.[4,11] Earlier studies suggest that the proportion of alcohol excreted as EtG increases with higher doses of alcohol. This reflects the saturation of oxidative pathway.[10,11,30] Oxidative metabolism of alcohol is liable to genetic polymorphisms of alcohol dehydrogenase enzyme.[31] It is possible that in Indian population this leads to increased shunting to the nonoxidative pathway. In fact, in our sample, six participants had serum EtG values above 5000 ng/mL which are higher than the maximum concentration (Cmax) reported in earlier studies.[10] Our study cannot answer this issue due to a naturalistic design; a controlled pharmacokinetic study is required to quantify the proportion of alcohol excreted as EtG in this population.
Earlier studies have indicated a high interindividual variability in EtG and EtS, in urine and serum, even if dose of alcohol and time since consumption are held constant.[10,30] In a clinical scenario, dose and time of last consumption are unknown, and mostly a single sample is collected per participant. Our aim was to consider the transferability of knowledge from well-controlled repeated measure studies to a naturalistic single sample scenario. We found that a regression model using dose and time as explanatory variables explains 68% and 62% of the variance in serum EtG and EtS levels, respectively. The models were cross-validated successfully and are generalizable. We found that coefficients for both models are similar, which indicate that EtG and EtS have comparable pharmacokinetics. This is in agreement with pharmacokinetic models of EtG and EtS.[9,10]
This study has some limitations. First, we have used self-report as a “gold standard” against which performance of biomarkers was tested. It means that observed estimates of test accuracy are actually measures of agreement between self-report and test results. This could have biased the results in an unpredictable manner. Second, our sample was unbalanced, with only 12% of participants being true negative. We have tried to control this using balanced accuracy and ROC analyses that are robust to pretest prevalence. Keeping these limitations in mind, we could demonstrate that serum EtG is a useful marker of heavy alcohol consumption in the last 96 h.
CONCLUSION
EtG testing in blood was found to have satisfactory performance in detecting recent alcohol consumption. Measurement of EtS did not improve accuracy in this sample. Future studies with experimenter controlled exposure to alcohol will help in evaluating the sensitivity and specificity of these biomarkers.
Financial support and sponsorship
Nil.
Conflicts of interest
There are no conflicts of interest.
REFERENCES
- 1.Wurst FM, Thon N, Yegles M, Schrück A, Preuss UW, Weinmann W. Ethanol metabolites: Their role in the assessment of alcohol intake. Alcohol Clin Exp Res. 2015;39:2060–72. doi: 10.1111/acer.12851. [DOI] [PubMed] [Google Scholar]
- 2.Foti RS, Fisher MB. Assessment of UDP-glucuronosyltransferase catalyzed formation of ethyl glucuronide in human liver microsomes and recombinant UGTs. Forensic Sci Int. 2005;153:109–16. doi: 10.1016/j.forsciint.2004.12.003. [DOI] [PubMed] [Google Scholar]
- 3.Schneider H, Glatt H. Sulpho-conjugation of ethanol in humans in vivo and by individual sulphotransferase forms in vitro. Biochem J. 2004;383(Pt 3):543–9. doi: 10.1042/BJ20040925. [DOI] [PMC free article] [PubMed] [Google Scholar]
- 4.Høiseth G, Yttredal B, Karinen R, Gjerde H, Mørland J, Christophersen A. Ethyl glucuronide concentrations in ora+l fluid, blood, and urine after volunteers drank 0.5 and 1.0 g/kg doses of ethanol. J Anal Toxicol. 2010;34:319–24. doi: 10.1093/jat/34.6.319. [DOI] [PubMed] [Google Scholar]
- 5.Neumann T, Helander A, Dahl H, Holzmann T, Neuner B, Weiss-Gerlach E, et al. Value of ethyl glucuronide in plasma as a biomarker for recent alcohol consumption in the emergency room. Alcohol Alcohol. 2008;43:431–5. doi: 10.1093/alcalc/agn035. [DOI] [PubMed] [Google Scholar]
- 6.Tavakoli HR, Hull M, Michael Okasinski L. Review of current clinical biomarkers for the detection of alcohol dependence. Innov Clin Neurosci. 2011;8:26–33. [PMC free article] [PubMed] [Google Scholar]
- 7.Substance Abuse and Mental Health Services Administration. The Role of Biomarkers in the Treatment of Alcohol Use Disorders. 2012. [Last accessed on 2016 Dec 16]. Available from: http://www.kap.samhsa.gov/products/manuals/advisory/pdfs/Advisory_Biomarkers_Revision.pdf .
- 8.Jatlow PI, Agro A, Wu R, Nadim H, Toll BA, Ralevski E, et al. Ethyl glucuronide and ethyl sulfate assays in clinical trials, interpretation, and limitations: Results of a dose ranging alcohol challenge study and 2 clinical trials. Alcohol Clin Exp Res. 2014;38:2056–65. doi: 10.1111/acer.12407. [DOI] [PMC free article] [PubMed] [Google Scholar]
- 9.Schmitt G, Halter CC, Aderjan R, Auwaerter V, Weinmann W. Computer assisted modeling of ethyl sulfate pharmacokinetics. Forensic Sci Int. 2010;194:34–8. doi: 10.1016/j.forsciint.2009.10.004. [DOI] [PubMed] [Google Scholar]
- 10.Droenner P, Schmitt G, Aderjan R, Zimmer H. A kinetic model describing the pharmacokinetics of ethyl glucuronide in humans. Forensic Sci Int. 2002;126:24–9. doi: 10.1016/s0379-0738(02)00025-7. [DOI] [PubMed] [Google Scholar]
- 11.Høiseth G, Morini L, Polettini A, Christophersen A, Mørland J. Blood kinetics of ethyl glucuronide and ethyl sulphate in heavy drinkers during alcohol detoxification. Forensic Sci Int. 2009;188:52–6. doi: 10.1016/j.forsciint.2009.03.017. [DOI] [PubMed] [Google Scholar]
- 12.WHO. The ICD.10 Classification of Mental and Behavioural Disorders: Clinical Descriptions and Diagnostic Guidelines. Geneva: World Health Organization; 1992. [Google Scholar]
- 13.Lostia AM, Vicente JL, Cowan DA. Measurement of ethyl glucuronide, ethyl sulphate and their ratio in the urine and serum of healthy volunteers after two doses of alcohol. Alcohol Alcohol. 2013;48:74–82. doi: 10.1093/alcalc/ags108. [DOI] [PubMed] [Google Scholar]
- 14.Williams JA, Hyland R, Jones BC, Smith DA, Hurst S, Goosen TC, et al. Drug-drug interactions for UDP-glucuronosyltransferase substrates: A pharmacokinetic explanation for typically observed low exposure (AUCi/AUC) ratios. Drug Metab Dispos. 2004;32:1201–8. doi: 10.1124/dmd.104.000794. [DOI] [PubMed] [Google Scholar]
- 15.Stachel N, Skopp G. Identification and characterization of sulfonyltransferases catalyzing ethyl sulfate formation and their inhibition by polyphenols. Int J Legal Med. 2016;130:139–46. doi: 10.1007/s00414-015-1159-5. [DOI] [PubMed] [Google Scholar]
- 16.Del Boca FK, Darkes J. The validity of self-reports of alcohol consumption: State of the science and challenges for research. Addiction. 2003;98(Suppl 2):1–12. doi: 10.1046/j.1359-6357.2003.00586.x. [DOI] [PubMed] [Google Scholar]
- 17.Sobell LC, Sobell MB. Timeline follow-back. In: Litten RZ, Allen JP, editors. Measuring Alcohol Consumption: Psychosocial and Biochemical Methods. Totowa, NJ: Humana Press; 1992. pp. 41–72. [Google Scholar]
- 18.Core RR. A language and environment for statistical computing. Vienna, Austria: R Foundation for Statistical Computing; 2015. [Google Scholar]
- 19.Carpenter J, Bithell J. Bootstrap confidence intervals: When, which, what? A practical guide for medical statisticians. Stat Med. 2000;19:1141–64. doi: 10.1002/(sici)1097-0258(20000515)19:9<1141::aid-sim479>3.0.co;2-f. [DOI] [PubMed] [Google Scholar]
- 20.McIntosh MW, Pepe MS. Combining several screening tests: Optimality of the risk score. Biometrics. 2002;58:657–64. doi: 10.1111/j.0006-341x.2002.00657.x. [DOI] [PubMed] [Google Scholar]
- 21.Youden WJ. Index for rating diagnostic tests. Cancer. 1950;3:32–5. doi: 10.1002/1097-0142(1950)3:1<32::aid-cncr2820030106>3.0.co;2-3. [DOI] [PubMed] [Google Scholar]
- 22.DeLong ER, DeLong DM, Clarke-Pearson DL. Comparing the areas under two or more correlated receiver operating characteristic curves: A nonparametric approach. Biometrics. 1988;44:837–45. [PubMed] [Google Scholar]
- 23.Hajian-Tilaki K. Receiver operating characteristic (ROC) curve analysis for medical diagnostic test evaluation. Caspian J Intern Med. 2013;4:627–35. [PMC free article] [PubMed] [Google Scholar]
- 24.Brodersen KH, Ong CS, Stephan KE, Buhmann JM. The Balanced Accuracy and Its Posterior Distribution, in Proceedings of the 2010, 20th International Conference on Pattern Recognition. IEEE Computer Society. 2010:3121–4. [Google Scholar]
- 25.Florkowski CM. Sensitivity, specificity, receiver-operating characteristic (ROC) curves and likelihood ratios: Communicating the performance of diagnostic tests. Clin Biochem Rev. 2008;29(Suppl 1):S83–7. [PMC free article] [PubMed] [Google Scholar]
- 26.Marill KA. Advanced statistics: Linear regression, part II: Multiple linear regression. Acad Emerg Med. 2004;11:94–102. doi: 10.1197/j.aem.2003.09.006. [DOI] [PubMed] [Google Scholar]
- 27.Helander A, Dahl H. Urinary tract infection: A risk factor for false-negative urinary ethyl glucuronide but not ethyl sulfate in the detection of recent alcohol consumption. Clin Chem. 2005;51:1728–30. doi: 10.1373/clinchem.2005.051565. [DOI] [PubMed] [Google Scholar]
- 28.Helander A, Olsson I, Dahl H. Postcollection synthesis of ethyl glucuronide by bacteria in urine may cause false identification of alcohol consumption. Clin Chem. 2007;53:1855–7. doi: 10.1373/clinchem.2007.089482. [DOI] [PubMed] [Google Scholar]
- 29.Grimes DA, Schulz KF. Refining clinical diagnosis with likelihood ratios. Lancet. 2005;365:1500–5. doi: 10.1016/S0140-6736(05)66422-7. [DOI] [PubMed] [Google Scholar]
- 30.Høiseth G, Bernard JP, Karinen R, Johnsen L, Helander A, Christophersen AS, et al. A pharmacokinetic study of ethyl glucuronide in blood and urine: Applications to forensic toxicology. Forensic Sci Int. 2007;172:119–24. doi: 10.1016/j.forsciint.2007.01.005. [DOI] [PubMed] [Google Scholar]
- 31.Li TK, Yin SJ, Crabb DW, O’Connor S, Ramchandani VA. Genetic and environmental influences on alcohol metabolism in humans. Alcohol Clin Exp Res. 2001;25:136–44. [PubMed] [Google Scholar]


