

Abstract
Manganese is an essential dietary nutrient and trace element with important roles in mammalian development, metabolism, and antioxidant defense. In healthy individuals, gastrointestinal absorption and hepatobiliary excretion are tightly regulated to maintain systemic manganese concentrations at physiologic levels. Interactions of manganese with other essential metals following high dose ingestion are incompletely understood. We previously reported that gavage manganese exposure in rats resulted in higher tissue manganese concentrations when compared with equivalent dietary or drinking water manganese exposures. In this study, we performed follow-up evaluations to determine whether oral manganese exposure perturbs iron, copper, or zinc tissue concentrations. Rats were exposed to a control diet with 10 ppm manganese or dietary, drinking water, or gavage exposure to approximately 11.1 mg manganese/kg body weight/day for 7 or 61 exposure days. While manganese exposure affected levels of all metals, particularly in the frontal cortex and liver, copper levels were most prominently affected. This result suggests an under-appreciated effect of manganese exposure on copper homeostasis which may contribute to our understanding of the pathophysiology of manganese toxicity.
Keywords: Manganese, copper, iron, zinc, exposure
Introduction
Manganese (Mn), an essential trace element, is involved in a variety of enzymatic and cellular processes required for normal growth and development (Roth, 2006). Mn tissue concentrations are maintained within a narrow physiological range through regulation of processes involved in its absorption, distribution, and excretion (Aschner and Aschner 2005). Ingestion from dietary sources is the principle route of Mn acquisition and is regulated mainly by the gastrointestinal and hepatobiliary systems (Aschner and Aschner 2005; ATSDR, 2012). However, Mn is toxic when excess intake and retention occur. Those at risk for developing Mn toxicity include individuals with hepatic dysfunction, individuals with inherited defects in Mn excretion, and manganese miners and welders (Butterworth 2010; Quadri et al. 2012). Affected individuals develop Mn-induced neurotoxicity, known as manganism, with symptoms resembling Parkinson’s disease (Racette 2014).
There is growing epidemiological data suggesting that ingestion of Mn can be neurotoxic, especially to younger populations (Woolf et al. 2002; Wasserman et al. 2006; Bouchard et al. 2011; Oulhote et al. 2014). There is also growing evidence that the rate of Mn intake following ingestion may be an important risk factor. For example, Bouchard reported that Mn intake from water, but not diet, correlated significantly with Mn deposition in children’s hair samples (Bouchard et al. 2011). We previously performed a pharmacokinetic evaluation of the equivalency of gavage, dietary, and drinking water exposure to Mn in rats (Foster et al. 2015). Male F334 rats were exposed to approximately 11.1 mg Mn/kg body weight/day through diet, water, or gavage for 7 or 61 days, then analyzed for tissue and fluid Mn levels. Gavage resulted in an approximate doubling of brain Mn concentration, a change that is often observed following prolonged inhalation (Foster et al., 2015). The rate at which Mn reached steady-state levels differed by tissue, which may reflect tissue-specific differences in metal storage capacity and rates of saturation. Relative to gavage, dietary and water exposures resulted in fewer increases in tissue Mn concentrations.
Essential metals often share similar transport mechanisms (Ehrnstorfer et al. 2014). For example, both Mn and iron (Fe) can be transported into the cell by the transferrin cycle and by divalent metal transporter 1 (DMT1) (Roth, 2006; Gunter et al. 2013). DMT1 can also transport copper (Cu) and zinc (Zn) and is expressed in most organs and cell types (Zheng et al. 2012). Ferroportin, a cellular Fe exporter essential for dietary Fe absorption, has also been implicated in Mn transport (Madejczyk and Ballatori, 2012). These observations suggest that Mn ingestion will likely perturb tissue levels of Fe, Cu, and Zn. Here we report and discuss tissue Fe, Cu, and Zn levels in rats exposed to 11.1 mg Mn/kg body weight/day through diet, water, or gavage for 7 or 61 days.
Materials and Methods
This study built on a previous study evaluating the pharmacokinetic equivalency of dietary, drinking water and gavage Mn exposures in male F344 rats (Foster et al., 2015). Briefly, 9–11 seven-week-old rats were exposed to four different regimens: control (AIN-93G diet with 10 ppm Mn); high-dose diet (AIN-93G diet with 200 ppm Mn, intake equivalent to 11.1 mg Mn/kg body weight/day); high-dose drinking water (AIN-93G diet with 10 ppm Mn diet and drinking water supplemented with MnCl2 to achieve daily intake equivalent to the 200 ppm Mn diet group); and high-dose gavage (AIN-93G diet with 10 ppm Mn diet and once-daily gavage to achieve a daily intake equivalent to the 200 ppm Mn diet group). Nominal Fe, Cu, and Zn concentrations in the AIN-93G diet were 40, 6.0, and 35 ppm, respectively. After 7 or 61 exposure days, rats were euthanized and serum, bile, liver, spleen, femur, frontal cortex, striatum, and cerebellum were collected, flash-frozen, and stored at −80°C until digestion. In the present study, harvested samples were analyzed further for Fe, Cu and Zn levels by graphite furnace atomic absorption spectrometry (GF-AAS) using previously described methods (Foster et al., 2015). Statistical outliers were identified using Hoaglin and Iglewicz resistant rules for outlier labeling with k = 2.2 (Hoaglin and Iglewicz 1987). Tissue metal concentrations at each time point were inter-compared for each exposure group using one-way analysis of variance (ANOVA), using Dunn’s or Dunnett’s method in SigmaPlot 12.5. Additionally, Student’s T-test was performed in Excel to determine if the 61 day exposure values differed significantly from the 7 day exposure values (P < 0.05). Outlier labeling and standard error of the mean were calculated in Excel 2013. Tissue and fluid Mn concentrations were previously reported (Foster et al., 2015).
Results
Cu, Fe, and Zn tissue concentrations in Mn-exposed rats are presented in Table 1 and Supplementary Tables 1 and 2. Depending on the exposure regimen, high dose Mn exposure resulted in multiple (3–6) tissues with altered Cu levels, 2–4 tissues with altered Zn levels, and 1–2 tissues with altered Fe levels suggesting that Mn exposure most broadly affected tissue Cu levels. Gavage Mn exposure altered metal levels in more tissues than did either high-dose dietary or drinking water Mn exposure, consistent with our previous observation that gavage resulted in the greatest number of tissues with altered Mn levels (Foster et al. 2015).
Table 1.
Tissue Cu concentrations (μg metal/g wet tissue) after 7 or 61 days of Mn exposure.
| Tissue | Days | Control | Diet | Water | Gavage |
|---|---|---|---|---|---|
| Cerebellum | 7 | 5.28 ± 0.21 (9) | 5.74 ± 0.12 (8) | 5.49 ±0.14 (9) | 5.91 ±0.20 (11)b |
| 61 | 67.82 ± 2.36 (8) * | 80.56 ± 6.53 (9) b | 76.69 ± 4.05 (9) | 69.49 ± 5.55 (10) b | |
| Striatum | 7 | 58.45 ± 1.17 (6) | 53.17 ± 1.45 (7) | 56.43 ± 0.35 (6) | 54.24 ± 1.59 (10)b |
| 61 | 60.39 ± 4.25 (8) | 47.90 ± 2.25 (9)a | 51.54 ± 2.64 (9) | 55.95 ± 1.85 (10)b | |
| Frontal cortex | 7 | 1.32 ± 0.04 (8) | 1.30 ± 0.06 (9) | 1.37 ± 0.07 (9) | 1.43 ± 0.16 (11) |
| 61 | 1.51 ± 0.01 (6) * | 1.63 ± 0.04 (9) | 1.48 ± 0.03(9) | 2.13 ± 0.14 (10) ab | |
| Bile | 7 | 62.42 ± 7.26 (6) | 11.91 ± 5.78 (7)ab | 44.04 ± 10.63 (5) | 31.63 ± 10.25 (7)a |
| 61 | 56.23 ± 2.34 (8) | 54.17 ± 5.13 (7) b | 60.33 ± 4.49 (9)b | 77.15 ± 7.49 (10) ab | |
| Serum | 7 | 67.44 ± 2.53 (8) | 61.35 ± 4.89 (8) | 71.00 ± 6.69 (8) | 81.48 ± 5.42 (11) |
| 61 | 68.99 ± 2.40 (9) | 71.90 ± 3.36 (9) | 68.17 ± 1.80 (9) | 65.59 ± 1.69 (10) | |
| Femur | 7 | 1.06 ± 0.13 (9) | 0.97 ± 0.06 (9) | 0.84 ± 0.05 (8) | 0.78 ± 0.15 (8)b |
| 61 | 0.55 ± 0.02 (7) * | 0.53 ± 0.04 (9) | 0.52 ± 0.03 (9) | 0.38 ± 0.04 (10) ab | |
| Spleen | 7 | 1.15 ± 0.03 (9) | 1.06 ± 0.03 (9)a | 1.03 ± 0.02 (9)a | 0.99 ± 0.02 (11)a |
| 61 | 0.92 ± 0.04 (9) * | 1.01 ± 0.03 (9) | 1.14 ± 0.06 (9)a | 1.05 ± 0.02 (10) | |
| Liver | 7 | 4.57 ± 0.06 (7) | 5.91 ± 0.13 (8)ab | 6.53 ± 0.17 (9)ab | 7.08 ± 0.21 (11)ab |
| 61 | 4.68 ± 0.19 (9) | 4.77 ± 0.26 (9) b | 4.31 ± 0.10 (9) | 4.80 ± 0.10 (9) b |
Data are presented as mean ± SEM. Number of samples are indicated in parentheses.
Significant change in Cu levels (P<.05 by Student’s T-test) in control group at 61 vs. 7 days
P≤.05 for Cu levels versus controls by ANOVA.
P≤.05 for previously measured Mn levels versus controls by ANOVA.
Cu, Fe and Zn levels in the liver were significantly affected by high dose Mn exposure. Following the 7-day Mn exposure, liver Mn and Cu levels were increased in all high dose Mn-exposed groups while Fe and Zn levels were only increased in the gavage-exposed rats (Figure 1A). Following the 61-day Mn exposure, Mn levels remained increased in all Mn-exposed groups while Cu, Fe, and Zn levels for all Mn-exposed groups had normalized (Figure 1B). Following the 7-day Mn exposure, when liver Cu levels were increased in all Mn-exposed groups, bile Cu levels were decreased in diet- and gavage-exposed groups. After 61 days of Mn exposure, liver Cu levels for all Mn-exposed groups had normalized and bile Cu levels were increased in the gavage-exposed rats (Figure 2). Mn levels were increased in the liver of all Mn-treated rats at 7-days, but in contrast to Cu levels, remained increased at 61-days (Foster et al. 2015). These results suggest a novel or at very least an underappreciated relationship between Mn and Cu hepatobiliary metabolism.
Fig. 1.
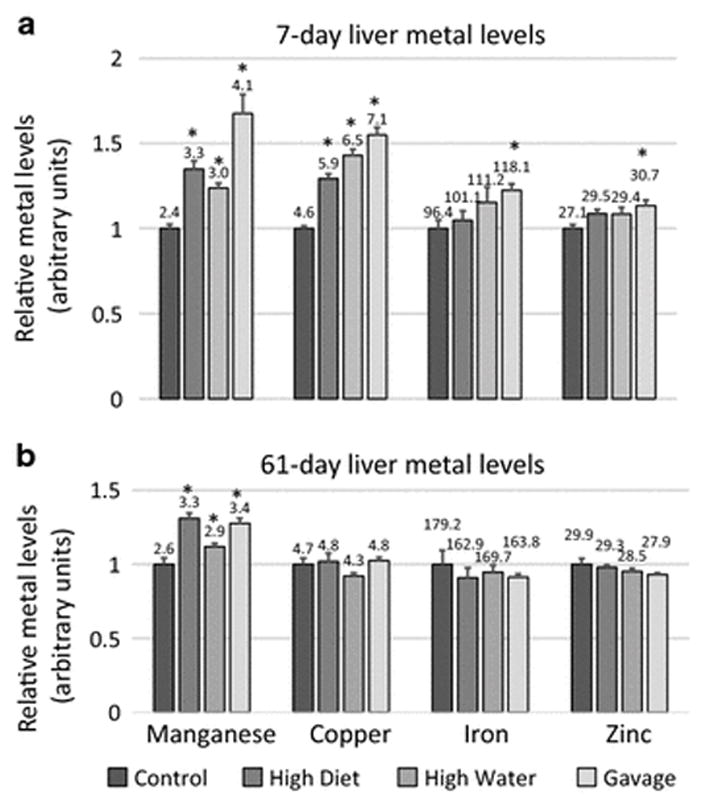
Relative manganese, copper, iron, and zinc levels for the livers of 7-day (a) and 61-day (b) manganese (Mn)-exposed rats. Mean high diet, high water and gavage metal levels (+/− SEM) were normalized to control levels. Numbers indicate mean metal values (μg metal/g wet tissue). * indicates p ≤ 0.05 by ANOVA versus controls of each group. Mn data is reproduced here from Foster et al., 2015 for purposes of comparison
Fig. 2.
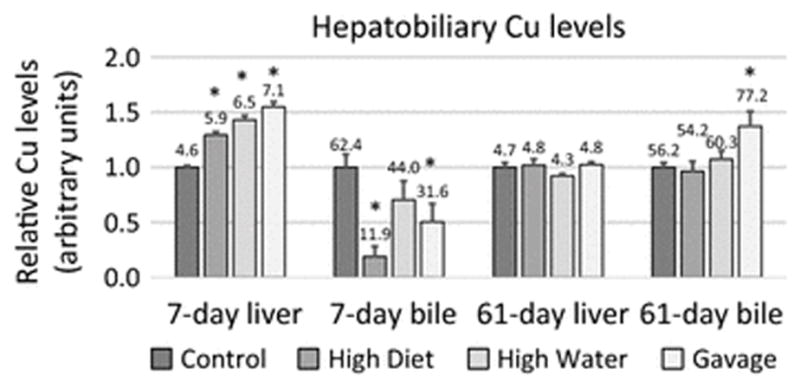
Relative copper levels in the liver and bile of 7- and 61-day manganese (Mn)-exposed rats. Mean copper (Cu) levels (+/− SEM) were normalized to control levels. Numbers indicate mean copper levels (μg Cu/g liver or μg Cu/dL bile). * indicates p ≤ 0.05 by ANOVA versus controls of each group. Liver data from Figure 1 is reproduced here to present complete hepatobiliary trend
Another well-known target tissue of Mn exposure is the frontal cortex. For example, following Mn exposure, this dopaminergic region of the brain exhibits alpha-synuclein aggregation, a defining pathological feature of Parkinson’s disease (Verina et al. 2013). In our study, the frontal cortex showed accumulation of Cu, Fe, and Zn after 61-day gavage exposure, but there were no changes in Cu, Fe, or Zn levels following 7-day exposure (Figure 3, Supplementary Tables 1 and 2). Potential implications of this finding are discussed below.
Fig. 3.
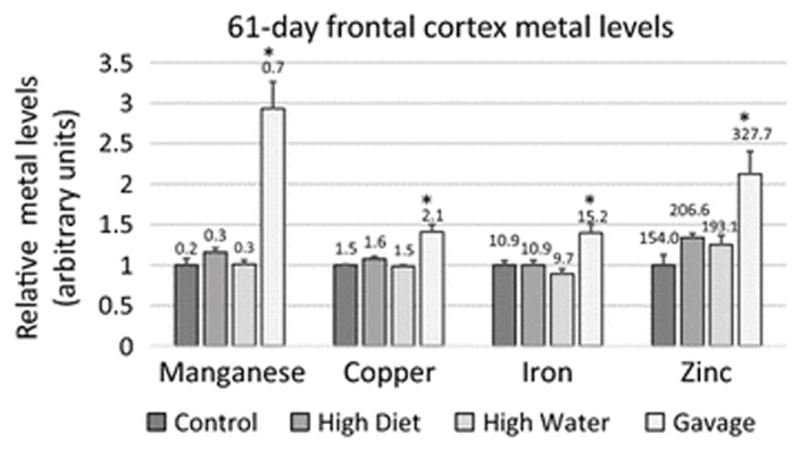
Relative manganese, copper, iron, and zinc levels for the frontal cortex of 61-day manganese (Mn)-exposed rats. Mean Mn-exposed metal levels (+/− SEM) were normalized to control levels. Numbers indicate mean metal values (μg metal/g wet tissue). * indicates p ≤ 0.05 by ANOVA versus controls of each group. Mn data is reproduced here from Foster et al., 2015 for purposes of comparison
Also observed in our study were changes in several tissue metal concentrations between the 7- and 61- day control groups. Liver Fe, spleen Mn, Fe, and Cu, femur Fe, Cu, and Zn, serum Fe and Zn, bile Mn, frontal cortex Cu and Zn, striatum Mn and Zn, and cerebellum Mn, Fe, Cu, and Zn levels all increased between the 7- and 61-day control groups (Table 1, Supplementary Tables 1 and 2). This phenomenon has been previously reported in rats in spleen and brain (Borràs 1998; Tarohda et al. 2005).
Discussion
The objective of this study was to determine if Mn exposure affects tissue levels of other essential metals. To accomplish this, Cu, Fe, and Zn levels were measured in tissues collected during our previous pharmacokinetic study in which male Sprague-Dawley rats were treated with 11.1 mg Mn/kg/day through either diet, water, or gavage for 7 or 61 exposure days (Foster et al. 2015). In the original study, no adverse clinical effects were seen but gavage-treated groups presented an approximate doubling in Mn concentration in brain regions. The rate at which tissues reached steady-state levels differed by tissue, possibly due to tissue-specific differences in metal storage capacity (Nong et al. 2009). Mn exposure through diet and water affected fewer tissue Mn levels when compared with gavage. Similarly, in the current study, Mn gavage impacted Cu, Fe and Zn levels in a greater number of tissues compared to dietary and drinking water exposure. One of the affected tissues was frontal cortex, a region known to exhibit neuronal degeneration and other pathologies following in vivo Mn exposure in non-human primates (Guilarte et al. 2008). Notably, oral Mn exposure in rats has recently been shown to influence Cu, Fe and Zn levels in other brain regions (Mullin et al. 2015). Metal excess in frontal cortex after Mn exposure may have implications for the interpretation of magnetic resonance imaging (MRI) findings following Mn exposure. As Mn is paramagnetic, high signal intensities in T1-weighted MRIs have been used as a biomarker for brain Mn accumulation (Fitsanakis et al. 2006). Since Cu and Fe are also paramagnetic, MRI hyperintensities may not solely reflect brain Mn accumulation in Mn-exposed patients (Moldovan et al. 2013). Investigating the effect of Mn on other essential metals is also important for understanding the potential effects of Mn injections used for Mn-enhanced MRIs on homeostasis of other essential metals (Moldovan et al. 2013). Moreover, elevated brain Cu, Zn, and Fe are also risk factors for certain forms of neurodegeneration (Jomova et al. 2010; Salvador et al. 2010; Dusek et al. 2015) suggesting that neurologic effects seen in people with manganism may be complicated by Mn interactions with other essential metals.
Our analysis also revealed that Cu levels were increased in liver in diet-, water-, and gavage-exposed groups but decreased in the bile in diet- and gavage-exposed groups after 7 days of exposure. By 61 days, Cu levels had normalized in liver but increased in bile in gavage-exposed rats. This result may suggest a novel relationship between Mn and Cu hepatobiliary excretion. One possibility is liver Mn excess impedes hepatobiliary Cu excretion, resulting in liver Cu excess and bile Cu deficiency. Although hepatobiliary Mn and Cu excretion are not known to share common molecular mechanisms, previous studies have shown that Mn exposure results in an increase in RNA levels of Cu influx protein CTR1 and a decrease in RNA levels of Cu efflux proteins ATP7A and ATP7B in the blood brain barrier and blood-CSF barrier using in situ brain infusion in Sprague-Dawley rats (Zheng et al. 2012; Fu et al. 2014). In the present study, quantitative PCR did not detect altered liver CTR1, ATP7A or ATP7B RNA levels between control or gavage-exposed rats after seven days (data not shown). A potential relationship between Mn and Cu hepatobiliary excretion is not well understood and may warrant further study.
Supplementary Material
Acknowledgments
The authors thank Drs. David Murray, Joseph Orchardo, and Soumen Mallick for assistance with metal measurements and the staff of the NCSU Laboratory Animal Resources facility for their contributions. This publication is based on a study sponsored and funded by the Afton Chemical Corporation.
Contributor Information
Courtney J. Mercadante, Department of Pathology and Laboratory Medicine, Brown University, Providence, RI 02912, USA
Carolina Herrera, Department of Pathology and Laboratory Medicine, Brown University, Providence, RI 02912, USA.
Michael A. Pettiglio, Department of Pathology and Laboratory Medicine, Brown University, Providence, RI 02912, USA
Melanie L. Foster, College of Veterinary Medicine, North Carolina State University, Raleigh, NC 27607, USA
Laura C. Johnson, College of Veterinary Medicine, North Carolina State University, Raleigh, NC 27607, USA
David C. Dorman, College of Veterinary Medicine, North Carolina State University, Raleigh, NC 27607, USA
Thomas B. Bartnikas, Department of Pathology and Laboratory Medicine, Brown University, Providence, RI 02912, USA.
References
- Aschner JL, Aschner M. Nutritional aspects of manganese homeostasis. Mol Aspects Med. 2005;26:353–362. doi: 10.1016/j.mam.2005.07.003. [DOI] [PMC free article] [PubMed] [Google Scholar]
- Borràs M. Hormone dependency of splenic iron stores in the rat: effect of oestrogens on the recuperation of reserves in ferrodeficient subjects. Lab Anim. 1998;32:290–297. doi: 10.1258/002367798780559275. [DOI] [PubMed] [Google Scholar]
- Bouchard MF, Sauvé S, Barbeau B, et al. Intellectual Impairment in School-Age Children Exposed to Manganese from Drinking Water. Environ Health Perspect. 2011;119:138–143. doi: 10.1289/ehp.1002321. [DOI] [PMC free article] [PubMed] [Google Scholar]
- Butterworth RF. Metal toxicity, liver disease and neurodegeneration. Neurotox Res. 2010;18:100–105. doi: 10.1007/s12640-010-9185-z. [DOI] [PubMed] [Google Scholar]
- Dusek P, Roos PM, Litwin T, et al. The neurotoxicity of iron, copper and manganese in Parkinson’s and Wilson’s diseases. J Trace Elem Med Biol. 2015;31:193–203. doi: 10.1016/j.jtemb.2014.05.007. [DOI] [PubMed] [Google Scholar]
- Ehrnstorfer IA, Geertsma ER, Pardon E, et al. Crystal structure of a SLC11 (NRAMP) transporter reveals the basis for transition-metal ion transport. Nat Struct Mol Biol. 2014;21:990–996. doi: 10.1038/nsmb.2904. [DOI] [PubMed] [Google Scholar]
- Fitsanakis VA, Zhang N, Avison MJ, et al. The use of magnetic resonance imaging (MRI) in the study of manganese neurotoxicity. NeuroToxicology. 2006;27:798–806. doi: 10.1016/j.neuro.2006.03.001. [DOI] [PubMed] [Google Scholar]
- Foster ML, Bartnikas TB, Johnson LC, et al. Pharmacokinetic Evaluation of the Equivalency of Gavage, Dietary, and Drinking Water Exposure to Manganese in F344 Rats. Toxicol Sci. 2015;145:244–251. doi: 10.1093/toxsci/kfv047. [DOI] [PMC free article] [PubMed] [Google Scholar]
- Fu X, Zhang Y, Jiang W, et al. Regulation of Copper Transport Crossing Brain Barrier Systems by Cu-ATPases: Effect of Manganese Exposure. Toxicol Sci. 2014;139:432–451. doi: 10.1093/toxsci/kfu048. [DOI] [PMC free article] [PubMed] [Google Scholar]
- Guilarte TR, Burton NC, Verina T, et al. Increased APLP1 expression and neurodegeneration in the frontal cortex of manganese-exposed non-human primates. J Neurochem. 2008;105:1948–1959. doi: 10.1111/j.1471-4159.2008.05295.x. [DOI] [PMC free article] [PubMed] [Google Scholar]
- Gunter TE, Gerstner B, Gunter KK, et al. Manganese transport via the transferrin mechanism. Neurotoxicology. 2013;34:118–127. doi: 10.1016/j.neuro.2012.10.018. [DOI] [PMC free article] [PubMed] [Google Scholar]
- Hoaglin DC, Iglewicz B. Fine-Tuning Some Resistant Rules for Outlier Labeling. J Am Stat Assoc. 1987;82:1147–1149. doi: 10.1080/01621459.1987.10478551. [DOI] [Google Scholar]
- Jomova K, Vondrakova D, Lawson M, Valko M. Metals, oxidative stress and neurodegenerative disorders. Mol Cell Biochem. 2010;345:91–104. doi: 10.1007/s11010-010-0563-x. [DOI] [PubMed] [Google Scholar]
- Moldovan N, Al-Ebraheem A, Miksys NA, et al. Altered transition metal homeostasis in mice following manganese injections for manganese-enhanced magnetic resonance imaging. Biometals Int J Role Met Ions Biol Biochem Med. 2013;26:179–187. doi: 10.1007/s10534-012-9605-z. [DOI] [PubMed] [Google Scholar]
- Mullin EJ, Wegst-Uhrich SR, Ding D, et al. Effect of manganese treatment on the accumulation on biologically relevant metals in rat cochlea and brain by inductively coupled plasma mass spectrometry. Biometals Int J Role Met Ions Biol Biochem Med. 2015 doi: 10.1007/s10534-015-9885-1. [DOI] [PubMed] [Google Scholar]
- Nong A, Taylor MD, Clewell HJ, et al. Manganese Tissue Dosimetry in Rats and Monkeys: Accounting for Dietary and Inhaled Mn with Physiologically based Pharmacokinetic Modeling. Toxicol Sci. 2009;108:22–34. doi: 10.1093/toxsci/kfn264. [DOI] [PubMed] [Google Scholar]
- Oulhote Y, Mergler D, Barbeau B, et al. Neurobehavioral Function in School-Age Children Exposed to Manganese in Drinking Water. Environ Health Perspect. 2014;122:1343–1350. doi: 10.1289/ehp.1307918. [DOI] [PMC free article] [PubMed] [Google Scholar]
- Quadri M, Federico A, Zhao T, et al. Mutations in SLC30A10 Cause Parkinsonism and Dystonia with Hypermanganesemia, Polycythemia, and Chronic Liver Disease. Am J Hum Genet. 2012;90:467–477. doi: 10.1016/j.ajhg.2012.01.017. [DOI] [PMC free article] [PubMed] [Google Scholar]
- Racette BA. Manganism in the 21st century: The Hanninen lecture. NeuroToxicology. 2014;45:201–207. doi: 10.1016/j.neuro.2013.09.007. [DOI] [PMC free article] [PubMed] [Google Scholar]
- Salvador GA, Uranga RM, Giusto NM. Iron and Mechanisms of Neurotoxicity. Int J Alzheimers Dis. 2010 doi: 10.4061/2011/720658. [DOI] [PMC free article] [PubMed] [Google Scholar]
- Tarohda T, Ishida Y, Kawai K, et al. Regional distributions of manganese, iron, copper, and zinc in the brains of 6-hydroxydopamine-induced parkinsonian rats. Anal Bioanal Chem. 2005;383:224–234. doi: 10.1007/s00216-005-3423-x. [DOI] [PubMed] [Google Scholar]
- Verina T, Schneider JS, Guilarte TR. Manganese exposure induces α-synuclein aggregation in the frontal cortex of non-human primates. Toxicol Lett. 2013;217:177–183. doi: 10.1016/j.toxlet.2012.12.006. [DOI] [PMC free article] [PubMed] [Google Scholar]
- Wasserman GA, Liu X, Parvez F, et al. Water Manganese Exposure and Children’s Intellectual Function in Araihazar, Bangladesh. Environ Health Perspect. 2006;114:124–129. doi: 10.1289/ehp.8030. [DOI] [PMC free article] [PubMed] [Google Scholar]
- Woolf A, Wright R, Amarasiriwardena C, Bellinger D. A child with chronic manganese exposure from drinking water. Environ Health Perspect. 2002;110:613–616. doi: 10.1289/ehp.02110613. [DOI] [PMC free article] [PubMed] [Google Scholar]
- Zheng G, Chen J, Zheng W. Relative contribution of CTR1 and DMT1 in copper transport by the blood-CSF barrier: implication in manganese-induced neurotoxicity. Toxicol Appl Pharmacol. 2012;260:285–293. doi: 10.1016/j.taap.2012.03.006. [DOI] [PMC free article] [PubMed] [Google Scholar]
Associated Data
This section collects any data citations, data availability statements, or supplementary materials included in this article.