

Abstract
Background and purpose
In-hospital death following total hip arthroplasty (THA) is related to comorbidity. The long-term effect of comorbidity on all-cause mortality is, however, unknown for this group of patients and it was investigated in this study.
Patients and methods
We used data from the Swedish Hip Arthroplasty Register, linked to the National Patient Register from the National Board of Health and Welfare, for patients operated on with THA in 1999–2012. We identified 120,836 THAs that could be included in the study. We evaluated the predictive power of the Charlson and Elixhauser comorbidity indices on mortality, using concordance indices calculated after 5, 8, and 14 years after THA.
Results
All comorbidity indices performed poorly as predictors, in fact worse than a base model with age and sex only. Elixhauser was, however, the least bad choice and it predicted mortality with concordance indices 0.59, 0.58, and 0.56 for 5, 8, and 14 years after THA.
Interpretation
Comorbidity indices are poor predictors of long-term mortality after THA.
The use of comorbidity as a predictor of various clinical outcomes has increased exponentially during the last 20 years for patients with total hip arthroplasty (THA).
The predictive power of comorbidity has been investigated for perioperative, in-hospital, and short-term mortality (Menendez et al. 2015), 90-day postoperative mortality (Bozic et al. 2012), pain level, functional abilities, hospital costs (Lavernia et al. 2009), periprosthetic joint infection (Bozic et al. 2012), reoperations (Gordon et al. 2013), and patient-reported outcomes (PROMs) (Greene et al. 2015).
Current methods for capturing comorbidity, such as the Charlson and Elixhauser comorbidity indices, were originally developed for in-hospital or short-term mortality occurring in a time frame close to when the comorbidities were recorded. The same indices are currently used for prediction of long-term mortality also, but this is in fact a different matter.
Most studies have found no or little evidence that comorbidity influences any clinical outcome. It has nevertheless been suggested that mortality should be adjusted for comorbidity, but it is our belief that this recommendation is unjustified. Elective THA is offered mainly to healthy individuals. Mortality in these patients is lower than in the general population (Michet et al. 2017). Our hypothesis was therefore that risk factors for mortality in these patients might appear after—and not before—surgery.
To test this hypothesis, we analyzed the predictive power of comorbidity on long-term mortality for THA patients from the Swedish Hip Arthroplasty Register.
Patients and methods
Patients
We identified 120,836 patients from the Swedish Hip Arthroplasty Register (SHAR) who underwent THA in the period 1999–2012 and who matched our inclusion criteria (Figure 1). These patients were linked to the Swedish National Patient Register (NPR), which is under the administration of the National Board of Health and Welfare. ICD-10 codes were extracted from this registry if they were linked to hospital visits within 1 year before THA. The data set has been described in detail by Cnudde et al. (2016).
Figure 1.
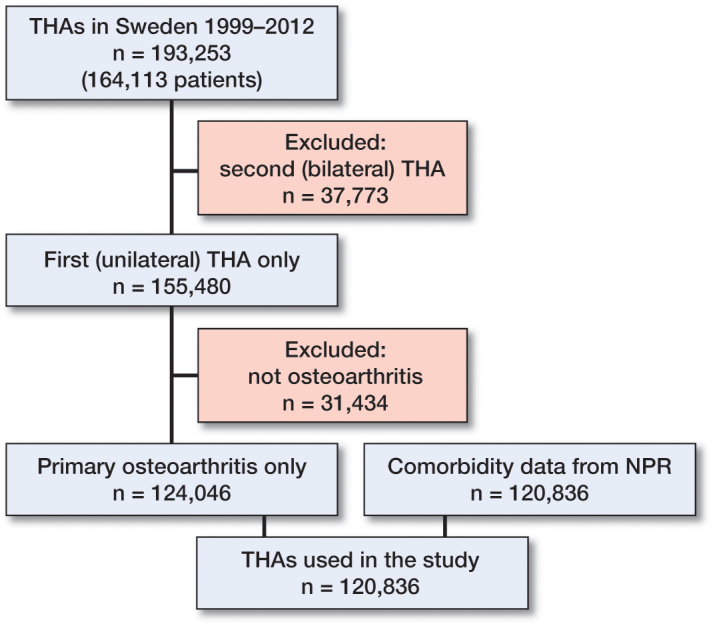
Flow chart describing inclusion criteria for study population.
Comorbidity indices
Individual ICD-10 codes were first identified as different comorbidities, which were then combined into 3 comorbidity indices for each patient: (1) the original Charlson comorbidity index, with 17 categories coded according to ICD-10 (Quan et al. 2005); (2) the updated Charlson comorbidity index, which is similar but simplified to 12 categories (Quan et al. 2011); and the Elixhauser (1998) comorbidity index, which is coded with ICD-10 codes (Quan et al. 2005) with an unweighted index (Moltó and Dougados 2014).
Some comorbidities are included by both the Elixhauser and the Charlson classification, but with different inclusion criteria (Quan et al. 2005). For example, complications in patients with diabetes should be chronical according to Charlson, but not necessarily so according to Elixhauser. The 2 diabetes groups are therefore not directly comparable between the 2 classifications.
Survival analysis
We fitted 51 univariate Cox models to the data, 1 for each Elixhauser and Charlson category and 1 each for the 3 indices. We found, however, that the proportional-hazard assumption was not met for several models.
We therefore used Schoenfeldt residual plots to identify common patterns among all models and found proportional hazards within subintervals of 0–5, 5–8 and 8–14 years after THA. We refitted an extended Cox model with stepwise time varying coefficient (Therneau and Crowson 2013) to these intervals.
Each univariate model was accompanied by a corresponding model including age and sex. A base model with only age and sex was also fitted for reference.
Concordance index
The predictive power of comorbidity on mortality was evaluated by a concordance index for survival data (Heagerty and Zheng 2005). All models were characterized by their sensitivity and specificity, combined into receiver operating characteristic (ROC) curves, and summarized by their area under the curve (AUC). AUC values were calculated for each time point after THA, and a single summary measure for a whole period was calculated as a weighted index from time 0 to the end of each subinterval (5, 8, and 14 years after THA). Confidence intervals (95% CIs) were based on non-parametric bootstrap resampling, since no closed form expression has yet been proposed for the concordance index.
The value of the concordance index ranges from 0.5 to 1. A value of 0.5 means that the exposure adds nothing more than chance when predicting the risk of dying, while a value of 1 would indicate that death could be completely predicted by the model. Interpretation of the absolute value is subjective, but it is often assumed for studies in medicine that a value less than 0.7 is poor while 0.7–0.8 is good and 0.8–0.9 is excellent (with 0.9–1.0 being almost unachievable).
Software
We used R version 3.2 (R Core team, Vienna, Austria) with packages survival, risksetROC, tidyverse, modelr, and foreach for statistical analysis.
Ethics, funding and potential conflicts of interest
Ethics approval was obtained from the Central Ethical Review Board in Gothenburg, Sweden (decision 271-14). There was no external fundings for the project and no competing interest to declare.
Results
Of the 120,836 patients who matched our inclusion criteria, 101,415 (84%) survived during the whole follow-up period of up to14 years, while 19,421 (16%) had died (Table 1). High age and male sex were, as expected, associated with earlier death, and most comorbidities occurred more frequently in those who later died.
Table 1.
Characteristics of patients who survived the whole follow-up period of 14 years (column “Alive”) and patients who died during this period (column “Deceased”). Death was associated with age and sex but also with most comorbidities (indicated by small p-values). Values in parenthesis are percentages unless otherwise specified
| What | Alive |
Deceased |
p-value | ||
|---|---|---|---|---|---|
| N | 101,415 | 19,421 | |||
| Age, mean (SD) | 67.1 | (10.1) | 75.6 | (8.3) | < 0.001 |
| Male sex | 43,400 | (42.8) | 9,179 | (47.3) | < 0.001 |
| Elixhauser index | < 0.001 | ||||
| 0 | 64,972 | (64.1) | 11,739 | (60.4) | |
| 1 | 22,590 | (22.3) | 4,127 | (21.3) | |
| 2 | 9,314 | (9.2) | 2,129 | (11.0) | |
| 3+ | 4,539 | (4.5) | 1,426 | (7.3) | |
| Original Charlson index | < 0.001 | ||||
| 0 | 82,754 | (81.6) | 13,891 | (71.5) | |
| 1 | 11,629 | (11.5) | 2,855 | (14.7) | |
| 2 | 5,068 | (5.0) | 1,729 | (8.9) | |
| 3+ | 1,964 | (1.9) | 946 | (4.9) | |
| Updated Charlson index | < 0.001 | ||||
| 0 | 89,722 | (88.5) | 15,559 | (80.1) | |
| 1 | 5,737 | (5.7) | 1,231 | (6.3) | |
| 2 | 4,950 | (4.9) | 1,931 | (9.9) | |
| 3+ | 1,006 | (1.0) | 700 | (3.6) | |
| Elixhauser | |||||
| Congestive heart failure | 1,752 | (1.7) | 1,143 | (5.9) | < 0.001 |
| Cardiac arrhythmias | 5,114 | (5.0) | 1,760 | (9.1) | < 0.001 |
| Valvular disease | 1,450 | (1.4) | 496 | (2.6) | < 0.001 |
| Pulmonary circulation disorder | 292 | (0.3) | 90 | (0.5) | < 0.001 |
| Peripheral vascular disorder | 710 | (0.7) | 267 | (1.4) | < 0.001 |
| Hypertension uncomplicated | 21,790 | (21.5) | 3,083 | (15.9) | < 0.001 |
| Hypertension complicated | 573 | (0.6) | 223 | (1.1) | < 0.001 |
| Paralysis | 153 | (0.2) | 34 | (0.2) | 0.5 |
| Other neurological disorders | 865 | (0.9) | 276 | (1.4) | < 0.001 |
| Chronic pulmonary disease | 3,522 | (3.5) | 857 | (4.4) | < 0.001 |
| Diabetes uncomplicated | 5,040 | (5.0) | 1,185 | (6.1) | < 0.001 |
| Diabetes complicated | 938 | (0.9) | 338 | (1.7) | < 0.001 |
| Hypothyroidism | 2,435 | (2.4) | 364 | (1.9) | < 0.001 |
| Renal failure | 526 | (0.5) | 235 | (1.2) | < 0.001 |
| Liver disease | 384 | (0.4) | 107 | (0.6) | 0.001 |
| Peptic ulcer disease | 268 | (0.3) | 116 | (0.6) | < 0.001 |
| AIDS/HIV | 16 | (0.0) | 1 | (0.0) | 0.4 |
| Lymphoma | 252 | (0.2) | 93 | (0.5) | < 0.001 |
| Metastatic cancer | 142 | (0.1) | 148 | (0.8) | < 0.001 |
| Solid tumor | 3,111 | (3.1) | 1,136 | (5.8) | < 0.001 |
| Rheumatoid arthritis | 2,767 | (2.7) | 660 | (3.4) | < 0.001 |
| Coagulopathy | 281 | (0.3) | 84 | (0.4) | < 0.001 |
| Obesity | 1,753 | (1.7) | 120 | (0.6) | < 0.001 |
| Weight loss | 42 | (0.0) | 13 | (0.1) | 0.2 |
| Fluid electrolyte disorders | 271 | (0.3) | 90 | (0.5) | < 0.001 |
| Blood loss anemia | 51 | (0.1) | 28 | (0.1) | < 0.001 |
| Deficiency anemia | 509 | (0.5) | 152 | (0.8) | < 0.001 |
| Alcohol abuse | 327 | (0.3) | 114 | (0.6) | < 0.001 |
| Drug abuse | 124 | (0.1) | 26 | (0.1) | 0.8 |
| Psychoses | 151 | (0.1) | 34 | (0.2) | 0.5 |
| Depression | 1,151 | (1.1) | 192 | (1.0) | 0.1 |
| Charlson | |||||
| Myocardial infraction | 2,685 | (2.6) | 784 | (4.0) | < 0.001 |
| Congestive heart failure | 1,657 | (1.6) | 1,124 | (5.8) | < 0.001 |
| Peripheral vascular disease | 710 | (0.7) | 267 | (1.4) | < 0.001 |
| Cerebrovascular disease | 1,456 | (1.4) | 597 | (3.1) | < 0.001 |
| Dementia | 213 | (0.2) | 138 | (0.7) | < 0.001 |
| Chronic pulmonary disease | 3,522 | (3.5) | 857 | (4.4) | < 0.001 |
| Rheumatic disease | 2,253 | (2.2) | 566 | (2.9) | < 0.001 |
| Peptic ulcer disease | 501 | (0.5) | 220 | (1.1) | < 0.001 |
| Mild liver disease | 366 | (0.4) | 97 | (0.5) | 0.005 |
| Diabetes no complication | 5,179 | (5.1) | 1,231 | (6.3) | < 0.001 |
| Diabetes complication | 665 | (0.7) | 243 | (1.3) | < 0.001 |
| Hemiplegia or paraplegia | 153 | (0.2) | 34 | (0.2) | 0.5 |
| Renal disease | 540 | (0.5) | 237 | (1.2) | < 0.001 |
| Malignancy | 3,444 | (3.4) | 1,265 | (6.5) | < 0.001 |
| Moderate or severe liver disease | 34 | (0.0) | 21 | (0.1) | < 0.001 |
| Metastatic solid tumor | 142 | (0.1) | 148 | (0.8) | < 0.001 |
| AIDS/HIV | 16 | (0.0) | 1 | (0.0) | 0.4 |
Hazard ratios for individual comorbidities ranged from 0.7 for obesity to 13 for metastatic cancer. All concordance indices for individual comorbidities were close to 0.5 (Table 2, see Supplementary data). We omitted results for models with individual comorbidities combined with age and sex, since we felt that there was little added value in these models compared to the ones presented.
Hazard ratios
Confidence intervals for the hazard ratios indicated that all covariates evaluated, except obesity, weight loss, and AIDS/HIV, were associated with higher death rates within the first 5 years following THA.
Less comorbidities were associated with death 5–8 years after THA, and even fewer 8–14 years after THA.
Concordance indices (Figure 2)
Figure 2.
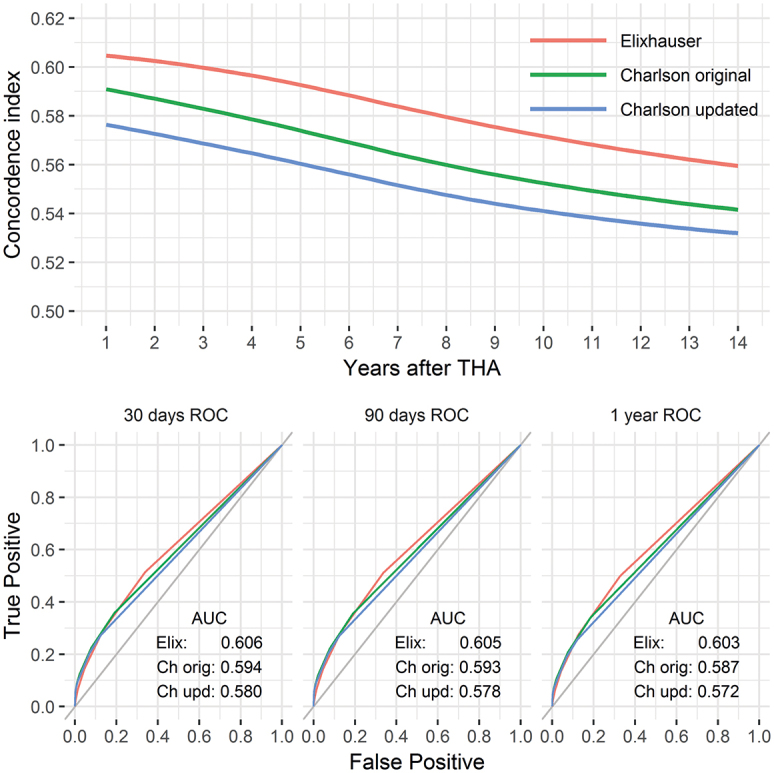
The predictive power of each comorbidity index summarized by the concordance index over time (upper panel). Absolute values are low and decreasing. Time-dependent ROC curves are shown below for 30, 90, and 365 days after THA. The relative order among the comorbidity indices was preserved throughout the entire period but their absolute differences were small.
The highest concordance indices, for a univariate comorbidity index model, were observed for the Elixhauser comorbidity index (0.59, 0.58, and 0.56 at 5, 8, and 14 years after THA). Second best was the original Charlson comorbidity index (0.58, 0.56, and 0.54), while its updated and simplified version performed slightly worse (0.56, 0.55, and 0.53).
As is apparent from Table 2 (see Supplementary data) and Figure 3, the base model, with age and sex alone, performed considerably better than all comorbidity indices (concordance indices 0.75, 0.74, and 0.74). Models including age and sex together with comorbidity indices were just marginally better than the base model (with concordance indices 0.76, 0.75, and 0.74 for all indices). These differences were most likely clinically irrelevant, although statistically significant for 5 and 8 years after THA (Figure 3).
Figure 3.
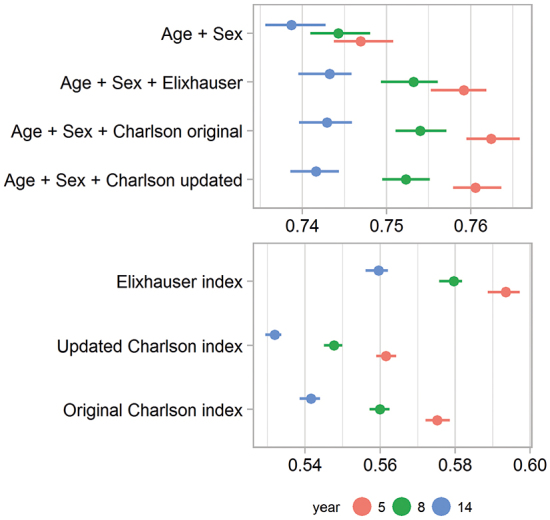
Concordance indices as a measure of predictive power for models with the 3 comorbidity indices, with and without inclusion of age and sex. A base model with age and sex alone was used as a reference. The confi dence intervals were based on non-parametric bootstrapping. They were all narrow, due to the large sample size.
Discussion
We found that comorbidity indices were weak predictors of mortality for Swedish patients with THA. Concordance indices were close to 0.5; hence, the models predicted death just marginally better than pure chance. We conclude that age and sex were much better predictors, especially for long-term mortality up to 14 years after surgery.
Comorbidities 1 year preoperatively
We used comorbidity data registered at hospital visits during the year before THA. We suspected that a shorter time frame might not capture all relevant comorbidities present at the time of THA. A much longer time frame, on the other hand, might lead to inclusion of old comorbidities that were no longer present by the time of THA.
We ran the analysis with a 1-, 2-, and 5-year comorbidity period before THA. The predictive power increased with length of the period, but this was only minimal (Figure 4, see Supplementary data). The shorter time frame of 1 year was therefore preferred for the sake of simplicity.
Individual comorbidities
Obesity was the only comorbidity with a reduced risk of death. A similar, counterintuitive, observation has been made previously (Menendez et al. 2014). It has been suggested that surgeons may select overweight patients for surgery only if they are otherwise healthier than non-obese patients (Hawker et al. 2013), which makes it difficult to generalize our findings. It has also been found that obesity has been heavily under-reported in administrative registers in the USA (Bohl et al. 2016). Length and weight was captured from the SHAR for 94% of our patients with THA after 2007. 22% of them had BMI ≥30, and were therefore obese. This, compared to only 1.5% obesity identified from the National Patient Register, is more in line with the Swedish general population of 70-year-olds.
Hypertension, lipid disease, Alzheimer’s disease, and other non-somatic conditions are also known to be under-reported in the National Patient Register (Ludvigsson et al. 2011). Depression was found in only 1% of our patients, but in one-third of all patients included in a Dutch study (Duivenvoorden et al. 2013).
It is also known that diabetes might be under-reported in the National Patient Register (Rawshani et al. 2014).
We had too few patients with weight loss and AIDS/HIV to observe hazard ratios different than 1.
All other comorbidities were related to increased death risk, but with weak predictive power.
Hazard ratios vs. concordance index
Hazard ratios that are relatively high can still have low predictive power (Pepe et al. 2004). The hazard ratios themselves do not characterize the discriminatory capacity of the comorbidities.
Patients with metastatic cancer, for example, have an almost 13-fold risk of dying during the first 5-year period, compared to those with cardiac arrhythmias with a hazard ratio less than 3. But mortality predictions apply to patients both with and without the conditions. There were 24 times as many patients with cardiac arrhythmias than metastatic cancer, and it is therefore no surprise that the former yielded a concordance index of 0.53, while the other had a lower value of 0.51.
Also, most deaths from metastatic cancer occurred already within 2 years of diagnosis. These patients were then withdrawn from the cohort, which meant rapidly reduced hazard ratios in the periods 5–8 years and 8–14 years, reflecting that cancer patients who survived more than 5 years might have been considered “statistically cured”.
A chronic condition such as uncomplicated diabetes, on the other hand, showed a more stable—2-fold—death risk during the whole period.
Inclusion of more covariates
We found that comorbidity adds little to age and sex when predicting long-term all-cause mortality after THA. We did not include any other possible predictors, since it is known that although concordance indices are commonly used to quantify predictability of working models, they are not sensitive for capturing overall added values from a new marker on top of conventional predictors (Uno et al. 2011). A consequence of this was illustrated by Mnatzaganian et al. (2014), who found large differences in 1- and 2-year postoperative mortality hazard ratios combined with small (although statistically significant) C-statistic differences.
Healthy patients
It has been proposed that comorbidities could be used for mortality prediction in patients with severe diseases, such as cancer. This discrepancy from our results suggests that patients selected for THA in Sweden are relatively healthy, so their time of death is difficult to predict.
This might also be justified by comparing the Elixhauser comorbidity data from Table 1 to a similar table for the general population (Quail et al. 2011). Exact comparisons are difficult, due to different demographics and different sources of comorbidity data, but there are some indications that THA is avoided for patients with depression, psychiatric disorders, fluid and electrolyte disorders, coagulopathies, and metastatic cancer, whereas uncomplicated diabetes and alcohol abuse might be slightly more common in patients with THA. However, as mentioned above, some of these conditions are under-reported from the National Patient Register. Caution should therefore be used when comparing individual comorbidities. To further compare our sample to the general population would be of interest. An age- and sex-matched control group, without THA but with a comparable date for comparison, would make this possible. Unfortunately, we did not have access to such data, but this can be seen as a suggestion for further research.
We are not sure whether the Swedish selection criteria for THA are equal to those in other countries. Predictive power of comorbidity on mortality might be stronger if THA is also offered to older or sicker patients than ours.
Distinct comorbidities vs. combined index
If one relies on comorbidity to predict mortality, a combined index is needed since no distinct comorbidity could predict death alone. This has also been justified mathematically (Austin et al. 2015). A combined index is also preferred due to ease of comparison between patients with different comorbidities (Moltó and Dougados 2014).
Elixhauser et al. (1998) did, however, argue against such an index—although several indices have since then been proposed. It has also been suggested that the use of comorbidity indices is not well understood by surgeons and patients (Bozic et al. 2012), so individual comorbidities could be preferred for easier interpretation. Also, a composite comorbidity score does not model possible interaction effects, and it is known, for example, that diabetes mellitus increases the risk of postoperative myocardial infarction. This increased risk might be modeled better if controlling for diabetes specifically (Bohl et al. 2016), ideally by linking to the National Diabetes Register (which has a better degree of completeness of diabetes cases than the National Patient Register (Rawshani et al. 2014)).
We found the highest concordance indices for the Elixhauser comorbidity index. This index is not ideal, but it was at least the best of the 3 investigated. This is consistent with previous studies on in-hospital mortality of THA patients (Menendez et al. 2014) and with a systematic review of 76 articles in general (Yurkovich et al. 2015). The absolute difference between the indices is, however, small—so the original Charlson comorbidity index might be preferred if relying on self-administrated questionnaires or other time-consuming methods (Moltó and Dougados 2014).
Strengths
The data that support this study are of high quality. The SHAR is a validated source with almost total completeness regarding both public and private THA producers in Sweden (Kärrholm 2010). The Swedish personal identity numbers also allowed us to uniquely identify and link data from the SHAR to the National Patient Register (Cnudde et al. 2016) with a validated completeness of 85–95% of most diagnoses classified by both Charlson and Elixhauser (Ludvigsson et al. 2011). The Swedish tax agency has an almost complete coverage of death dates for Swedish permanent residences. Unknown death dates occur more frequently for patients moving permanently to other countries, but emigration at high age is unlikely, and we did not see any systematic censoring pattern affecting the data.
To our knowledge, our study is the first both to predict long-term all-cause mortality after THA based on comorbidity, and to use a concordance index specially designed to capture the specific nature of survival data (Heagerty and Zheng 2005) in the field of orthopedics, where it is otherwise common to rely on logistic regression.
Limitations
Comorbidity completeness through the National Patient Register is high for most comorbidities, but administrative registers might be an incomplete source of comorbidity data (Bohl et al. 2016). It is also clear that some individual comorbidities are under-reported.
The National Patient Register does not cover primary healthcare visits and did not cover hospital-based outpatient data before 2001. The Elixhauser classification was in fact developed for inpatient data only, but addition of outpatient data has since been shown to be successful (Perkins et al. 2004). Completeness of outpatient data is, however, lower (80%), and this is an increasing problem—since more patients are treated as outpatients over time (Ludvigsson et al. 2011). Inclusion of data from primary healthcare would be theoretically possible but would be costly and time-consuming, since these records are decentralized among 21 Swedish counties.
According to the Global Burden of Disease Study 2013 (Naghavi et al. 2015), 9 of the 10 most common causes of death in Sweden have good coverage by the comorbidities identified by both the Charlson and Elixhauser classification (heart disease, cancer, lung diseases, and Alzheimer’s disease). Suicide, the fifth most common cause of death in Sweden, is, however, difficult to predict from comorbidity.
We used ICD-10 codes (as used in Sweden from 1997) for comorbidity, while ICD-9 is still widely used in this field. It has been shown, however, that both versions give similar results (Gordon et al. 2013), so this consideration can be safely ignored when comparing our results to those of others.
Our concordance index is based on AUC values, a measure that has been the subject of some criticism. The AUC value gives equal importance to the sensitivity and specificity of a model. Weighting of these aspects differently might be relevant for further research.
Conclusion
The predictive power of comorbidity indices on mortality is weak for patients with THA—in fact, weaker than age and sex. The predictive power also decreases over time.
If mortality after THA must be predicted from comorbidity, which we believe should be avoided, then the Elixhauser comorbidity index appears to be the best choice.
Supplementary data
Table 2 and Figure 4 are available as supplementary data in the online version of this article, http://dx.doi.org/10.1080/17453674.2017.1341243
EB, OR, PC, CR, GG, and SN contributed to the conception and design of the study. Statistical analyses were run by EB, who also drafted the manuscript. All the authors interpreted the results, critically revised the manuscript, and approved the final version.
Supplementary Material
References
- Austin S R, Wong Y-N, Uzzo R G, Beck J R, Egleston B L.. Why summary comorbidity measures such as the Charlson Comorbidity Index and Elixhauser Score work. Med Care 2015; 53(9): 65–72. [DOI] [PMC free article] [PubMed] [Google Scholar]
- Bohl D D, Singh K, Grauer J N.. Nationwide databases in orthopaedic surgery research. J Am Acad Orthop Surg 2016; 24(10): 673–82. [DOI] [PubMed] [Google Scholar]
- Bozic K J, Lau E, Kurtz S, Ong K, Rubash H, Vail T P, et al. Patient-related risk factors for periprosthetic joint infection and postoperative mortality following total hip arthroplasty in Medicare patients. J Bone Joint Surg 2012; 94(9): 794–800. [DOI] [PubMed] [Google Scholar]
- Cnudde P, Rolfson O, Nemes S, Kärrholm J, Rehnberg C, Rogmark C, et al. Linking Swedish health data registers to establish a research database and a shared decision-making tool in hip replacement. BMC Musculoskelet Disord 2016; 17(1): 414. [DOI] [PMC free article] [PubMed] [Google Scholar]
- Duivenvoorden T, Vissers M M, Verhaar J A N, Busschbach J J V, Gosens T, Bloem R M, et al. Anxiety and depressive symptoms before and after total hip and knee arthroplasty: a prospective multicentre study. Osteoarthritis Cartilage 2013; 21(12): 1834–40. [DOI] [PubMed] [Google Scholar]
- Elixhauser A, Steiner C, Harris D R, Coffey R M.. Comorbidity measures for use with administrative data. Med Care 1998; 36(1): 8–27. [DOI] [PubMed] [Google Scholar]
- Gordon M, Stark A, Sköldenberg O G, Kärrholm J, Garellick G.. The influence of comorbidity scores on re-operations following primary total hip replacement: comparison and validation of three comorbidity measures. Bone Joint J 2013; 95-B(9): 1184–91. [DOI] [PubMed] [Google Scholar]
- Greene M E, Rolfson O, Gordon M, Garellick G, Nemes S.. Standard comorbidity measures do not predict patient-reported outcomes 1 year after total hip arthroplasty. Clin Orthop Relat Res 2015; 473(11): 3370–9. [DOI] [PMC free article] [PubMed] [Google Scholar]
- Hawker G A, Badley E M, Borkhoff C M, Croxford R, Davis A M, Dunn S, et al. Which patients are most likely to benefit from total joint arthroplasty? Arthritis Rheum 2013; 65(5): 1243–52. [DOI] [PubMed] [Google Scholar]
- Heagerty P J, Zheng Y.. Survival model predictive accuracy and ROC curves. Biometrics 2005; 61(1): 92–105. [DOI] [PubMed] [Google Scholar]
- Kärrholm J. The Swedish Hip Arthroplasty Register (www.shpr.se). Acta Orthop 2010; 81(1): 3–4. [DOI] [PMC free article] [PubMed] [Google Scholar]
- Lavernia C J, Laoruengthana A, Contreras J S, Rossi M D.. All-patient refined diagnosis-related groups in primary arthroplasty. J Arthroplasty 2009; 24(6): 19–23. [DOI] [PubMed] [Google Scholar]
- Ludvigsson J F, Andersson E, Ekbom A, Feychting M, Kim J-L, Reuterwall C, et al. External review and validation of the Swedish national inpatient register. BMC Public Health 2011; 11(1): 450. [DOI] [PMC free article] [PubMed] [Google Scholar]
- Menendez M E, Neuhaus V, Dijk C N van, Ring D.. The Elixhauser comorbidity method outperforms the Charlson index in predicting inpatient death after orthopaedic surgery. Clin Orthop Relat Res 2014; 472(9): 2878–86. [DOI] [PMC free article] [PubMed] [Google Scholar]
- Menendez M E, Neuhaus V, Ring D.. Inpatient mortality after orthopaedic surgery. Int Orthop 2015; 39(7): 1307–14. [DOI] [PubMed] [Google Scholar]
- Michet C, Schleck C, Larson D, Maradit-Kremers H, Berry D, Lewallen D.. Cause-specific mortality trends following total hip and knee arthroplasty. J Arthroplasty 2017; 32(4): 1292–7. [DOI] [PMC free article] [PubMed] [Google Scholar]
- Mnatzaganian G, Ryan P, Hiller J E.. Does co-morbidity provide significant improvement on age adjustment when predicting medical outcomes? Methods Inf Med 2014; 53(2): 115–20. [DOI] [PubMed] [Google Scholar]
- Moltó A, Dougados M.. Comorbidity indices. Clin Exp Rheumatol 2014; 32: S131–S4. [PubMed] [Google Scholar]
- Naghavi M, Wang H, Lozano R.. Global, regional, and national age-sex specific all-cause and cause-specific mortality for 240 causes of death, 1990-2013: A systematic analysis for the Global Burden of Disease Study 2013. Lancet 2015; 385 (9963): 117–71. [DOI] [PMC free article] [PubMed] [Google Scholar]
- Pepe M S, Janes H, Longton G, Leisenring W, Newcomb P.. Limitations of the odds ratio in gauging the performance of a diagnostic, prognostic, or screening marker. Am J Epidemiol 2004; 159(9): 882–90. [DOI] [PubMed] [Google Scholar]
- Perkins A J, Kroenke K, Unützer J, Katon W, Williams J W, Hope C, et al. Common comorbidity scales were similar in their ability to predict health care costs and mortality. J Clin Epidemiol 2004; 57(10): 1040–8. [DOI] [PubMed] [Google Scholar]
- Quail J M, Lix L M, Osman B A, Teare G F.. Comparing comorbidity measures for predicting mortality and hospitalization in three population-based cohorts. BMC Health Serv Res 2011; 11: 146. [DOI] [PMC free article] [PubMed] [Google Scholar]
- Quan H, Sundararajan V, Halfon P, Fong A, Burnand B, Luthi J-C, et al. Coding algorithms for defining comorbidities in ICD-9-CM and ICD-10 administrative data. Med Care 2005; 43(11): 1130–9. [DOI] [PubMed] [Google Scholar]
- Quan H, Li B, Couris C M, Fushimi K, Graham P, Hider P, et al. Updating and validating the charlson comorbidity index and score for risk adjustment in hospital discharge abstracts using data from 6 countries. Am J Epidemiol 2011; 173(6): 676–82. [DOI] [PubMed] [Google Scholar]
- Rawshani A, Landin-Olsson M, Svensson A M, Nyström L, Arnqvist H J, Bolinder J, et al. The incidence of diabetes among 0-34 year olds in Sweden: New data and better methods. Diabetologia 2014; 57(7): 1375–81. [DOI] [PMC free article] [PubMed] [Google Scholar]
- Therneau T, Crowson C.. Using time dependent covariates and time dependent coefficients in the Cox Model. Red 2013; 1–8. [Google Scholar]
- Uno H, Cai T, Pencina MJ, D’Agostino RB, Wei LJ.. On the C-statistics for evaluating overall adequacy of risk prediction procedures with censored survival data. Stat Med 2011; 257(5): 2432–7. [DOI] [PMC free article] [PubMed] [Google Scholar]
- Yurkovich M, Avina-Zubieta J A, Thomas J, Gorenchtein M, Lacaille D.. A systematic review identifies valid comorbidity indices derived from administrative health data. J Clin Epidemiol 2015; 68(1): 3–14. [DOI] [PubMed] [Google Scholar]
Associated Data
This section collects any data citations, data availability statements, or supplementary materials included in this article.