Abstract
High-resolution three-dimensional biomolecule distribution information of large samples is essential to understanding their biological structure and function. Here, we proposed a method combining large sample resin embedding with iDISCO immunofluorescence staining to acquire the profile of biomolecules with high spatial resolution. We evaluated the compatibility of plastic embedding with an iDISCO staining technique and found that the fluorophores and the neuronal fine structures could be well preserved in the Lowicryl HM20 resin, and that numerous antibodies and fluorescent tracers worked well upon Lowicryl HM20 resin embedding. Further, using fluorescence Micro-Optical sectioning tomography (fMOST) technology combined with ultra-thin slicing and imaging, we were able to image the immunolabeled large-volume tissues with high resolution.
OCIS codes: (170.3880) Medical and biological imaging, (180.2520) Fluorescence microscopy, (160.2540) Fluorescent and luminescent materials
1. Introduction
The acquisition of detailed three-dimensional (3D) information regarding endogenous protein molecules in tissue is crucial to understanding their biological structure and function [1,2]. Generally, fluorescent immunostaining techniques help visualizing the localization of specific proteins in cells and tissues [3, 4]. Recent advances in immunostaining techniques have brought revolutionary breakthroughs to the en bloc immunofluorescence (IF) labeling of specific proteins and subcellular compartments within intact tissue [2, 5]. Specifically, the iDISCO immunostaining technique [5] shows good antibody compatibility and can better implement IF-labeled large-volume samples. On the other hand, with the advances in optical imaging technology, the combination of tissue optical clearing, optical projection tomography (OPT), and light sheet imaging technology enables 3D imaging of IF-labeled intact tissue [5–12]. However, acquiring more detailed information of endogenous molecule distribution in large-volume biological tissue remains challenging, largely owing to the finite resolution of OPT and light sheet technology [12, 13].
Actually classic optical microscopy can provide the required high spatial resolution. Combined with precise slicing, microscopic optical imaging can map large-volume samples with high voxel-resolution. For example, high-resolution episcopic microscopy could image 3D tissue architecture by imaging and slicing the surface layer of a resin-embedded sample [14]. Micro-optical sectioning tomography (MOST) technology automatically and simultaneously performs precise serial slicing and high resolution optical imaging [15]. Using MOST technique, we have successfully obtained 3D high-resolution imaging data sets of Golgi stained or the green fluorescent protein (GFP)-labeled whole brain [16–18].
Therefore, it is intuitive to implement high resolution imaging of the large-volume immunolabelling samples using fluorescence MOST (fMOST) technique. In this case, whether the whole-mount immunolabelling method is compatible with plastic embedding should be examined first, as plastic embedding of the sample is a pre-requisite to enable precise and ultra-thin slicing. In fact, plastic embedding has been applied to immunolabelled thin samples like cells and tissues [19–22], and could improve the axial resolution of immunolabelled sections [23]. However, procedures and resins for immunostaining and embedding the thin sample are unsuitable for large-volume sample. For large sample embedding, preservation of the fluorescent signal brightness and fine structures is a major challenge [17].
In this paper, we first examined the proper resin for this study. We found Lowicryl HM20 was a good candidate for this purpose. The fine structures of neurite were preserved in Lowicryl HM20, and that multiple antibodies and fluorescent tracers worked well. We then confirmed that Lowicryl HM20 resin embedding was compatible with the iDISCO staining technique. By combining fMOST technology with resin embedding, we present here an effective approach to visualize molecularly labeled structures in large-volume biological tissue at high resolution.
2. Materials and methods
2.1 Animal preparation
We used 8-week-old C57BL/6J male mice, Thy1-GFP M-line transgenic mice (Jackson Laboratory), and ChAT-cre; Rosa26lsl-tdTomato transgenic mice in this research. Mice were anesthetized and intracardially perfused with 0.01 M phosphate buffered saline (PBS, Sigma-Aldrich), and then post-fixed in 4% paraformaldehyde (Sigma-Aldrich) for 24 hour. The brains were excised and sliced to 100-μm coronal plane brain sections using a vibration microtome (Leica, VT1000 S) and the slices were then used for IF staining. Subsequently, the slices were imaged using confocal microscopy (LSM780, ZEISS) before and after resin embedding. To demonstrate that resin embedding was compatible with iDISCO [5], 1.2-mm-thick brain tissue was immunostained and embedded in resin for stage-scanning line confocal microscopy imaging. All animal procedures were approved by the Institutional Animal Ethics Committee of the Huazhong University of Science and Technology.
2.2 Immunostaining
We immunostained 1-mm-thick brain tissue using iDISCO protocols [5]. Prior to immunostaining procedure, the brain tissue was treated with graded methanol solutions (20%, 40%, 60%, 80%, 100%, and a second 100%, each for 30 minutes at 4 °C). The tissues were then rinsed twice in 0.01 M PBS buffer for 1 hour. Next, the tissues were bleached with ice-cold 5% H2O2/20% DMSO/CH3OH solutions at 4 °C overnight. After bleaching, the tissues were washed in methanol for 30 minutes three times and then rehydrated with another graded methanol series followed by two rinses with 0.01 M PBS buffer, and finally two incubations in PBS/0.2% Triton X-100 for 1 hour at 37 °C. For the immunostaining step, the tissues were placed in PBS/0.2%Triton X-100/20% DMSO/0.3 M glycine solutions for 1 day, then in PBS/0.2%Triton X-100/10% DMSO/6% goat serum solutions for 12 hours, followed with PBS/0.2% Tween-20 (Sigma, P9416) with 10 mg/ml heparin (PTwH) solution at 37 °C overnight. The tissues were placed in the primary antibodies diluted in PTwH/5% DMSO/3% goat serum solutions at 37 °C with gentle shaking on an oscillator for 2 days, followed by five 1 hour rinses with PTwH solutions. Then, the tissues were incubated with secondary antibodies diluted in PTwH/3% goat serum solutions at 37 °C with gentle shaking on an oscillator for 2 days, and finally rinsed five times in PTwH for 1 hour each.
The immunostaining procedure of 100-μm brain slices was in accordance with the above-mentioned method with some modifications. Briefly, the slices were rinsed twice in PBS for 5 minutes, followed by a graded methanol series, and then, they were bleached with ice-cold 5% H2O2/20% DMSO/CH3OH solutions at 4 °C for 1 hour. After bleaching, the slices were washed in methanol for 5 minutes three times, then rehydrated with another graded methanol series followed by two 10 minute rinses with 0.01 M PBS, and finally rinsed twice in PBS/0.2% Triton X-100 for 1 hour at 37 °C. The slices were placed in PBS/0.2% Triton X-100/20% DMSO/0.3 M glycine solutions for 1 hour, then in PBS/0.2% Triton X-100/10% DMSO/6% goat serum solutions for 2 hours, and in PTwH solutions at 37 °C for 1 hour. Next, the slices were incubated with the primary antibodies diluted in PTwH/5% DMSO/3% goat serum solutions at 37 °C with gentle shaking on an oscillator for 8 hours, followed by five 10 minute rinses with PTwH solutions. Then, the slices were incubated with secondary antibodies diluted in PTwH/3% goat serum solutions at 37 °C with gentle shaking on an oscillator for 8 hours, and finally rinsed five times in PTwH for 10 minutes each.
2.3 Virus and fluorescent tracer injections
PRV-CMV-GFP virus and RV-∆G-DsRed virus were used to label subsets of cells in the mouse brain by expressing fluorescent proteins. The viral tools were all packaged by BrainVTA (BrainVTA Co., Ltd., Wuhan, China). The stereotaxic coordinates for the target brain areas were calculated according to the Mouse Brain in Stereotaxic Coordinates Atlas. The following injection coordinates were used: 1.18 mm A-P, 1.5 mm M-L, and 1.3 mm D-V. A pressure injector (Nanoject II; Drummond Scientific Co.) was used to pulse virus or tracer into the brain. A total of 200 nl PRV-GFP virus or cholera toxin beta (CTB)-Alexa555 was injected into the primary motor cortex of adult C57BL/6J mouse. At 48 hours after surgery, the mouse was sacrificed for brain sample preparation. For the RV-DsRed virus injection, 300 nl virus was injected into the primary motor cortex of an adult C57BL/6J mouse. At 11 days after the surgery, the mouse was sacrificed for brain sample preparation.
2.4 Vasculature labeling
Lectin-DyLight 594 was diluted in 0.01 M PBS buffer with a concentration of 20 µg/ml. Mice were anesthetized and injected via the caudal vein with Lectin-DyLight 594 (0.1 ml per mouse). After injection, the mice were placed in a warm environment for 20 minutes until they were sacrificed for brain sample preparation.
2.5 Resin embedding
We used 100-μm thick brain slices to quantitatively evaluate the preservation of IF during plastic embedding. The brain slices were immunostained and embedded with LR White (Structure Probe Inc.), GMA (Technovit 8100, Electron Microscopy Sciences), or Lowicryl HM20 (Electron Microscopy Sciences) resin. For LR White- and GMA-embedded specimens, the samples were rinsed twice in PBS for 2 hours, followed by a graded ethanol series (50%, 75%, 95%, and 95% treatments, each incubated for 1 hour at 4 °C), a graded series of infiltration solutions (50%, 75%, and 100% embedding medium in 95% ethanol, each incubated for 2 hours at 4 °C), and finally in 100% embedding medium for 48 hours at 4 °C. Then, the specimens were placed onto a 24 × 50 mm2 coverslip, and the LR White or GMA polymerization solution was added to the specimens. A second coverslip was then immediately placed on the sample, while ensuring that no air bubbles were present between the two coverslips. The LR White was allowed to polymerize at 55 °C for 8 hours and the GMA at 4 °C for 24 hours. For Lowicryl HM20 resin embedding, we optimized the embedding procedure and polymerization method. Because UV polymerization could quench the fluorescence [24], we used 0.6% (wt/wt) benzoyl peroxide (BPO) to initiate resin polymerization in a vacuum environment. Briefly, the samples were rinsed twice in PBS for 2 hours, followed by a graded ethanol series (50%, 75%, 95%, and three 100% treatments, each incubated for 1 hour at 4 °C), a graded series of infiltration solutions (50%, 75%, and 100% embedding medium in 100% ethanol, each incubated for 2 hours at 4 °C), and finally in 100% embedding medium for 48 hours at 4 °C. Then, the specimens were placed onto a coverslip and the Lowicryl HM20 resin polymerization solution was dropped onto the samples followed immediately by covering the samples with a second coverslip. The specimens were placed in a sealed drying vacuum oven at 50 °C for 8 hours. For the 1-mm-thick brain tissue block, we added 0.2% Sudan black B (SBB) [25, 26] to the Lowicryl HM20 resin for the purpose of lowering the background fluorescence. We used a gelatin capsule (Electron Microscopy Sciences, cat. no.130-12) as an embedding mold to polymerize the tissue block. The remainders of the steps were as described above.
2.6 Confocal imaging
To quantitatively evaluate the IF during plastic embedding, the immunostained 100 μm-thick brain slices were sealed between two coverslips using PBS (0.01 M, pH = 7.4, Sigma) and immediately imaged using a commercial confocal microscope (LSM780, ZEISS) at 25 °C. A 20 × water immersion objective with numerical aperture (NA) 1.0 was used to image neuronal somas in the brain slices. The laser powers were set as 8% 488 nm laser for CF488 dye labeled slices, 6% 561 nm laser for CF568 dye labeled slices, 4% 561 nm laser for CY3 dye labeled slices, 10% 633 nm laser for CY5 dye labeled slices, 8% 488 nm laser for PRV-GFP labeled slices, 8% 488 nm laser for RV-DsRed labeled slices, and 8% 633 nm laser for Alexa 647 labeled slices. The image was acquired at 0.42 × 0.42 μm2 pixel size, 1.00-μm step size, 600 V PMT voltage, and 1.58 μs pixel dwell time. Several TH-positive neuronal somas were imaged using this configuration. The soma location, process orientation, and slice contour of pre-embedded samples were thus documented. Subsequently, the brain slices after imaging were then embedded in resin. Next, the same areas of the embedded brain slices were imaged based on the soma location and slice contour. We used the same parameters before and after resin embedding. There was no background corrections performed for pre- and post-embedding measurements.
2.7 Change of fluorescence intensity
We evaluated the fluorescence intensity changes from the brain slice images. Fluorescent intensities of the immunolabeled neurons before and after resin embedding were read-out and compared using ImageJ software. First, the grey values of all pixels in the soma were selected using the oval-selection tool. Then, using the histogram tool, the mean fluorescent intensity of the soma was measured. Next, a straight line was drawn across the background area close to the soma to measure the mean value of the background; the fluorescent intensity of signals in the neuron was calculated by subtracting the mean value of the background from the mean fluorescent intensity of the soma. The IF change ratio of the neuron is I/Iο × 100%. The fluorescent intensity of the signals in the neuron was designated as “Iο” and “I”, before and after resin embedding, respectively. We selected 25 neurons from three independent samples to determine the fluorescence intensity changes.
2.8 Absorption spectrum measurement
The CF488, CF568, CY3, and CY5 dyes conjugated to the same type of secondary antibody were used to measure absorption spectra. All the absorption spectra were measured on the LAMBDA 950 UV/Vis/NIR Spectrophotometer (PerkinElmer), with a 1-nm spectral resolution, using dyes in solutions (0.01M PBS buffer, pH = 7.4) as the controls. As dyes cannot efficiently dissolve in Lowicryl HM20 embedding medium, we prepared resin sheet that pre-polymerized on glass slides, and spread and dried (in vacuum) the dyes on these sheets. Then, 30 μl Lowicryl HM20 resin solution was added on this resin sheet, and a coverslip was covered immediately to exclude the air. Subsequently, resin sheet was placed in a sealed drying vacuum oven at 50 °C for 8 hours. The absorption spectrum of dyes in Lowicryl HM20 could be measured after polymerization.
2.9 Successive high-resolution stage-scanning block-face imaging
After embedding the large-volume IF stained tissue, we used a home-made imaging system, which was based on line-scan imaging methods [27]. Briefly, a 488-nm laser was used as the light source. The diffraction-limited illumination line was provided by an optical system, which included a cylindrical lens, a tube lens, and a high NA water objective lens (LUMPLFLN 40 × water, NA 0.8, Olympus). The essential strategy of this method was to adopt a strip imaging mode rather than a mosaic imaging mode to improve the overall imaging speed, and to use the line-illumination combined with the sub-array mode of a scientific complementary metal-oxide semiconductor (sCMOS) camera (ORCA-Flash 4.0, Hamamatsu Photonic K.K., Japan, 2048 × 2048 pixels) to reject the out-of-focus light at certain level. For the strip width of 330 μm, it required approximately 40 s to image the whole lateral plane of the sample, which was 6.2 × 5.0 mm2, with sampling resolution of 0.16 × 0.16 μm2/pixel. In order to acquire the three-dimension images of large tissues, a diamond knife was mounted in this system to remove the surface of the samples after being imaged. An accurate mechanical positioning stage (X-axis: ABL20020, Y-axis: ANT130, Z-axis: AVL125, Aerotech) was used to ensure the natural and accurate registration of all the images. 3D reconstruction of the images was implemented using previously reported methods [28–32].
3. Results
3.1 Immunofluorescence (IF) intensity change in resin embedding
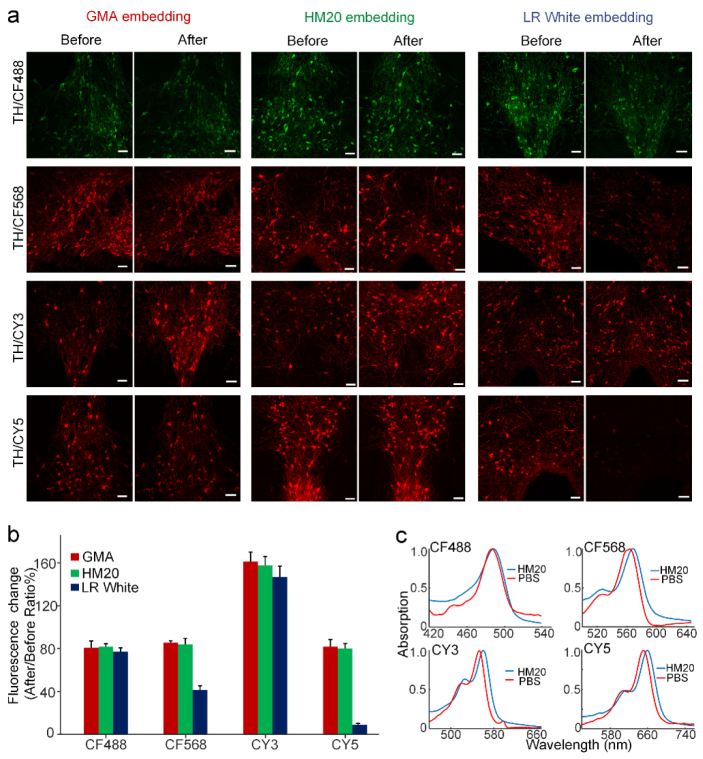
Fluorescence brightness constitutes an important value for evaluating the performance of fluorophores in IF-labeled tissue. The fluorescence behavior of commonly used fluorescent probes in commonly used resins was analyzed. The acrylic resin is optimal for fluorescent imaging considering the viscosity and autofluorescence [33, 34]. So, we chose three types of acrylic resins, including hydrophilic and non-cross-linking resin (GMA), hydrophilic and cross-linking resin (LR-White), and hydrophobic and cross-linking resin (Lowicryl HM20) as the embedding medium, and used them to embed IF-stained samples with the optimized embedding procedure [24, 35, 36]. We labeled 100-μm-thick mouse brain tissue with a primary antibody anti-tyrosine hydroxylase, while secondary antibodies were conjugated with four different fluorescent probes: CF488, CF568, CY3, and CY5 dyes (Tables 1 and 2); and the brain slice images are shown in Fig. 1. From the images in Fig. 1(a), we found that the fluorescence signals on some brain slices increased after embedding, whereas those on other slices decreased.
Table 1. Primary antibodies tested on mouse brain tissue.
| Antibody type | Host species | Source | Cat. No. |
|---|---|---|---|
| Parvalbumin | Rabbit | Thermo Fisher | PA1-993 |
| GFP | Rabbit | Abcam | ab290 |
| FoxP2 | Rabbit | Abcam | Ab16046 |
| Chat | Goat | Sigma-Aldrich | SAB2500233 |
| cFos | Rabbit | Synaptic Systems | 226003 |
| PSD-95 | Rabbit | Abcam | ab18258 |
| DsRed | Rabbit | TaKaRa | 632496 |
| Tyrosine hydroxylase (TH) | Rabbit | Sigma-Aldrich | T8700 |
All the antibodies were compliant with the iDISCO protocol.
Table 2. Secondary antibodies tested on mouse brain tissue.
| Antibody type | Host species | Source | Cat. No. |
|---|---|---|---|
| Cy3 | Goat anti rabbit | Jackson Laboratory | 111-165-003 |
| Cy5 | Goat anti rabbit | Jackson Laboratory | 111-175-144 |
| Alexa488 | Goat anti rabbit | Thermo Fisher | A-11008 |
| Alexa488 | Goat anti mouse | Thermo Fisher | A28175 |
| Alexa594 | Goat anti rabbit | Thermo Fisher | A-11012 |
| Alexa647 | Donkey anti rabbit | Thermo Fisher | A-31573 |
| Alexa647 | Donkey anti goat | Abcam | ab150131 |
| CF488 | Goat anti rabbit | Sigma-Aldrich | SAB4600234 |
| CF568 | Goat anti rabbit | Sigma-Aldrich | SAB4600310 |
Fig. 1.
Immunofluorescence-labeled brain slices before and after resin embedding. (a) Images of labeled brain slices before and after GMA, Lowicryl HM20 or LR White resin embedding, respectively. All slices were immunolabeled by primary antibody (anti-TH), and were labeled with the various secondary antibodies conjugated with four fluorescent dyes: CF488, CF568, CY3, or CY5, respectively. All images were taken at a 0.42 × 0.42 × 1 μm3 voxel size on an LSM780 confocal microscope (ZEISS). (b) Fluorescent intensity change of immunostained brain slices after being embedding with different resins. We calculated the fluorescent intensity changes from labeled neuronal somas. The fluorescent intensities were compared before and after resin embedding using ImageJ software. The values in the bar graph are given as the means ± SD (n = 25 neurons from three slices for each independent sample). (c) Small shifts occurred in the absorption spectra of the dyes (CF488, CF568, CY3, and CY5) in Lowicryl HM20 resin polymer, compared to those in PBS buffer. Scale bar in (a): 50 μm.
We compared the fluorescent intensities of neurons before and after resin embedding, and found that the fluorescent signals of the CF488 and CY3 dye-labeled neurons were well preserved in all three resins. In particular, the fluorescent intensities of the CY3-labeled neurons were greatly enhanced after resin embedding. In comparison, the fluorescent intensities of the CF568 and CY5 dye-labeled neurons embedded with GMA and Lowicryl HM20 resins were better preserved compared with those embedded with LR-White. Noticeably, LR White poorly preserved the fluorescence of CY5 dye-labeled neurons, reducing CY5 fluorescence intensity by over 80% [Fig. 1(b)]. Except the fluorescence maintenance, considering cutting performance (see Table 4, Appendix 1), we chose Lowicryl HM20 resin for IF-labeled tissue embedding in this study.
Next, we tried to explain the performances of different dyes in Lowicryl HM20 resin. As the absorption spectrum of GFP changed significantly after embedding in some resins, we measured the absorption spectra of dyes in 0.01M PBS and in Lowicryl HM20 resin polymer. Result are shown in Fig. 1(c); we found that less than 10 nm red shifts occurred for dyes in polymer. Such small shift in the absorption spectra could not explain the differences in fluorophore performances, indicating that further exploration is needed to explain this phenomenon.
3.2 Lowicryl HM20 resin embedding is compatible with various antibodies and fluorescent tracers
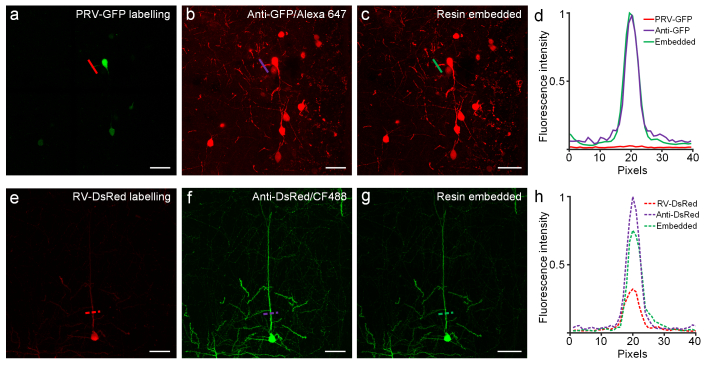
IF techniques can amplify epitope detection, especially when indirect IF staining methods are applied to the labeling of specific tissue antigens. We used an anti-GFP antibody to label brain tissue infected with a PRV-GFP virus, and used an anti-DsRed antibody to label brain tissue infected with a RV-DsRed virus. The signal intensities of fluorescent protein, IF labeling, and embedding status were intercompared to analyze whether Lowicryl HM20 resin embedding could preserve IF signal. We found that the IF staining could largely enhance the fluorescent signals of the tissue, especially at neurites that usually express fewer fluorescent proteins [Fig. 2(a), 2(b), 2(e), 2(f)]. After resin embedding, fluorescent signals of IF staining were well preserved and the fine structure of neurons could be captured under confocal microscopy [Fig. 2(c), 2(d), 2(g), 2(h)].
Fig. 2.
Preservation of immunofluorescence labeled fine details of neurite in resin-embedded brain tissue. (a) Fluorescence image of neurons labeled by PRV-GFP virus; slices were imaged after immunofluorescent labeling (b), and after resin embedding (c). (d) Fluorescent intensities of pixels crossed by red, purple, and green lines (shown in a, b, c, respectively) are plotted in the corresponding colors. (e) Morphology of neurons labeled by RV-DsRed virus before immunostaining, after immunofluorescent labeling (f), and after resin embedding (g). (h) Fluorescent intensities of pixels crossed by the red, purple, and green dashed lines (shown in e, f, and g, respectively) are plotted in the corresponding color. Images in panels (a-c) were recorded at a 0.42 × 0.42 × 1.00 μm3 voxel size using a confocal microscope (LSM780, ZEISS) with a 20 × 1.0 NA water objective. Images in panels (e-g) were recorded at a 0.21 × 0.21 × 1.00 μm3 voxel size using a confocal microscope (LSM780, ZEISS) with a 40 × 1.0 NA oil objective. All the images represent maximum intensity z-projections of 20-μm-thickness. Scale bar: (a-g) 50 μm.
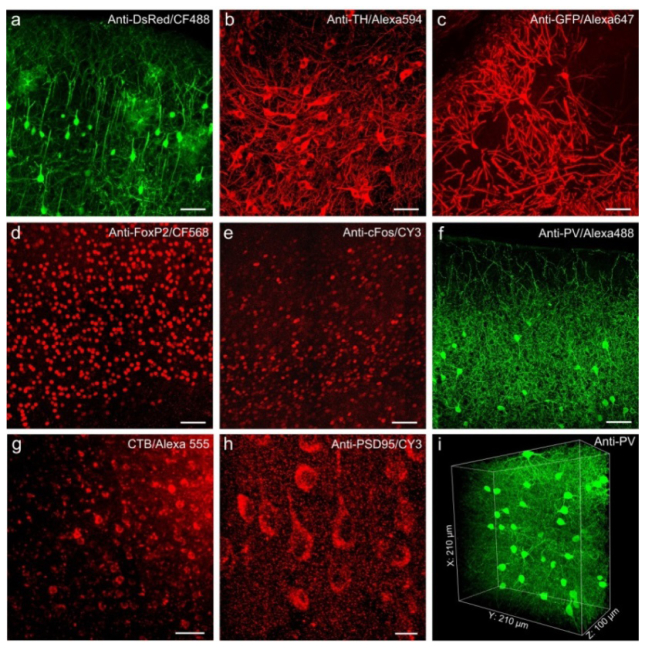
We next examined the compatibility of Lowicryl HM20 resin embedding with different primary and secondary antibodies. We tested 8 primary antibodies, 9 secondary antibodies, and 2 fluorescent tracers (Tables 1-3) that are commonly used in immunohistochemistry, and found that all of them worked successfully with Lowicryl HM20 resin embedding. Our results showed that Lowicryl HM20 resin embedding was compatible with various antibodies and provided a good signal to background ratio in brain tissue. The fluorescent signals and fine structures of tissue can be readily identified under confocal [Fig. 3(a)-3(f), 3(h)] and two-photon microscopy [Fig. 3(i)].
Table 3. Fluorescent tracers and dyes tested on mouse brain tissue.
| Antibody type | Source | Cat. No. |
|---|---|---|
| CTB-Alexa555 | Invitrogen | C34776 |
| Lectin-DyLight 594 | Vector Laboratories | DL1177 |
Fig. 3.
Resin embedding is compatible with various antibodies and fluorescent tracers staining in brain tissue. (a-i) Images of immune- and fluorescent tracer-labeled neurons in mouse brain tissue after Lowicryl HM20 resin embedding. (a) Immunolabeling of TdTomato-labeled mouse cortex from ChAT-cre; Rosa26lsl-tdTomato transgenic mice. (b) TH-immunolabeled thalamic neurons in C57 mouse brain tissue. (c) Immunolabeling of GFP-expressing hippocampal neurons from a Thy1-GFP-M transgenic mouse. (d-h) Mouse brain slices were immunolabeled by FoxP2 (d), cFos (e), parvalbumin (f), cholera toxin beta (g), and PSD-95 (h), respectively. Images in panel a-h were acquired on an LSM780 confocal microscope (ZEISS). (i) 3D volume image of immnofluorescent signals (Alexa 488) labeled by parvalbumin in mouse cortex, images were acquired by a two-photon microscope (LSM780). Scale bar: (a-g) 50 μm; (h) 10 μm.
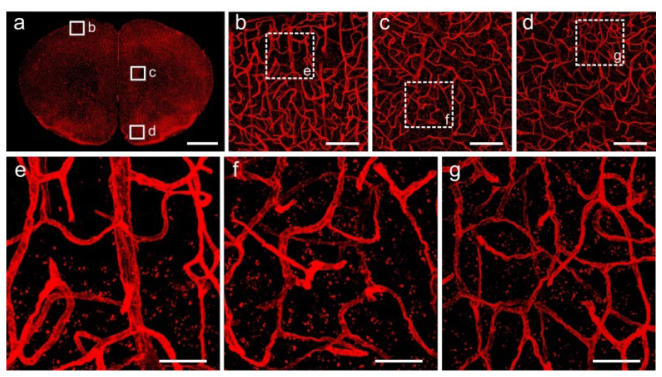
We also tested whether Lowicryl HM20 resin embedding was compatible with some fluorescent tracers. Figure 3(g) showed the fluorescent signals of neurons labeled with CTB conjugated with Alexa555. Figure 4 showed fluorescent images of Lectin-DyLight 594 labeled vasculature in the brain tissue after Lowicryl HM20 resin embedding. The Fig. 4(a) showed an integral and even image of blood vessels in the completely coronal section. The magnification images [Figs. 4(b)-4(g)] clear displayed of continuous vascular networks. Therefore, these results confirmed that Lowicryl HM20 resin embedding was compatible with some fluorescent tracers (Fig. 5).
Fig. 4.
Fluorescent images of Lectin-DyLight 594 labeled vasculature in the brain tissue after Lowicryl HM20 resin embedding. (a) Maximum intensity projections of a 20-μm-thick coronal slice. (b-d) Corresponding magnification of regions indicated in (a). (e-g) High magnification images of the boxed regions in (b-d), respectively. All images were acquired using 20 × (NA = 1.0), at a 0.42 × 0.42 × 1.00 μm3 voxel size on a confocal microscope (LSM780, ZEISS). Scale bars: (a) 1 mm; (b-d) 100 μm; (e-g) 30 μm.
Fig. 5.
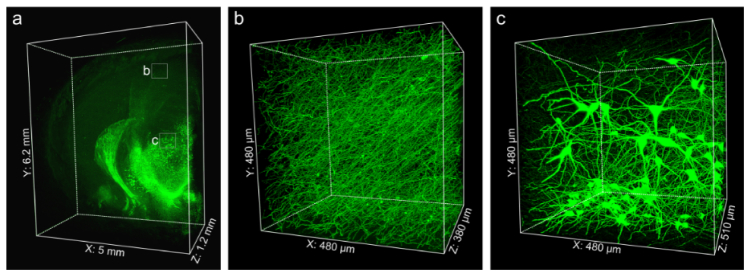
Imaging large volume immunolabeled mouse brain tissue after Lowicryl HM20 resin embedding. (a) 3D presentation of the TH immunolabeled mouse brain block. Enlargements of the fine structures of TH-positive axonal fibers in the cortex (b) and TH-positive soma located in the thalamus (c). Images were acquired by successive high-resolution stage-scanning microscopy at a 0.16 × 0.16 × 1.00 μm3 voxel size. (a) 6200 × 5000 × 1200 μm3; (b) 480 × 480 × 380 μm3; (c) 480 × 480 × 510 μm3.
3.3 High-resolution imaging of large-volume brain tissue
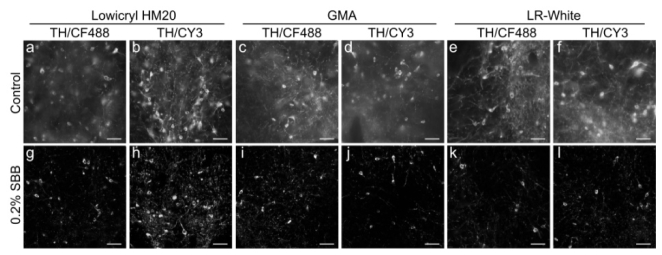
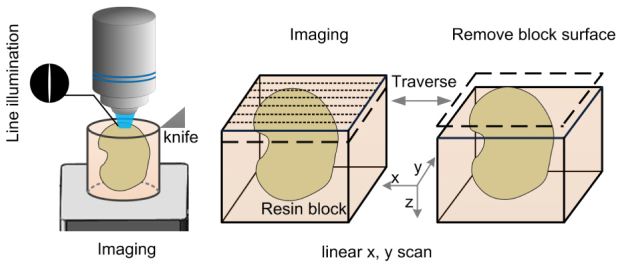
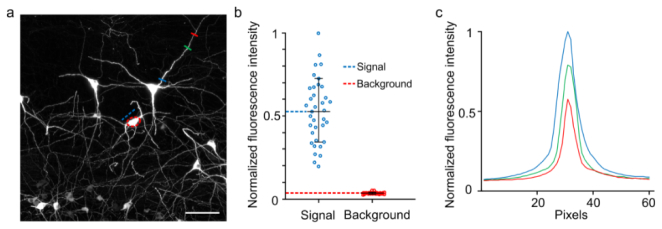
To image IF-labeled large-volume tissue, we tested whether Lowicryl HM20 resin embedding could be used to embed iDISCO stained large tissue blocks. We labeled 1.2-mm-thick brain tissue with TH antibody, and then embedded the tissue in Lowicryl HM20 resin. To reduce the background fluorescence and obtain high-contrast 3D images, we added 0.2% SBB to the Lowicryl HM20 resin (see Fig. 6, Appendix 2). Then, we used the fMOST system based on a stage-scanning line confocal method [27]. In this imaging system, a strip imaging mode was adopted to improve the overall imaging speed, and line-illumination was combined with the sub-array mode of a sCMOS camera to reject the out-of-focus light at some level. After imaging the surface layer, the 3D moving stage drove the specimen toward a fixed diamond knife to remove 1-μm-thick surface layer (see Fig. 7, Appendix 3). In Fig. 5, block tissue imaging data were acquired at a voxel resolution of 0.16 × 0.16 × 1.00 μm3. This data set included 19200 strips in 1200 layers. The 3D reconstruction results illustrated that TH positive neuronal structures were exclusively labeled in the tissue. Figure 5(a) showed a 3D presentation of the mouse brain block. From the enlarged images [Fig. 5(b) and 5(c)], the somas and fine axonal branches in ventral tegmental regions as well as the denser axons innervating the cortex are clearly observed. Further, we could trace the individual axonal fibers out of all the dense labeling of TH-positive axonal fibers in the cortex and other brain regions. In addition, we analyzed the fluorescent intensities of neuronal somas, fibers, and the background. Then we quantitatively evaluated the signal-to-background ratio of these acquired images (more details are shown in Fig. 8, Appendix 4), the calculated ratio of signal to background was 15.1 ± 5.5.
4. Discussion and conclusion
Here, we described a plastic embedding method compatible with IF technique to image large-volume tissue with high resolution. We found that the fluorescence and structural details in brain tissue labeled by various antibodies and tracers could be well preserved in Lowicryl HM20 embedded samples. Using fMOST technique [27] based on ultra-thin slicing and optical imaging, we realized three-dimensional, high-resolution imaging of immunolabeled large-volume samples.
In general, the detected fluorescent intensities of IF-labeled structures are decided by numerous factors, including the labeling efficiency, the number of fluorophores conjugated to the antibody, quantum yield, and the medium [37, 38]. In the embedded tissues, the fluorescent intensity of fluorophores further depends on the resin types and embedding modes [19–23]. In this study, we labeled the brain slices with the same type of primary antibody (anti-TH) and the same type of secondary antibodies with commonly used fluorescent dyes, and embedded the slices in GMA/Lowicryl HM20/LR White resins. Our results showed that the fluorophores could be preserved better in Lowicryl HM20 and GMA, whereas CF568 and CY5 fluorophores degraded more severely in LR White. This decrease might be related to the relatively acid environment in LR White [35]. Considering the cutting performance [39], we chose Lowicryl HM20 resin to embed the IF stained sample. In the same type of resin, the fluorescence behavior of four commonly used fluorescent probes differed from each other, with the intensity of CY3 being generally elevated to about 150% in three resins. These results should provide useful guidance on the selection of the fluorophore in the combination of IF staining with resin embedding.
In the experiment to examine the preservation of fine structure, we specifically chose the virus-labeled neuronal fine structures with weak fluorescent intensity. Out results not only demonstrated that the fine structures, especially neuronal dendrites and axons, were well preserved, but also that the signal amplification of immunohistochemistry was maintained by our method (Figs. 2). We tested many types of primary antibodies, secondary antibodies, and fluorescent tracers (Tables 1-3), and found they all work well in Lowicryl HM20 resins (Figs. 2-4). This confirmed the compatibility of the method and suggested that our method could be used to obtain various biomolecule distribution information.
Finally, we embedded the IF labeled large-volume samples with SBB to lower background fluorescence [26]. We acquired 3D high-resolution images of large biological samples using the fMOST system [27]. This demonstrated that the combination of these techniques has marked potential in large sample high-resolution imaging.
In summary, we reported a method whereby resin embedding might be applied to en bloc immunostained tissues. This approach may also be applicable to high-resolution episcopic microscopy. We believe that the method would be a valuable tool for acquiring molecular distribution in large-volume biological samples at subcellular resolution.
Disclosures
The authors declare that there are no conflicts of interest related to this article.
Acknowledgments
We acknowledge the support from Program 973 (2015CB755603). We thank Yisong Qi, Xiong Yang, Ning Li, Hanqing Xiong, Pei Li, Ke Bai, and Shenghua Cheng for assistance with the experiments and imaging. We thank Yuanlei Yue, Wenyan Guo, Yue Liu, and other members of the Britton Chance Center for Biomedical Photonics for their help with comments and advice for improving the experiments.
Appendix 1
Table 4. The cutting performance of the polymerized tissue block.
| Resin | Blank polymer | Tissue | Cutting performance (1-μm section) |
|---|---|---|---|
| GMA | 73, 74 | 68, 70 | + - |
| LR White | 77, 78 | 73, 75 | + |
| HM20 | 80, 81 | 78, 79 | + + |
The hardness and cutting performance of the polymerized tissue block. After the sample polymerization, the hardness values of the tissue and surrounding blank resin are measured by a Shore D durometer. In the imaging and sectioning process, LR White and Lowicryl HM20 embedded samples can stably and continuously produce 1-μm section. The GMA polymer has lower hardness and is really difficult to yield stable 1-μm sections. (+-): general; (+): good; (++): excellent.
Appendix 2
Fig. 6.
Effects of SBB on background fluorescence in the resin embedded brain tissue. Images obtained from immunostained brain tissue that were embedded in resin (HM20, GMA and LR white) with (g-l) and without 0.2% SBB (control, a-f), respectively. Mouse brain tissue was immunostained with anti-tyrosine hydroxylase primary antibody and CF488 or CY3-conjugated secondary antibodies. All images were recorded at 0.17 × 0.17 μm/pixel on the same wide field microscope (Nikon Ni-E) at room temperature. Scale bar: (a-l): 50 μm.
Appendix 3
Fig. 7.
Schematic diagram for three-dimensional fluorescent imaging. The resin-embedded biological sample was mounted on a precision motion stage that moves between the stage-scanning microscopy and the microtome. Strip imaging methods combined with line illumination were applied for rapid surface imaging. After the surface layer of specimen was imaged, the recorded layer (1-μm thick) was removed by a fixed diamond knife. The sectioning-imaging cycles was repeated for collecting three-dimensional imaging data sets.
Appendix 4
Fig. 8.
Comparison of signal and background fluorescence of the images obtained using successive high-resolution stage-scanning block-face imaging. (a) Maximal intensity projections of the 100-mm thickness z-stacks images without preprocessing. Image stacks were selected from the same data set in Fig. 5. The mean signal intensity was measured from the red dashed circle area. The mean value of the background was measured from a blue dashed line drawn across the background area close to soma. The fluorescent signal intensity was calculated by subtracting the mean value of background from the mean value of the soma. (b) The normalized fluorescent intensities of signal value were compared with background values. 36 somas were measured from different images of the same data set. This result shows that the signal-to-background ratio is 15.1 ± 5.5. (c) Fluorescent intensities of pixels crossed by the blue, green and red lines were plotted in curves with the corresponding color in (a). The signal-to-background ratio values are given as the means ± SD.
References and links
- 1.Alanentalo T., Asayesh A., Morrison H., Lorén C. E., Holmberg D., Sharpe J., Ahlgren U., “Tomographic molecular imaging and 3D quantification within adult mouse organs,” Nat. Methods 4(1), 31–33 (2007). 10.1038/nmeth985 [DOI] [PubMed] [Google Scholar]
- 2.Chung K., Wallace J., Kim S. Y., Kalyanasundaram S., Andalman A. S., Davidson T. J., Mirzabekov J. J., Zalocusky K. A., Mattis J., Denisin A. K., Pak S., Bernstein H., Ramakrishnan C., Grosenick L., Gradinaru V., Deisseroth K., “Structural and molecular interrogation of intact biological systems,” Nature 497(7449), 332–337 (2013). 10.1038/nature12107 [DOI] [PMC free article] [PubMed] [Google Scholar]
- 3.Coons A. H., Creech H. J., Jones R. N., Berliner E., “The demonstration of pneumococcal antigen in tissues by the use of fluorescent antibody,” J. Immunol. 45(3), 159–170 (1942). [Google Scholar]
- 4.Coons A. H., Kaplan M. H., “Localization of antigen in tissue cells; improvements in a method for the detection of antigen by means of fluorescent antibody,” J. Exp. Med. 91(1), 1–13 (1949). 10.1084/jem.91.1.1 [DOI] [PMC free article] [PubMed] [Google Scholar]
- 5.Renier N., Wu Z., Simon D. J., Yang J., Ariel P., Tessier-Lavigne M., “iDISCO: a simple, rapid method to immunolabel large tissue samples for volume imaging,” Cell 159(4), 896–910 (2014). 10.1016/j.cell.2014.10.010 [DOI] [PubMed] [Google Scholar]
- 6.Karma S., Homan J., Stoianovici C., Choi B., “Enhanced fluorescence imaging with DMSO-mediated optical clearing,” J. Innov. Opt. Health Sci. 3(3), 153–158 (2010). 10.1142/S1793545810001015 [DOI] [Google Scholar]
- 7.Yang B., Treweek J. B., Kulkarni R. P., Deverman B. E., Chen C. K., Lubeck E., Shah S., Cai L., Gradinaru V., “Single-cell phenotyping within transparent intact tissue through whole-body clearing,” Cell 158(4), 945–958 (2014). 10.1016/j.cell.2014.07.017 [DOI] [PMC free article] [PubMed] [Google Scholar]
- 8.Murray E., Cho J. H., Goodwin D., Ku T., Swaney J., Kim S. Y., Choi H., Park Y. G., Park J. Y., Hubbert A., McCue M., Vassallo S., Bakh N., Frosch M. P., Wedeen V. J., Seung H. S., Chung K., “Simple, scalable proteomic imaging for high-dimensional profiling of intact systems,” Cell 163(6), 1500–1514 (2015). 10.1016/j.cell.2015.11.025 [DOI] [PMC free article] [PubMed] [Google Scholar]
- 9.Susaki E. A., Tainaka K., Perrin D., Kishino F., Tawara T., Watanabe T. M., Yokoyama C., Onoe H., Eguchi M., Yamaguchi S., Abe T., Kiyonari H., Shimizu Y., Miyawaki A., Yokota H., Ueda H. R., “Whole-brain imaging with single-cell resolution using chemical cocktails and computational analysis,” Cell 157(3), 726–739 (2014). 10.1016/j.cell.2014.03.042 [DOI] [PubMed] [Google Scholar]
- 10.Hama H., Kurokawa H., Kawano H., Ando R., Shimogori T., Noda H., Fukami K., Sakaue-Sawano A., Miyawaki A., “Scale: a chemical approach for fluorescence imaging and reconstruction of transparent mouse brain,” Nat. Neurosci. 14(11), 1481–1488 (2011). 10.1038/nn.2928 [DOI] [PubMed] [Google Scholar]
- 11.Sharpe J., Ahlgren U., Perry P., Hill B., Ross A., Hecksher-Sørensen J., Baldock R., Davidson D., “Optical projection tomography as a tool for 3D microscopy and gene expression studies,” Science 296(5567), 541–545 (2002). 10.1126/science.1068206 [DOI] [PubMed] [Google Scholar]
- 12.Silvestri L., Allegra Mascaro A. L., Lotti J., Sacconi L., Pavone F. S., “Advanced optical techniques to explore brain structure and function,” J. Innov. Opt. Health Sci. 6(1), 1230002 (2013). 10.1142/S1793545812300029 [DOI] [Google Scholar]
- 13.Wilt B. A., Burns L. D., Wei Ho E. T., Ghosh K. K., Mukamel E. A., Schnitzer M. J., “Advances in light microscopy for neuroscience,” Annu. Rev. Neurosci. 32(1), 435–506 (2009). 10.1146/annurev.neuro.051508.135540 [DOI] [PMC free article] [PubMed] [Google Scholar]
- 14.Weninger W. J., Geyer S. H., Mohun T. J., Rasskin-Gutman D., Matsui T., Ribeiro I., Costa L. F., Izpisúa-Belmonte J. C., Müller G. B., “High-resolution episcopic microscopy: a rapid technique for high detailed 3D analysis of gene activity in the context of tissue architecture and morphology,” Anat. Embryol. (Berl.) 211(3), 213–221 (2006). 10.1007/s00429-005-0073-x [DOI] [PubMed] [Google Scholar]
- 15.Li A., Gong H., Zhang B., Wang Q., Yan C., Wu J., Liu Q., Zeng S., Luo Q., “Micro-optical sectioning tomography to obtain a high-resolution atlas of the mouse brain,” Science 330(6009), 1404–1408 (2010). 10.1126/science.1191776 [DOI] [PubMed] [Google Scholar]
- 16.Zheng T., Yang Z., Li A., Lv X., Zhou Z., Wang X., Qi X., Li S., Luo Q., Gong H., Zeng S., “Visualization of brain circuits using two-photon fluorescence micro-optical sectioning tomography,” Opt. Express 21(8), 9839–9850 (2013). 10.1364/OE.21.009839 [DOI] [PubMed] [Google Scholar]
- 17.Gong H., Zeng S., Yan C., Lv X., Yang Z., Xu T., Feng Z., Ding W., Qi X., Li A., Wu J., Luo Q., “Continuously tracing brain-wide long-distance axonal projections in mice at a one-micron voxel resolution,” Neuroimage 74, 87–98 (2013). 10.1016/j.neuroimage.2013.02.005 [DOI] [PubMed] [Google Scholar]
- 18.Zhang B., Li A., Yang Z., Wu J., Luo Q., Gong H., “Modified Golgi-Cox method for micrometer scale sectioning of the whole mouse brain,” J. Neurosci. Methods 197(1), 1–5 (2011). 10.1016/j.jneumeth.2010.10.001 [DOI] [PubMed] [Google Scholar]
- 19.Biel S. S., Kawaschinski K., Wittern K. P., Hintze U., Wepf R., “From tissue to cellular ultrastructure: closing the gap between micro- and nanostructural imaging,” J. Microsc. 212(1), 91–99 (2003). 10.1046/j.1365-2818.2003.01227.x [DOI] [PubMed] [Google Scholar]
- 20.Wessel S., Pagel S., Ritter M., Hohenberg H., Wepf R., “Topographic Measurements of Real Structures in reflection Confocal Laser Scanning Microscope (CLSM),” Microsc. Microanal. 9(S03), 162–163 (2003). [Google Scholar]
- 21.Perkovic M., Kunz M., Endesfelder U., Bunse S., Wigge C., Yu Z., Hodirnau V. V., Scheffer M. P., Seybert A., Malkusch S., Schuman E. M., Heilemann M., Frangakis A. S., “Correlative light- and electron microscopy with chemical tags,” J. Struct. Biol. 186(2), 205–213 (2014). 10.1016/j.jsb.2014.03.018 [DOI] [PMC free article] [PubMed] [Google Scholar]
- 22.Kim D., Deerinck T. J., Sigal Y. M., Babcock H. P., Ellisman M. H., Zhuang X., “Correlative stochastic optical reconstruction microscopy and electron microscopy,” PLoS One 10(4), e0124581 (2015). 10.1371/journal.pone.0124581 [DOI] [PMC free article] [PubMed] [Google Scholar]
- 23.Burette A., Khatri L., Wyszynski M., Sheng M., Ziff E. B., Weinberg R. J., “Differential cellular and subcellular localization of ampa receptor-binding protein and glutamate receptor-interacting protein,” J. Neurosci. 21(2), 495–503 (2001). [DOI] [PMC free article] [PubMed] [Google Scholar]
- 24.Gang Y., Zhou H., Jia Y., Liu L., Liu X., Rao G., Li L., Wang X., Lv X., Xiong H., Yang Z., Luo Q., Gong H., Zeng S., “Embedding and chemical reactivation of green fluorescent protein in the whole mouse brain for optical micro-imaging,” Front. Neurosci. 11, 121 (2017). 10.3389/fnins.2017.00121 [DOI] [PMC free article] [PubMed] [Google Scholar]
- 25.Sun Y., Yu H., Zheng D., Cao Q., Wang Y., Harris D., Wang Y., “Sudan black B reduces autofluorescence in murine renal tissue,” Arch. Pathol. Lab. Med. 135(10), 1335–1342 (2011). 10.5858/arpa.2010-0549-OA [DOI] [PubMed] [Google Scholar]
- 26.Gong H., Xu D., Yuan J., Li X., Guo C., Peng J., Li Y., Schwarz L. A., Li A., Hu B., Xiong B., Sun Q., Zhang Y., Liu J., Zhong Q., Xu T., Zeng S., Luo Q., “High-throughput dual-colour precision imaging for brain-wide connectome with cytoarchitectonic landmarks at the cellular level,” Nat. Commun. 7, 12142 (2016). 10.1038/ncomms12142 [DOI] [PMC free article] [PubMed] [Google Scholar]
- 27.Yang T., Zheng T., Shang Z., Wang X., Lv X., Yuan J., Zeng S., “Rapid imaging of large tissues using high-resolution stage-scanning microscopy,” Biomed. Opt. Express 6(5), 1867–1875 (2015). 10.1364/BOE.6.001867 [DOI] [PMC free article] [PubMed] [Google Scholar]
- 28.Wu J., He Y., Yang Z., Guo C., Luo Q., Zhou W., Chen S., Li A., Xiong B., Jiang T., Gong H., “3D BrainCV: simultaneous visualization and analysis of cells and capillaries in a whole mouse brain with one-micron voxel resolution,” Neuroimage 87, 199–208 (2014). 10.1016/j.neuroimage.2013.10.036 [DOI] [PubMed] [Google Scholar]
- 29.Quan T., Zhou H., Li J., Li S., Li A., Li Y., Lv X., Luo Q., Gong H., Zeng S., “NeuroGPS-Tree: automatic reconstruction of large-scale neuronal populations with dense neurites,” Nat. Methods 13(1), 51–54 (2016). [DOI] [PubMed] [Google Scholar]
- 30.Li J., Quan T., Li S., Zhou H., Luo Q., Gong H., Zeng S., “Reconstruction of micron resolution mouse brain surface from large-scale imaging dataset using resampling-based variational model,” Sci. Rep. 5(1), 12782 (2015). 10.1038/srep12782 [DOI] [PMC free article] [PubMed] [Google Scholar]
- 31.Quan T., Zheng T., Yang Z., Ding W., Li S., Li J., Zhou H., Luo Q., Gong H., Zeng S., “NeuroGPS: automated localization of neurons for brain circuits using L1 minimization model,” Sci. Rep. 3(1), 1414 (2013). 10.1038/srep01414 [DOI] [PMC free article] [PubMed] [Google Scholar]
- 32.Li S., Zhou H., Quan T., Li J., Li Y., Li A., Luo Q., Gong H., Zeng S., “SparseTracer: the reconstruction of discontinuous neuronal morphology in noisy images,” Neuroinformatics 15(2), 133–149 (2017). 10.1007/s12021-016-9317-6 [DOI] [PubMed] [Google Scholar]
- 33.Newman S. B., Borysko E., Swerdlow M., “New sectioning techniques for light and electron microscopy,” Science 110(2846), 66–68 (1949). 10.1126/science.110.2846.66 [DOI] [PubMed] [Google Scholar]
- 34.Newman G. R., Hobot J. A., “Resins for combined light and electron microscopy: a half century of development,” Histochem. J. 31(8), 495–505 (1999). 10.1023/A:1003850921869 [DOI] [PubMed] [Google Scholar]
- 35.Yang Z., Hu B., Zhang Y., Luo Q., Gong H., “Development of a plastic embedding method for large-volume and fluorescent-protein-expressing tissues,” PLoS One 8(4), e60877 (2013). 10.1371/journal.pone.0060877 [DOI] [PMC free article] [PubMed] [Google Scholar]
- 36.Xiong H., Zhou Z., Zhu M., Lv X., Li A., Li S., Li L., Yang T., Wang S., Yang Z., Xu T., Luo Q., Gong H., Zeng S., “Chemical reactivation of quenched fluorescent protein molecules enables resin-embedded fluorescence microimaging,” Nat. Commun. 5, 3992 (2014). 10.1038/ncomms4992 [DOI] [PMC free article] [PubMed] [Google Scholar]
- 37.Karreman M. A., Agronskaia A. V., van Donselaar E. G., Vocking K., Fereidouni F., Humbel B. M., Verrips C. T., Verkleij A. J., Gerritsen H. C., “Optimizing immuno-labeling for correlative fluorescence and electron microscopy on a single specimen,” J. Struct. Biol. 180(2), 382–386 (2012). 10.1016/j.jsb.2012.09.002 [DOI] [PubMed] [Google Scholar]
- 38.Ramos-Vara J. A., “Technical aspects of immunohistochemistry,” Vet. Pathol. 42(4), 405–426 (2005). 10.1354/vp.42-4-405 [DOI] [PubMed] [Google Scholar]
- 39.Collman F., Buchanan J., Phend K. D., Micheva K. D., Weinberg R. J., Smith S. J., “Mapping synapses by conjugate light-electron array tomography,” J. Neurosci. 35(14), 5792–5807 (2015). 10.1523/JNEUROSCI.4274-14.2015 [DOI] [PMC free article] [PubMed] [Google Scholar]


