Abstract
Polarization imaging has been recognized as a potentially powerful technique for probing the microstructural information and optical properties of complex biological specimens. Recently, we have reported a Mueller matrix microscope by adding the polarization state generator and analyzer (PSG and PSA) to a commercial transmission-light microscope, and applied it to differentiate human liver and cervical cancerous tissues with fibrosis. In this paper, we apply the Mueller matrix microscope for quantitative detection of human breast ductal carcinoma samples at different stages. The Mueller matrix polar decomposition and transformation parameters of the breast ductal tissues in different regions and at different stages are calculated and analyzed. For more quantitative comparisons, several widely-used image texture feature parameters are also calculated to characterize the difference in the polarimetric images. The experimental results indicate that the Mueller matrix microscope and the polarization parameters can facilitate the quantitative detection of breast ductal carcinoma tissues at different stages.
OCIS codes: (110.5405) Polarimetric imaging; (170.3880) Medical and biological imaging; (290.5855) Scattering, polarization
1. Introduction
Breast cancers are prevalent and account for 15% of all cancer deaths in women worldwide [1–3]. A large number of cancer statistics show that the incidence of breast cancer is expected to increase rapidly with human development [4]. There are more than 20 distinct histopathological subtypes of breast carcinoma due to the complexity of genetic and epigenetic changes [5]. Clinically, breast ductal carcinoma is a primary form of cancer, and can be divided into in situ and invasive stages according to size and microstructural features [6]. Compared with patients diagnosed at the most advanced stage, the 5 year survival of patients diagnosed at an early stage increases as much as 6-fold [7]. Clearly early diagnosis is crucial for treatment of breast cancer. Currently, the gold standard of cancer diagnosis is the pathological observation of histological tissue slices using optical microscopy, which requires physical tissue sections to be stained with certain dyes such as hematoxylin and eosin (H and E), and evaluation by experienced pathologists [8,9]. Recently, more and more optical techniques have been applied to breast carcinoma tissues in order to extract possible indicators for characteristic pathological structural features. For instance, some researches have demonstrated that second harmonic generation (SHG) microscopy can help to determine the changes of collagen ultrastructure in different types of breast cancer tissues [10].
Polarization imaging is regarded as a promising technique for probing the microstructures, especially the anisotropic fibrous components of complex scattering samples [11,12]. Among the available polarimetric techniques, Mueller matrix imaging has many distinctive advantages, such as providing label-free and comprehensive descriptions on the properties of tissues, cells, and other biological specimens [13–16]. Polarization techniques including Mueller matrix polarimetry can help to improve the image contrast of the superficial layers of tissues by eliminating multiply scattered photons from the deep layers [17,18]. The previous literature shows that more than 85% of cancers originate from the superficial epithelium, which means that polarization imaging methods have great potential in screening and identifying cancer at an early stage [19,20]. Therefore, Mueller matrix polarimetry has been used to assist the diagnosis of various cancerous tissues, such as skin cancer [21], cervical cancer [22], colon cancer [23], liver cancer [24,25], and so on [26,27]. Recently, we have designed a Mueller matrix microscope by adding a polarization state generator and analyzer (PSG and PSA) to a commercial transmission-light microscope and applied it to detect human liver and cervical cancerous tissues with fibrosis [24,25]. With the advantages of simple structure, fast imaging speed and low cost, the Mueller matrix microscope shows good prospects for the detection of fibrous structures. Since the changes in density and distribution of the fibrous structures are important characteristic features during the development process of breast ductal carcinoma [28,29], the Mueller matrix microscope and transformed polarization parameters may provide more information for diagnosis than ordinary optical microscopy.
In this paper, we choose normal breast ductal tissue, ductal carcinoma in situ and invasive ductal carcinoma tissue slices, and measure their microscopic Mueller matrix images. Then we analyze the images by calculating polarization parameters using Mueller matrix polar decomposition (MMPD) and Mueller matrix transformation (MMT) and their corresponding image texture feature parameters derived from the gray level co-occurrence matrix (GLCM) quantitatively. The experimental results indicate that the Mueller matrix microscope and the polarization parameters can facilitate the quantitative detection of breast ductal carcinoma tissues at different stages.
2. Methods and materials
2.1 Experimental setup
As shown in Fig. 1, a commercial transmission-light microscope (L2050, Liss Optical Instrument Factory, Guangzhou, China) is upgraded to the Mueller matrix microscope by adding a polarization state generator (PSG) and polarization state analyzer (PSA) to the existing optical path. The illuminating light from the LED (3 W, 632 nm, Δλ = 20 nm) passes through the PSG which consists of a polarizer (P1, extinction ratio 500:1, Daheng Optics, China) and a rotatable quarter-wave plate (R1, Daheng Optics, China). The light beams of different polarization states then transmit the tissue sample on the stage, the objective lens, and then the PSA composed by another rotatable quarter-wave plate (R2, Daheng Optics, China) and polarizer (P2, extinction ratio 500:1, Daheng Optics, China). In order to be incorporated into the microscope, both the PSG and PSA have been designed to be compact modules. Finally the photons are recorded by a 12-bit CCD camera (QImaging 74-0107A, Canada).
Fig. 1.
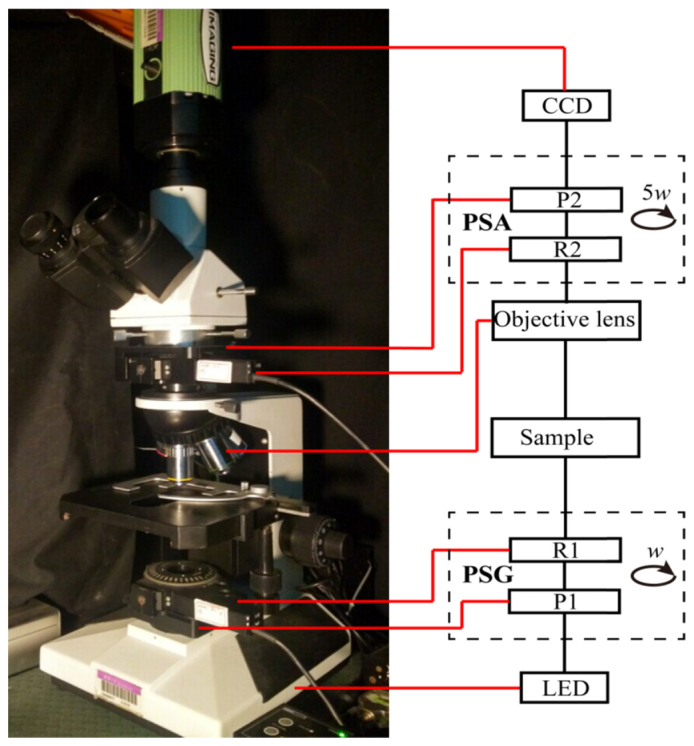
Photograph and schematic of the Mueller matrix microscope. P: polarizer; R: quarter-wave plate; PSG: polarization state generator; PSA: polarization state analyzer.
In each measurement, the polarizers (P1, P2) are fixed in the horizontal direction, while the two retarders (R1, R2) rotate with the fixed rates ω2 = 5ω1. The Mueller matrix elements can be calculated by using the Fourier coefficients αn and βn shown as Eq. (1) [30,31]. Before being applied to tissue samples, we calibrated the microscope by measuring the Mueller matrices of air, a polarizer, and a quarter-wave plate, and the experimental results testified that the maximum errors of the Mueller matrix microscope are about 1%.
| (1) |
2.2 Mueller matrix polar decomposition and Mueller matrix transformation parameters
As indicated by some recent studies, Mueller matrix polarimetry is a potentially powerful technique for probing the microstructural and optical properties of samples, hence it may be used as a tool for biomedical studies and practice. However, the individual Mueller matrix elements often lack explicit connections to the certain characteristic tissue microstructures, bringing difficulties in applying Mueller matrix polarimetry to practical applications directly. In order to decode the structural information contained in the 16 Mueller matrix elements, we use the polarization parameters with physical meanings derived from the Mueller matrix polar decomposition (MMPD) and Mueller matrix transformation (MMT) processes. The MMPD method proposed by Lu and Chipman is based on the three main interactions between the polarized light and media: diattenuation (D), retardation (δ), and depolarization (Δ) [32]. The MMPD parameters representing the polarization properties are not sensitive to the azimuthal orientation of the sample and have been applied to studies of various cancerous tissues including the detection of cervical cancer [33], colon cancer [23], and skin cancer [21]. In this study, we use the linear retardance (δ) and its orientation angle (θ), which can be derived from the decomposed Mueller matrix (M) shown as Eq. (2).
| (2) |
In Eq. (2) MR is the sub-matrix of retardance, r1 and r2 are the elements of the vector of retardance [34].
In our previous studies on fibrous scattering samples, we proposed the Mueller matrix transformation (MMT) technique to extract a group of parameters which are related to certain structural features of the samples [35]. Equation (3) defines two MMT parameters used in this study.
| (3) |
Both the experimental and simulation results have shown that the MMPD parameter δ and MMT parameter t are closely related to the density of the fibrous structures, while the MMPD parameter θ and MMT parameter x represent the orientation direction of the fibrous structures in tissue slices [16,21,25,36]. The values of the parameters δ and t and the distribution behavior of the parameters θ and x may be used to indicate the density and orientation of the fibrous structures in breast duct tissue sections. Although the MMPD and MMT parameters can both be used for the detections of fibers, they have different advantages: our previous study have shown that the MMPD parameters are slightly more sensitive to the fibers, whereas the MMT parameters are easier and quicker to compute [25].
2.3 Breast duct tissue sample
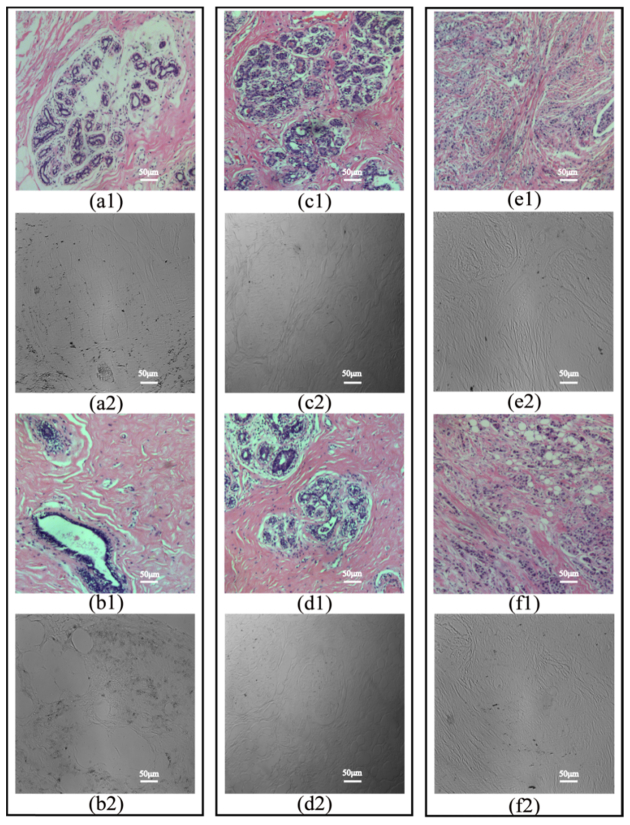
Clinically, different stages of breast ductal carcinoma tissues have different proportions and distribution behaviors of fibrous structures in and around the breast catheters [10,28,29]. In this work, the samples are unstained, dewaxed sections of human breast ductal carcinoma tissue slices at different stages provided by Shenzhen Sixth People’s (Nanshan) Hospital. For the tissues in stages 1 (normal), 2 (ductal carcinoma in situ) and 3 (invasive ductal carcinoma), we select two 12-µm-thick slices as Figs. 2(a2)-(f2). For histological comparison, the corresponding 4-μm-thick hematoxylin and eosin (H and E) stained slices as shown in Figs. 2(a1)-(f1) were also prepared. This work was approved by the Ethics Committee of the Shenzhen Sixth People’s (Nanshan) Hospital.
Fig. 2.
Microscopic intensity images of the H and E stained slices of breast ductal tissues at different pathological stages: (a1), (b1) samples 1 and 2 in stage 1 respectively; (c1), (d1) samples 3 and 4 in stage 2 respectively; (e1), (f1) samples 5 and 6 in stage 3 respectively, and the corresponding 12-µm-thick unstained dewaxed slices of breast ductal tissues: (a2), (b2) samples 1 and 2 in stage 1 respectively, (c2), (d2) samples 3 and 4 in stage 2 respectively, (e2), (f2) samples 5 and 6 in stage 3 respectively.
2.4 Gray level co-occurrence matrix for image texture analysis
We explored the use of image texture features to quantitatively characterize difference among the healthy, carcinoma in situ and invasive cancer samples. It is normally necessary for pathologists to identify duct areas under the microscope to further stage the samples. Inspired by this process, duct areas in each MMPD and MMT parameters image were manually segmented from the surrounding tissues according to the information provided by the corresponding H and E stained images (Matlab and an open source software Ilastik were used in the segmentation process). The mean (M), standard deviation (S), and image texture parameters of the duct and non-duct areas in the images were obtained and analyzed. The gray level co-occurrence matrix (GLCM) method is widely used for image texture analysis [37,38]. The GLCM refers to a matrix that is defined over an image to be the distribution of co-occurring pixel greyscale values at a given offset. GLCM can be further used to calculate: 1) the texture contrast (Ct), which measures the intensity contrast between a pixel and its neighbor over the analyzed image region of interest (ROI); 2) the correlation (Cr) that characterizes how correlated a pixel is to its neighbor over the ROI; 3) the energy (Er) which is a measure of the uniformity of the ROI. The equations to calculate these texture parameters from the GLCM can be found in [39]. In this study, the GLCM was obtained using the Matlab (graycomatrix function), the contrast and correlation statistics were then calculated from the obtained GLCM using the Matlab (graycoprops function [39]).
Since the parameters δ and t, and the parameters θ and x have highly similar characteristic features (which will be shown in Section 3), the quantitative characterization was only conducted for MMPD δ and θ images. For the MMPD-δ images (the maximum δ values for all the samples were smaller than 1 rad), the function parameters of “graycomatrix” - the range used to scale the input image into gray levels was set as [0 1]; the number of gray levels was set as 20, and the distance between the pixel of interest and its neighbor as [1 0]. The θ images (ranging from −90° to 90°) were normalized to 0-1 (0 for −90°, 0.5 for 0°, 1 for 90°). The function parameters - the range used to scale the input image into gray levels was set as [0 1], the number of gray levels as 8, and the distance between the pixel of interest and its neighbor as [1 0]. The texture parameters were then calculated from the obtained GLCM using the “graycoprops” function. The segmentation masks generated from each MMPD δ image were then applied to calculate the above mentioned parameters from the θ, t, and x images.
3. Results and discussion
3.1 Microscopic imaging results of mammary tissue samples
Figures 2(a2)-(f2) show the microscopic intensity images of the 12-µm-thick unstained dewaxed slices of the breast duct tissues in different pathological stages under 10 × objective observation, while Figs. 2(a1)-(f1) show the microscopic images of the corresponding H and E stained slices: (a), (b) the normal ductal tissues for stage 1; (c), (d) the ductal carcinoma in situ tissues for stage 2; (e), (f) the invasive ductal carcinoma tissues for stage 3. From the images of the MMPD and MMT parameters δ, t, θ and x, structural information and polarization properties of the same unstained dewaxed tissue slices as shown in Figs. 3–5 will be described without requiring the use of exogenous contrast agents.
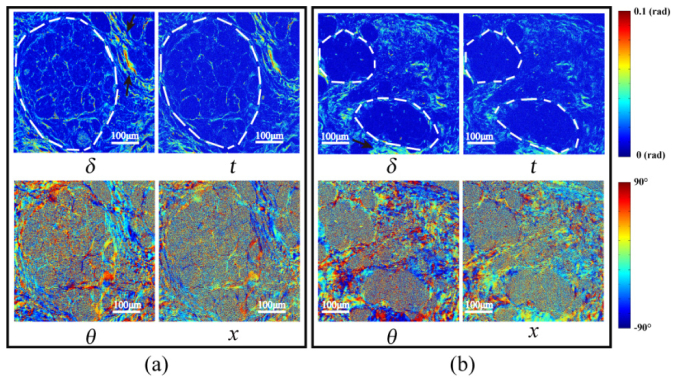
Fig. 3.
Images of MMPD and MMT parameters of the 12-µm-thick unstained dewaxed slices of normal breast ductal tissue in stage 1: (a) sample 1; (b) sample 2.
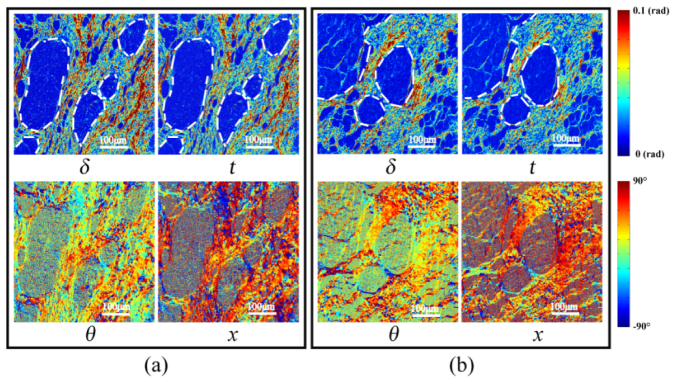
Fig. 5.
Images of MMPD and MMT parameters of the 12-µm-thick unstained dewaxed slices of breast invasive ductal carcinoma tissue in stage 3: (a) sample 5; (b) sample 6. Black arrows indicate the areas within the ducts.
We can see that the parameters derived from Mueller matrix, t, δ and x, θ, are good indicators of the retardance values and directions of the fibrous structures, respectively. The images of the parameters δ and t are shown in Fig. 3, with the boundaries of the breast ducts in stage 1 marked by the white dotted lines. We can see that the δ and t values of the fibrous structural components surrounding the lumen are slightly higher than those in the internal regions of the ducts, indicating that the retardance of the tissues around the ducts is more prominent than that inside. It can also be observed that the upper right regions in sample 1 and the lower middle regions in sample 2 (indicated by black arrows) have the largest values of δ and t, which indicates that the densest fibers are located here. Moreover, in the microscopic images of the parameters θ and x in Fig. 3, the alignment orientation directions of the fibers are shown to be roughly circular aligned in the peripheral regions surrounding the ducts, which is consistent with the microstructural description of the breast ductal tissues according to the microscopic images of the corresponding H and E stained slices shown in Fig. 2.
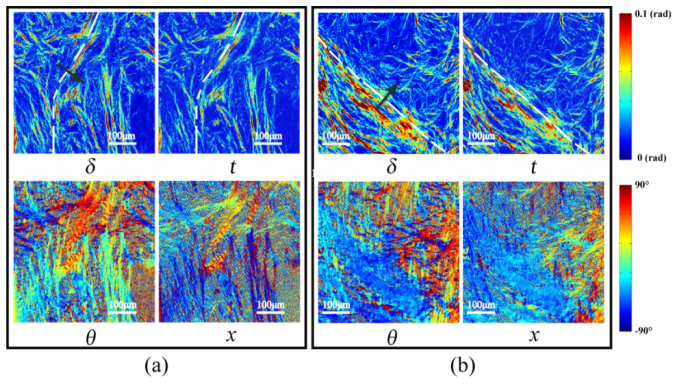
Then we applied Mueller matrix microscopy to the breast ductal carcinoma in situ samples 3 and 4 whose microscopic intensity images under 10 × objective observations are shown in Figs. 2(c2) and (d2), respectively. As shown in Fig. 4, the boundaries of the breast ducts containing in situ carcinoma tissues at stage 2 are marked by the white dotted lines in the images of parameters δ and t. The structures surrounding the ducts are much more obvious with significantly increased values of parameters δ and t compared with the values in stage 1, caused by inflammatory reactions induced by the carcinoma cells and increased fibrosis, and confirmed by comparison with corresponding H and E stained slices shown in Figs. 2(c1) and (d1). The proportion of the sample occupied by fibrous structures in samples 3 and 4 has been calculated to be 3 to 4 times higher than for stage 1. Moreover from the images of parameters θ and x, it can be observed that the aligned fibrotic areas immediately surrounding the ducts have clear circumferentially varying orientation.
Fig. 4.
Images of MMPD and MMT parameters of the 12-µm-thick unstained dewaxed slices of breast ductal carcinoma in situ for stage 2: (a) sample 3; (b) sample 4.
Finally, we imaged the 12-µm-thick unstained slices of stage 3 invasive ductal carcinoma, whose microscopic intensity images under 10 × objective observations are shown in Figs. 2 (e2) and (f2). The white dotted lines in Fig. 5 represent the approximate borders of the ductal regions. From the images of parameters δ and t we can observe that the fibers are distributed very differently compared with stages 1 and 2, with high retardance structures becoming prominent not just in the areas surrounding ducts but also within the ducts themselves. Furthermore the retardance for stage 3 is reduced slightly compared to stage 2 for regions surrounding the ducts. This means that when the ductal carcinoma tissues develop invasively, there are fibers both within and without the ducts, making their boundaries indistinct. The overall proportion of fibers in samples 5 and 6 have been calculated to be 2 to 3 times as much as the values in stage 1. What is more, the images of parameters θ and x shown in Fig. 5 also confirm that the fibers are distributed over a wider range of angles with more disordered orientations for stage 3. By comparison with the H and E stained images in Figs. 2(e1) and (f1), we can see that the carcinoma cells proliferate and penetrate through the basement membrane of the duct, spreading out to invade the surrounding tissues.
The results shown in Figs. 3–5 demonstrate that the microscopic MMPD and MMT parameters can provide useful information to distinguish the different stages of breast ductal carcinoma. In the process of carcinogenesis, the characteristic feature distribution, and the proportions of the fibers both inside and around the ducts are significantly changed, and can be clearly detected through the microscopic Mueller matrix parameters.
3.2 Quantitative characterization of the polarimetric images of the healthy, carcinoma in situ and invasive cancer samples
The image texture analysis was inspired by the initial visual inspection of the reconstructed polarization images (namely δ-, θ-, x-, t- images) of the samples shown in Figs. 3–5. It was clearly observed that the stages of the samples can be well differentiated according to the image textures (e.g. local image contrast, homogeneity of local structures) perceived by human eyes. For example, in MMPD δ-images, the sample at stage 3 can be told apart from the other two stages by identifying the exceptionally high contrast image textures inside the breast duct due to the invasion of ductal carcinoma tissues; compared to stage 1, the non-ductal regions of the samples at stage 2 generally have higher texture contrast and lower homogeneity due to fibrosis induced birefringence. However such perception is subjective and does not have potential to be automated. Here, besides mean values and standard deviation, the gray level co-occurrence matrix based image texture analysis was used for these sets of experiments as an “objective and quantitative” method to characterize the reconstructed polarization images of all the samples, so that the difference among the healthy, carcinoma in situ and invasive cancer samples can be objectively assessed. Based on these texture parameters as well as mean values and standard deviation, there is a potential to automate the staging process, resulting in acceleration of diagnosis and potentially facilitating the training procedure to pathologists.
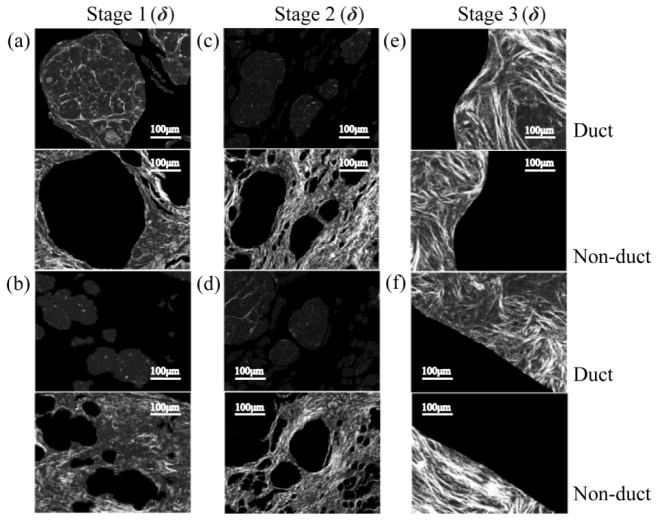
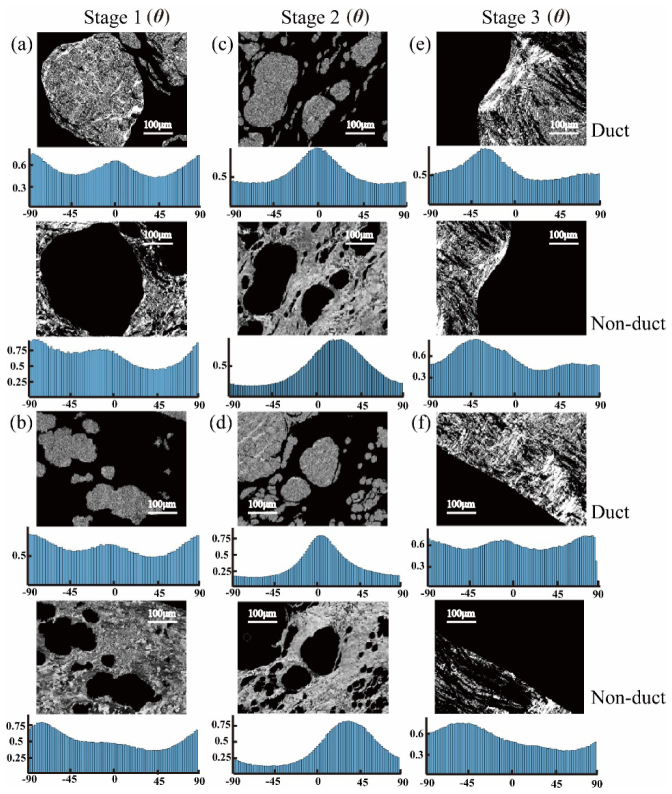
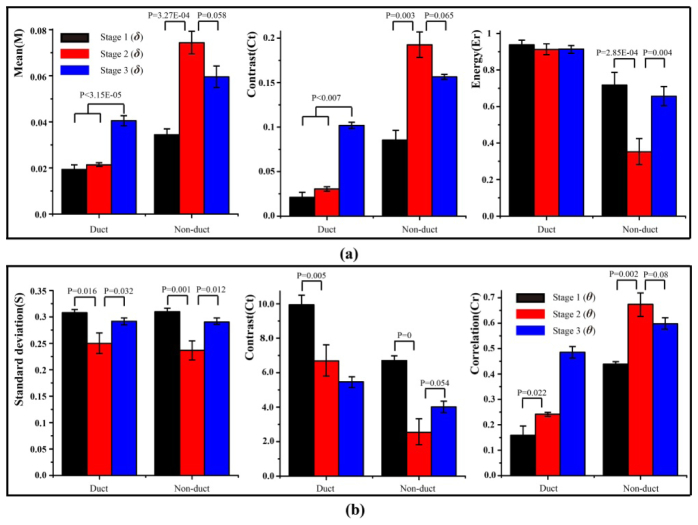
The values of corresponding image texture parameters of 18 samples in different stages (6 samples for each stage) are presented in bar charts (Fig. 8). Since the parameters δ and t, and the parameters θ and x have highly similar characteristic features, for example, in this particular case, the average values of the fibrous areas calculated by the MMPD parameter δ and MMT parameter t are 0.084 and 0.072 respectively in stage 1, here we demonstrated the quantitative characterization only for δ and θ images. The image segmentation results of δ and θ images for the samples are shown as Fig. 6 and Fig. 7, respectively. The images of the MMPD and MMT parameters of the added 12 samples are not shown here since they are very similar to those shown in Figs. 3–5. We can conclude from Fig. 8 that: (1) for the retardance parameter δ, in the regions outside the ducts (referred to as non-duct), the M and Ct increase, while Er decreases significantly in stage 2 (P = 2.85E-04), compared with those in stage 1. In the regions outside the ducts, M and Ct decrease, while Er increases prominently in stage 3 with respect to stage 2 (P = 0.004). Meanwhile, compared with the values of M, Ct and Er inside the ducts in stage 1 and stage 2, in stage 3 M and Ct increase, while Er remains almost the same. (2) The standard deviation (S) of parameter θ is closely related to the degree of order of the fibers: a larger standard deviation reveals a wider distribution of statistical distribution histograms as shown in Fig. 7, or more disordered fibrous structures in tissues. For the outside ducts tissues, the values of S in stage 2 decrease compared with the values in stage 1 and 3, which indicates that there are more well-ordered fibers in this stage. Meanwhile, compared with the values of Ct and Cr in stage 1, in stage 2 Ct decreases both inside (P = 0.005) and outside (P = 0) the ducts significantly, while Cr increases both inside (P = 0.022) and outside (P = 0.002) the ducts prominently. Then in stage 3, Ct increases and Cr decreases outside the ducts. Besides, from the statistical distribution histograms of parameters θ in different pathological stages shown in Fig. 7, we can see that, the distribution of the fibers obviously converged to certain values for carcinoma in situ tissues (Fig. 7(c) and 7(d)), while for normal (Fig. 7(a) and 7(b)) and invasive carcinoma tissues (Fig. 7(e) and 7(f)), they have relatively uniform dispersions.
Fig. 6.
Duct areas (in the first and third row) and non-duct areas (in the second and fourth row) of sample 1-6 were separated based on parameter δ for further quantitative characterization and analysis: (a), (b) stage 1 (samples 1&2); (c), (d) stage 2 (samples 3&4); (e), (f) stage 3 (samples 5&6).
Fig. 7.
Gray image segmentation results of breast ductal tissues in different pathological stages based on parameter θ: (a), (b) stage 1 (samples 1&2); (c), (d) stage 2 (samples 3&4); (e), (f) stage 3 (samples 5&6). Corresponding statistical distribution histograms of θ are provided under the gray image segmentation results.
Fig. 8.
Image texture parameters for duct and non-duct areas of 18 samples in different stages (6 samples for each stage): (a) M, Ct and Er of parameter δ, (b) S, Ct and Cr of parameters θ. P is the P-value between the two sets of experimental data in different stages, which is obtained by the significance test method in statistics (P < 0.05 is significant).
In summary, the values of M, Ct and Er of MMPD δ images can reveal different pathological stages of breast ductal tissues. For MMPD θ, the values of S, Ct and Cr represent obvious differences for the normal, carcinoma in situ and invasive carcinoma ductal tissues. Although more detailed studies are still needed, the preliminary experimental results suggested that the Mueller matrix derived parameters and their corresponding image texture parameters may have potential to become indices that can help to determine the stage of the breast ductal carcinoma tissues, which have different proportions and distributions of fibrous structures.
4. Conclusion
In summary, we applied the Mueller matrix microscope to facilitate the quantitative detection of the normal breast ductal tissue, ductal carcinoma in situ and invasive ductal carcinoma tissues. The 2D images of MMPD and MMT parameters δ, t, θ and x of unstained breast duct tissues at different stages are calculated and analyzed. For more quantitative comparisons, duct areas were manually segmented and several widely-used image texture feature parameters were calculated to characterize the difference in the δ and θ images. Compared with those in stage 1, the characteristic features of the parameters in stage 2 can be summarized as: for the δ images M and Ct increase, while Er decreases significantly outside the duct; for the θ images S and Ct decrease, while Cr increases both inside and outside the ducts prominently. Then the characteristic features of the parameters in stage 3 compared with those in stage 2 can be summarized as: M and Ct increase inside the ducts, and Er increases prominently outside the duct for the δ images; for the θ images Ct increases and Cr decreases outside the ducts. The results have shown that, for the δ images the values of M, Ct and Er can reveal different pathological stages of breast ductal tissues, and for the θ images the values of S, Ct and Cr represent obvious differences for the normal, carcinoma in situ and invasive carcinoma ductal tissues. The experimental results indicate that, although more detailed studies are still needed, the microscopic Mueller matrix derived parameters and their corresponding image texture parameters may have potential to become indices that can determine the breast ductal carcinoma tissues in different stages.
Disclosures
The authors declare that there are no conflicts of interest related to this article.
Funding
This study was supported by National Natural Science Foundation of China (NSFC) (No. 61405102, 11611130168, 61527826), the Royal Society International Exchange Scheme Award IE150970, and the Science and Technology Project of Shenzhen (No. GJHZ20150316160614844).
References and links
- 1.Parkin D. M., Bray F., Ferlay J., Pisani P., “Estimating the world cancer burden: Globocan 2000,” Int. J. Cancer 94(2), 153–156 (2001). 10.1002/ijc.1440 [DOI] [PubMed] [Google Scholar]
- 2.Siegel R., Ma J., Zou Z., Jemal A., “Cancer statistics, 2014,” CA Cancer J. Clin. 64(1), 9–29 (2014). 10.3322/caac.21208 [DOI] [PubMed] [Google Scholar]
- 3.Jemal A., Ward E., Thun M. J., “Recent trends in breast cancer incidence rates by age and tumor characteristics among U.S. women,” Breast Cancer Res. 9(3), R28 (2007). 10.1186/bcr1672 [DOI] [PMC free article] [PubMed] [Google Scholar]
- 4.Ginsburg O., Bray F., Coleman M. P., Vanderpuye V., Eniu A., Kotha S. R., Sarker M., Huong T. T., Allemani C., Dvaladze A., Gralow J., Yeates K., Taylor C., Oomman N., Krishnan S., Sullivan R., Kombe D., Blas M. M., Parham G., Kassami N., Conteh L., “The global burden of women’s cancers: a grand challenge in global health,” Lancet 389(10071), 847–860 (2017). 10.1016/S0140-6736(16)31392-7 [DOI] [PMC free article] [PubMed] [Google Scholar]
- 5.Lakhani S. R., Ellis I. O., Schnitt S. J., Tan P. H., van de Vijver M. J., “World Health Organisation classification of tumors of the breast,” Lyon, France: International Agency for Research on Cancer (IARC) (2012). [Google Scholar]
- 6.National Comprehensive Cancer Network , “Breast cancer Clinical Practice Guidelines in Oncology,” J. Natl. Compr. Canc. Netw. 1(2), 148–188 (2003). 10.6004/jnccn.2003.0016 [DOI] [PubMed] [Google Scholar]
- 7.Cancer Research UK , “Breast cancer survival statistics 2016,” Available from: http://www.cancerresearchuk.org/about-cancer/cancer-symptoms/why-is-early-diagnosis-important.
- 8.Strader D. B., Wright T., Thomas D. L., Seeff L. B., “Diagnosis, management, and treatment of hepatitis C,” Hepatology 39(4), 1147–1171 (2004). 10.1002/hep.20119 [DOI] [PubMed] [Google Scholar]
- 9.Saikia B., Gupta K., Saikia U. N., “The modern histopathologist: in the changing face of time,” Diagn. Pathol. 3(1), 25–29 (2008). 10.1186/1746-1596-3-25 [DOI] [PMC free article] [PubMed] [Google Scholar]
- 10.Golaraei A., Kontenis L., Cisek R., Tokarz D., Done S. J., Wilson B. C., Barzda V., “Changes of collagen ultrastructure in breast cancer tissue determined by second-harmonic generation double Stokes-Mueller polarimetric microscopy,” Biomed. Opt. Express 7(10), 4054–4068 (2016). 10.1364/BOE.7.004054 [DOI] [PMC free article] [PubMed] [Google Scholar]
- 11.Ghosh N., Vitkin I. A., “Tissue polarimetry: concepts, challenges, applications, and outlook,” J. Biomed. Opt. 16(11), 110801 (2011). 10.1117/1.3652896 [DOI] [PubMed] [Google Scholar]
- 12.Kunnen B., Macdonald C., Doronin A., Jacques S., Eccles M., Meglinski I., “Application of circularly polarized light for non-invasive diagnosis of cancerous tissues and turbid tissue-like scattering media,” J. Biophotonics 8(4), 317–323 (2015). 10.1002/jbio.201400104 [DOI] [PubMed] [Google Scholar]
- 13.Qi J., Elson D. S., “A high definition Mueller polarimetric endoscope for tissue characterisation,” Sci. Rep. 6(1), 25953 (2016). 10.1038/srep25953 [DOI] [PMC free article] [PubMed] [Google Scholar]
- 14.He H., Zeng N., Liao R., Yun T., Li W., He Y., Ma H., “Application of sphere-cylinder scattering model to skeletal muscle,” Opt. Express 18(14), 15104–15112 (2010). 10.1364/OE.18.015104 [DOI] [PubMed] [Google Scholar]
- 15.Alali S., Vitkin A., “Polarized light imaging in biomedicine: emerging Mueller matrix methodologies for bulk tissue assessment,” J. Biomed. Opt. 20(6), 061104 (2015). 10.1117/1.JBO.20.6.061104 [DOI] [PubMed] [Google Scholar]
- 16.Sun M., He H., Zeng N., Du E., Guo Y., Liu S., Wu J., He Y., Ma H., “Characterizing the microstructures of biological tissues using Mueller matrix and transformed polarization parameters,” Biomed. Opt. Express 5(12), 4223–4234 (2014). 10.1364/BOE.5.004223 [DOI] [PMC free article] [PubMed] [Google Scholar]
- 17.Gurjar R. S., Backman V., Perelman L. T., Georgakoudi I., Badizadegan K., Itzkan I., Dasari R. R., Feld M. S., “Imaging human epithelial properties with polarized light-scattering spectroscopy,” Nat. Med. 7(11), 1245–1248 (2001). 10.1038/nm1101-1245 [DOI] [PubMed] [Google Scholar]
- 18.Schmitt J. M., Gandjbakhche A. H., Bonner R. F., “Use of polarized light to discriminate short-path photons in a multiply scattering medium,” Appl. Opt. 31(30), 6535–6546 (1992). 10.1364/AO.31.006535 [DOI] [PubMed] [Google Scholar]
- 19.Qiu L., Pleskow D. K., Chuttani R., Vitkin E., Leyden J., Ozden N., Itani S., Guo L., Sacks A., Goldsmith J. D., Modell M. D., Hanlon E. B., Itzkan I., Perelman L. T., “Multispectral scanning during endoscopy guides biopsy of dysplasia in Barrett’s esophagus,” Nat. Med. 16(5), 603–606 (2010). 10.1038/nm.2138 [DOI] [PMC free article] [PubMed] [Google Scholar]
- 20.Backman V., Wallace M. B., Perelman L. T., Arendt J. T., Gurjar R., Müller M. G., Zhang Q., Zonios G., Kline E., McGilligan J. A., Shapshay S., Valdez T., Badizadegan K., Crawford J. M., Fitzmaurice M., Kabani S., Levin H. S., Seiler M., Dasari R. R., Itzkan I., Van Dam J., Feld M. S., “Detection of preinvasive cancer cells,” Nature 406(6791), 35–36 (2000). 10.1038/35017638 [DOI] [PubMed] [Google Scholar]
- 21.Du E., He H., Zeng N., Sun M., Guo Y., Wu J., Liu S., Ma H., “Mueller matrix polarimetry for differentiating characteristic features of cancerous tissues,” J. Biomed. Opt. 19(7), 076013 (2014). 10.1117/1.JBO.19.7.076013 [DOI] [PubMed] [Google Scholar]
- 22.Pierangelo A., Nazac A., Benali A., Validire P., Cohen H., Novikova T., Ibrahim B. H., Manhas S., Fallet C., Antonelli M. R., Martino A. D., “Polarimetric imaging of uterine cervix: a case study,” Opt. Express 21(12), 14120–14130 (2013). 10.1364/OE.21.014120 [DOI] [PubMed] [Google Scholar]
- 23.Pierangelo A., Manhas S., Benali A., Fallet C., Totobenazara J. L., Antonelli M. R., Novikova T., Gayet B., De Martino A., Validire P., “Multispectral Mueller polarimetric imaging detecting residual cancer and cancer regression after neoadjuvant treatment for colorectal carcinomas,” J. Biomed. Opt. 18(4), 046014 (2013). 10.1117/1.JBO.18.4.046014 [DOI] [PubMed] [Google Scholar]
- 24.Wang Y., He H., Chang J., Zeng N., Liu S., Li M., Ma H., “Differentiating characteristic microstructural features of cancerous tissues using Mueller matrix microscope,” Micron 79, 8–15 (2015). 10.1016/j.micron.2015.07.014 [DOI] [PubMed] [Google Scholar]
- 25.Wang Y., He H., Chang J., He C., Liu S., Li M., Zeng N., Wu J., Ma H., “Mueller matrix microscope: a quantitative tool to facilitate detections and fibrosis scorings of liver cirrhosis and cancer tissues,” J. Biomed. Opt. 21(7), 071112 (2016). 10.1117/1.JBO.21.7.071112 [DOI] [PubMed] [Google Scholar]
- 26.Wang W., Lim L. G., Srivastava S., Yan J. S., Shabbir A., Liu Q., “Roles of linear and circular polarization properties and effect of wavelength choice on differentiation between ex vivo normal and cancerous gastric samples,” J. Biomed. Opt. 19(4), 046020 (2014). 10.1117/1.JBO.19.4.046020 [DOI] [PubMed] [Google Scholar]
- 27.Jagtap J., Chandel S., Das N., Soni J., Chatterjee S., Pradhan A., Ghosh N., “Quantitative Mueller matrix fluorescence spectroscopy for precancer detection,” Opt. Lett. 39(2), 243–246 (2014). 10.1364/OL.39.000243 [DOI] [PubMed] [Google Scholar]
- 28.Burke K., Tang P., Brown E., “Second harmonic generation reveals matrix alterations during breast tumor progression,” J. Biomed. Opt. 18(3), 031106 (2012). 10.1117/1.JBO.18.3.031106 [DOI] [PMC free article] [PubMed] [Google Scholar]
- 29.Villiger M., Lorenser D., McLaughlin R. A., Quirk B. C., Kirk R. W., Bouma B. E., Sampson D. D., “Deep tissue volume imaging of birefringence through delineation of breast tumor,” Sci. Rep. 6, 28771 (2016). 10.1038/srep28771 [DOI] [PMC free article] [PubMed] [Google Scholar]
- 30.Azzam R. M. A., “Photopolarimetric measurement of the Mueller matrix by Fourier analysis of a single detected signal,” Opt. Lett. 2(6), 148–150 (1978). 10.1364/OL.2.000148 [DOI] [PubMed] [Google Scholar]
- 31.Goldstein D. H., Chipman R. A., “Error analysis of a Mueller matrix polarimeter,” J. Opt. Soc. Am. A 7(4), 693–700 (1990). 10.1364/JOSAA.7.000693 [DOI] [Google Scholar]
- 32.Lu S. Y., Chipman R. A., “Interpretation of Mueller matrices based on polar decomposition,” J. Opt. Soc. Am. A 13(5), 1106–1113 (1996). 10.1364/JOSAA.13.001106 [DOI] [Google Scholar]
- 33.Shukla P., Pradhan A., “Mueller decomposition images for cervical tissue: potential for discriminating normal and dysplastic states,” Opt. Express 17(3), 1600–1609 (2009). 10.1364/OE.17.001600 [DOI] [PubMed] [Google Scholar]
- 34.Ghosh N., Wood M. F., Vitkin I. A., “Mueller matrix decomposition for extraction of individual polarization parameters from complex turbid media exhibiting multiple scattering, optical activity, and linear birefringence,” J. Biomed. Opt. 13(4), 044036 (2008). 10.1117/1.2960934 [DOI] [PubMed] [Google Scholar]
- 35.He H., Chang J., He C., Ma H., “Transformation of full 4×4 Mueller matrices: a quantitative technique for biomedical diagnosis,” Proc. SPIE 9707, 97070K (2016). [Google Scholar]
- 36.Sun M., He H., Zeng N., Du E., Guo Y., Peng C., He Y., Ma H., “Probing microstructural information of anisotropic scattering media using rotation-independent polarization parameters,” Appl. Opt. 53(14), 2949–2955 (2014). 10.1364/AO.53.002949 [DOI] [PubMed] [Google Scholar]
- 37.Haralick R. M., Shanmugam K., Dinstein I. H., “Textural Features for Image Classification,” IEEE Trans. Syst. Man Cy. 3(6), 610–621 (1973). 10.1109/TSMC.1973.4309314 [DOI] [Google Scholar]
- 38.Haralock R. M., Shapiro L. G., Computer and Robot Vision (Addison-Wesley Longman Publishing Co., Inc., 1991). [Google Scholar]
- 39. https://www.mathworks.com/help/images/ref/graycoprops.html


