Abstract
The rapid advance in swept-source optical coherence tomography (SS-OCT) technology has enabled exciting new applications in elastography, angiography, and vibrometry, where both high temporal resolution and phase stability are highly sought-after. In this paper, we present a 200 kHz SS-OCT system centered at 1321 nm by using an electro-optically tuned swept source. The proposed system’s performance was fully characterized, and it possesses superior phase stability (0.0012% scanning variability and <1 ns timing jitter) that is promising for many phase-sensitive imaging applications. Biological experiments were demonstrated within ex vivo human tracheobronchial ciliated epithelium where both the ciliary motion and ciliary beat frequency were successfully extracted.
OCIS codes: (110.4500) Optical coherence tomography, (170.2655) Functional monitoring and imaging, (170.3880) Medical and biological imaging, (110.6150) Speckle imaging, (120.5050) Phase measurement, (120.7280) Vibration analysis
1. Introduction
Optical coherence tomography (OCT) is an optical imaging modality developed on the basis of low coherence interferometry [1]. Since its birth in the early 1990s, incredible advances have been made in OCT technologies with numerous derivatives created including spectral-domain OCT, SS-OCT, and their functional extensions. The modern SS-OCT system is highly compatible with an all-fiber-based configuration, which makes it easier to be fully integrated into a compact endoscope and used in clinical settings [2]. SS-OCT has demonstrated clinical utility in a variety of medical applications including ophthalmology [3], cardiology [4, 5], pulmonology [6], gastroenterology [7,8], and oncology [9] through various clinical trials.
The structural information provided by OCT is sometimes insufficient for a comprehensive understanding of biological samples, and extra functional contrast capabilities such as phase contrast are often sought. For example, in OCT angiography (OCTA), the phase change between consecutive A-lines could be used to obtain the Doppler frequency shift resulted from the blood flow, and thus the blood flow rate [10, 11]. In optical coherence elastography (OCE), the phase change of the sample induced by external mechanical stimulus is recorded and analyzed to obtain its mechanical properties [12–14]. In polarization-sensitive OCT (PS-OCT), the relative phase difference between the orthogonal polarization channels is utilized to reconstruct the polarization properties of the sample [15–17].
To faithfully reconstruct these functional contrasts, it is important to understand and suppress the noise in the phase measurement. In SS-OCT this task is non-trivial. The composition of the phase noise could be broken down into two pieces: (1) The uncertainty of the starting time of each wavelength scan, which is usually termed as “timing jitter” and (2) the poor repeatability of wavelength-versus-time curve from scan to scan, which we refer as “scanning variability” [18]. Various attempts have been made to address both issues [19–25]. In particular, new types of swept sources that do not involve any mechanical movements have been recently developed and commercialized in the hope to further improve the phase stability of SS-OCT [26, 27]. For example, by applying electrical modulation, the output wavelength of these types of lasers could be tuned by more than a hundred nanometers in the near infrared region [28,29]. Compared with conventional mechanical tuning, electrical modulation is more precise and manifests higher phase stability: A scanning variability of 0.0019% on a common-path configuration [18], and a timing jitter as low as 100 ps have been demonstrated in these types of light sources [30].
In this manuscript, we present a 200 kHz phase-resolved SS-OCT system centered at 1321 nm with high phase stability. The system is developed based on a swept source equipped with a KTa1−x NbxO3 (KTN) electro-optic deflector with a tuning range of >100 nm. We show that the system has an axial resolution of 15.8 μm and a lateral resolution of 7.75 μm with a sensitivity of 104.8 dB and −18.44 dB fall-off at 2 mm. We demonstrate a rigorous phase performance analysis in terms of “scanning variability” and “timing jitter”. The scanning variability and timing jitter were measured as 0.0012% and 714.5 ps at 800 MS/s, respectively. The fidelity of the phase measurement is further applauded by a quantitative analysis on the ciliary motions of human tracheobronchial tissue.
2. Method
2.1. Light source
The wavelength-swept laser source deployed in the proposed SS-OCT system was manufactured by NTT Advanced Technology Corporation (KSS20001310B00, NTT-AT, Japan). The light source employed a Littman-Metcalf external cavity design, which consists of a pair of reflective grating and lens, a silicon optical amplifier (SOA), and a KTN deflector placed between a high reflector and an output coupler [26, 31, 32]. By applying AC voltage on the KTN crystal, we dynamically change the deflected angle of the incident light and thus sweep the output wavelengths.
The light source was operated at an A-line rate of 200 kHz with a duty cycle of 50% and the output spectrum was centered at 1321 nm with a span of 101.6 nm (−10 dB). The coherence length was measured as 9.6 mm (−10 dB) and delivered an average power of 6 mW to the sample arm.
2.2. OCT system configuration
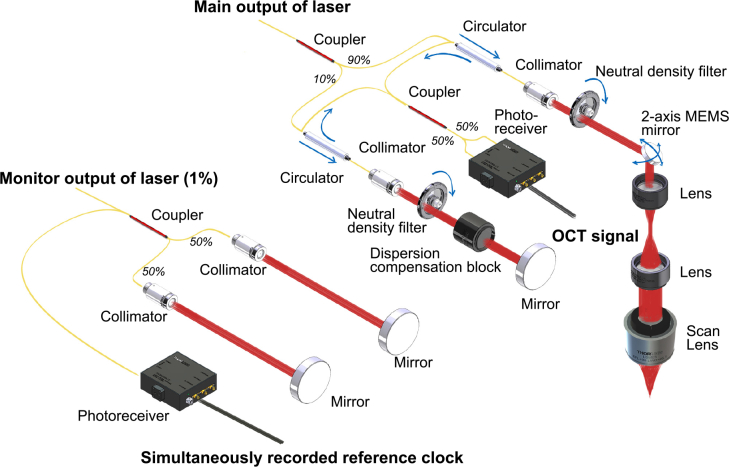
The schematic of the SS-OCT system is illustrated in Fig. 1. Ninety-nine percent of the laser output was directed to the imaging part of the system and further split into one sample arm (90%) and one reference arm (10%). In the sample arm, a 4-quadrant two-axes microelectromechanical systems (MEMS) mirror (A1S1.x, 1.7 mm integrated mirror, Mirroracle Technologies, USA) was paired with a scan lens (LSM03, Thorlabs, USA) to raster scan the laser beam over the sample. One pair of achromatic doublets was used as beam expander to optimize the lateral resolution. In the reference arm, we added a dispersion compensator (LSM03DC, Thorlabs, USA) to balance the dispersion between the two arms. The back scattered light from both arms was collected, directed by two fiber optic circulators (CIR-1310-50-APC, Thorlabs, USA), and recombined in a fiber optic coupler (TW1300R5A2, Thorlabs, USA). The mixed outputs were detected with a high-speed balanced photodetector (PDB480C-AC, Thorlabs, USA).
Fig. 1.
Schematic of the SS-OCT system. The entire system could be divided into two sub-systems: an OCT imaging system, and a simultaneously recorded reference clock.
2.3. Data acquisition and mirror controlling
A 12-bit high-speed DAQ board (ATS9373-A3, AlazarTech, Canada) was used to digitize the voltage signals at a maximum speed of 2 GS/s. The A-line acquisition of the DAQ was triggered by a transistor-transistor logic (TTL) trigger signal. The trigger featured a low timing jitter, since it was synchronized with the voltage driver inside the KTN deflector through a phase-locked loop.
The motion of the MEMS mirror was also synchronized to the same trigger, which was important for better phase stability. For volumetric imaging, an additional TTL signal was generated to further align the B-scans: the TTL signal consisted of a pulse at the beginning of each B-scan that was sent to the DAQ board to serve as a frame trigger. The predefined coordinates for the MEMS mirror were stored in a table in the host computer, and the coordinates were optimized to reduce the scanning artifacts [33].
During the acquisition, the digitized data was streamed to the host computer via a Peripheral Component Interconnect Express (PCI-e) Gen. 3×8 bus. A PCI-e Gen. 3×16 based solid state drive (SSD) is used to ensure the timely transfer of data from host memory to hard drive. The data acquisition program, MEMS mirror control program, real-time processing, and graphic user interface were written in CUDA/C++/Qt for better performance and convenient migration between different operation systems.
2.4. Data processing
For every A-line, the raw data was first resampled against the simultaneously obtained reference clock using the method described by Gora et al [21]. The inverse Fourier transform was taken of the resampled A-line data to obtain the cross-sectional and volumetric datasets.
Various techniques such as speckle variance imaging [34], phase variance imaging [39], temporal frequency analysis [34], and averaged phase difference imaging [11], were used in the study to provide additional functional contrasts. We followed the algorithms detailed in aforementioned literatures and implemented the algorithms in MATLAB R2016a.
2.5. Imaging performance
The axial resolution was measured to be 15.8 μm as the full width half maximum (FWHM) of the A-line profile. The lateral resolution was determined to be 7.75 μm (Group 6-1) in Fig. 2(b). The theoretical axial resolution of 17.15 μm was calculated as . The NA of the objective is 0.08. The theoretical lateral resolution was calculated as 6.10 μm, using δx = 0.37 · λ0/NA. The measured values are well agreed with the theoretical values.
Fig. 2.
Standardized tests for the OCT system. (a) The axial point spread function. (b) An en face image of resolution target. (c) The signal fall off plot of the system.
For the SNR fall-off measurement, a silver mirror was fixed at the focal plane of the sample arm, while the reference mirror was moved by a linear translation stage. The sample beam power was attenuated by 40 dB (OD = 4) to avoid saturation. The SNR of the system was defined as the ratio between the peak intensity to the standard deviation of the noise. As shown in Fig. 2(c), we observed a −18.44 dB fall-off at 2 mm.
Following the definition of SNR in OCT [35], we measured the SNR or sensitivity (as the minimum sample reflectivity that can be detected) to be 104.8 dB, as the sum of the difference of the DFT peak from the noise floor (24.8 dB) and the total attenuation in the sample arm (80 dB, OD = 4) with a silver mirror at the focal plane of the sample arm. In contrast, the theoretical prediction of the sensitivity is 109 dB.
2.6. Phase stability characterization
We analyzed the phase performance of the system by using the method similar to that in [18] but in a cross-correlation configuration to account for the different perturbation between sample arm and reference arm. A mirror was placed at the focal plane of the sample arm, which is 150 μm away from the zero-path-length-difference plane. The sampling rate of the DAQ board was changed from 800 MS/s to 1.4 GS/s, and then tuned the SNR of the OCT signal by using a continuously variable neutral density filter (NDC-25C-4M, Thorlabs, USA). During the tuning, the maximum power collected by the sample arm was restricted to be at least 40 dB lower than that of the reference arm to ensure that we satisfied the shot-noise-limit criterion. For each combination of sampling rate and SNR, 10,000 M-scans were taken to calculate the standard deviation of the extracted instantaneous phase σψ as a measure of phase stability. The phase standard deviation was later fitted to obtain both the timing jitter and the scanning variability of the system.
2.7. Imaging protocol of human trachea sample
The system’s phase sensitivity was demonstrated by ex vivo imaging of human tracheobronchial ciliated epithelium. Following the experimental protocol previously described [34], we retrieved discarded, de-identified human tissues from Columbia University Medical Center. The protocol was reviewed by the Columbia University Institutional Review Board and deemed not human subject research. All samples were imaged within 6 hours of retrieval. During the experiment, a piece of excised trachea (4 mm × 4 mm) was placed in a petri dish and immersed in Medium 199. The sample was warmed by a heating plate and the temperature was kept constant at 37 °C. Two thousand consecutive B-scans were acquired at a fixed location. For each B-scan, 1024 A-lines were acquired. However, only the first 512 A-lines that are taken during the forward scanning of the mirror were used.
3. Results
3.1. System performance evaluation
3.1.1. Phase stability
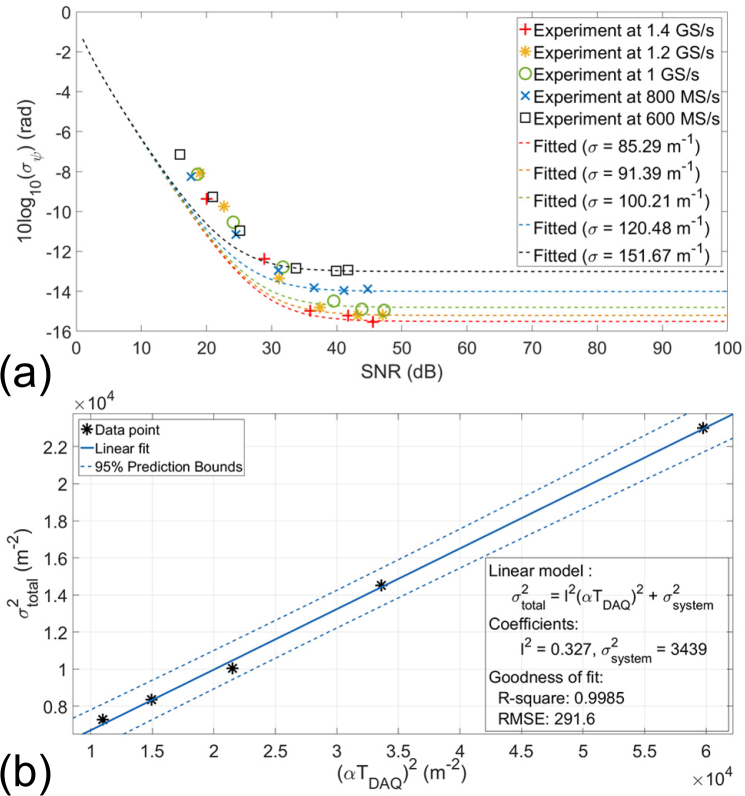
To assess the theoretical phase performance of the system, we have conducted a series of measurements based on the noise theory we recently developed for SS-OCT systems [18]. The two important parameters to assess the phase stability of the system are scanning variability and timing jitter. The measurements were based on cross-correlation instead of autocorrelation/common path configuration. We first measured the phase variance of a static silver mirror at different levels of sample beam power and sampling rates.
It is predicted by the theory that the phase noise in SS-OCT is not completely linear (in logarithmic scale) with SNR and will saturate at a certain level that is collectively determined by the scanning variability and the timing jitter [18]. The scanning variability and the timing jitter affect measurement precision of wavenumber k in a way like multiplicative noise, which could be described by a zero-mean normal distribution with a standard deviation of σtotal. We assume the signal has an amplitude of 1, and an additive white Gaussian noise with an amplitude of b and a uniformly distributed phase angle of ϕ, the probability density function of the measured phase angle ψ at a given sample location of zN is given by,
| (1) |
in which,
| (2) |
where α = Δk/TA-line is the scanning speed of the light source (Δk is the scanning bandwidth and TA-line is the A-line period), is the timing jitter, TDAQ is the sampling interval of the DAQ, l is the unknown coefficient, and σsystem is the system’s scanning variability. Based on the theory, the assumed the system’s timing jitter is linearly proportional to the sampling interval, and the slope is l.
By fitting the data into the Eq. (1) using an inverse Monte Carlo method [36], we obtain the total phase variance at different sampling rates as listed in fourth column of Table 1. The fitted curves are also plotted in Fig. 3(a) as dashed lines. In low-SNR regime (measured SNR < 30 dB in Fig. 3(a)), the noise in the phase measurement is dominated by the shot noise. Therefore, the phase stability is improved linearly with the SNR in logarithmic scale and is not affected by the sampling rate. If the SNR keeps increasing, the system will enter high-SNR regime where the noise in the phase measurement becomes timing jitter-dominated. In high-SNR regime, the phase stability is no longer affected by the SNR.
Table 1.
The fitted σtotal and other parameters for different sampling rates. The sample location zN =150 μm.
| Sampling rate | Sampling interval TDAQ | αT DAQ | Fitted σtotal | SNR | Phase stability σψ |
|---|---|---|---|---|---|
| 600 MS/s | 1.667 ns | 244.44 m−1 | 151.67 m−1 | 41.76 dB | 50.09 mrad |
| 800 MS/s | 1.25 ns | 183.33 m−1 | 120.48 m−1 | 44.75 dB | 40.90 mrad |
| 1.0 GS/s | 1 ns | 146.67 m−1 | 100.21 m−1 | 47.27 dB | 32.00 mrad |
| 1.2 GS/s | 833.33 ps | 122.22 m−1 | 91.39 m−1 | 47.05 dB | 30.30 mrad |
| 1.4 GS/s | 714.29 ps | 104.76 m−1 | 85.29 m−1 | 45.56 dB | 28.00 mrad |
Fig. 3.
The phase performance calibration. The variance of the phase measured at the mirror (zN =150 μm) was examined (a) at different sampling rate, and the data was fitted by using the phase noise model in [18]. (b) The experimental data was fitted again to obtain the system parameter such as the “scanning variability”, and “timing jitter”.
Next, we fit the data to Eq. (2) to assess the system’s scanning variability and the coefficient l of the timing jitter using a linear regression model. The fitted result is illustrated in Fig. 3(b). The fitted σsystem is 58.64 m−1, which represents a relative error of 0.0012% to the central wavenumber of the light source. The fitted l is 0.5716, which makes the timing jitter at 714.5 ps for a sampling rate of 800 MS/s. We also reported the corresponding standard deviation σψ of measured phase angle ψ in radians for easier comparison.
3.2. Ex vivo functional imaging of human tracheobronchial ciliated epithelium
To further highlight the usage of our system in biological experiments, we imaged excised human tracheobronchial ciliated epithelium, and extracted the CBF, which is considered an important parameter in diagnosing diseases such as primary ciliary dyskinesia, and cystic fibrosis. Although it is difficult to observe individual cilia in OCT due to their microscopic size (a typical length of ∼10 μm), it is still possible to indirectly differentiate them by looking at the intensity or phase fluctuations caused by their motions [37–39]. A high phase stability is often required to resolve both the phase and intensity contrasts and lower the noise.
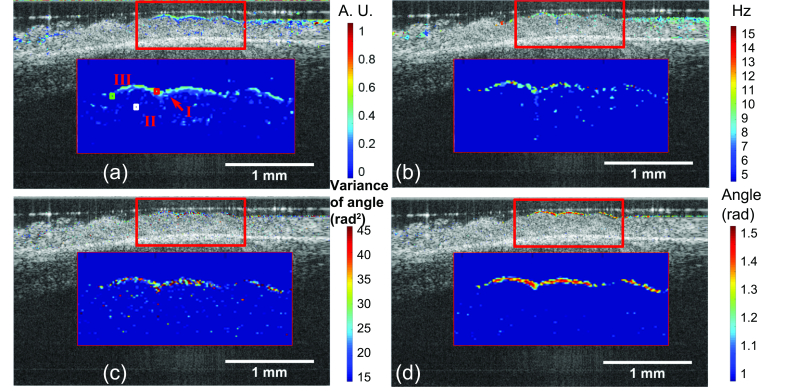
Four different techniques, including speckle variance imaging, temporal frequency analysis, and two different phase variance imaging schemes, were utilized to post-process the data and extract the ciliary motion. For phase variance imaging, two different schemes were applied: the first was calculated variance of the extracted phase angle [39], and the second was the averaged absolute value of difference of phase angle between consecutive (Nth and (N+1)th) frames [11].
An averaged of first 10 OCT B-scans is shown in Fig. 4. Individual cilia could not be differentiated due to the insufficient resolution. However, the ciliary motion can be clearly observed in the movie ( Visualization 1 (7.1MB, MP4) ), and the ciliated epithelium could be segmented from the cilia-denuded area after being processed by speckle variance imaging, temporal frequency analysis, and two different phase variance imaging schemes. The overlaid images are given in Fig. 5 (a), (b), (c), and (d), respectively. Magnified views are provided for closer examination. All the aforementioned methods generated similar cilia coverage map based on segmentation.
Fig. 4.
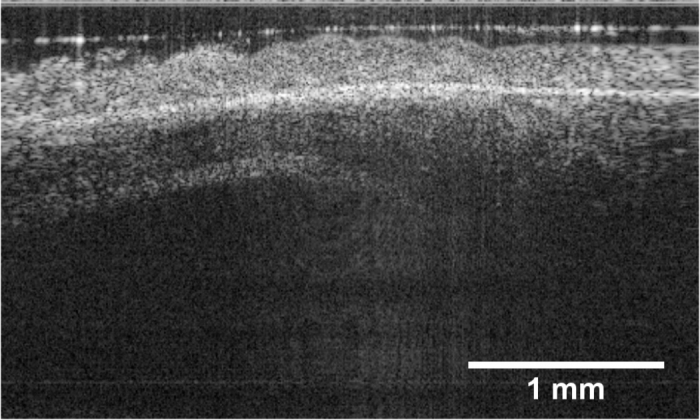
Structural image of human ciliated epithelium (averaged 10 times). The original movie is included in the supplementary materials as Visualization 1 (7.1MB, MP4) .
Fig. 5.
Functional imaging of human ciliated epithelium with various techniques. (a) Speckle variance imaging, (b) temporal frequency analysis, (c) phase variance (over the entire 2000 frames), (d) averaged phase difference overlaid on the structural image. We observed elevated contrast from ciliated epithelium region by using all techniques. For better visualization, the structural images are contrast-enhanced. I, II, and III represent for ciliated, background, and cilia-denuded regions, respectively.
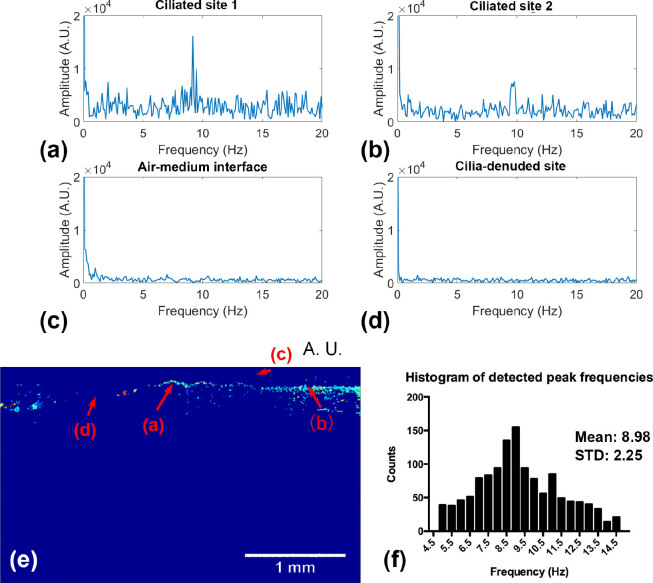
We then obtained the frequency response curves at four representative locations (two ciliated sites, one cilia-denuded site, and one air-medium interface site) by using temporal frequency analysis. The frequency response curves are plotted in Fig. 6(a)–(d). Ciliated site 1 and ciliated site 2 both displayed a pronounced peak around 9 Hz, which is typical for CBF. For the denuded site, we did not see any significant signals above the noise floor. For the high intensity air-medium interface site, we not only observed higher near-DC components (due to the higher intensity in the structural image), but also an enhanced peak around 1 Hz, which might be caused by the low frequency mechanical noise from the medium surface fluctuation. The exact locations of the selected sites are marked in Fig. 6(e). Fig. 6(f) gives the histogram and the statistics of the measured CBFs, where the mean is 8.98 Hz and the standard deviation is 2.25 Hz. The CBF statistics agree with the previously reported results (mean CBF is 8.6 Hz with a standard deviation of 1 Hz) [34].
Fig. 6.
The temporal frequency analysis of the human trachea sample. The temporal frequency response of four different locations including (a) ciliated site 1, (b) ciliated site 2, (c) air-medium interface site, and (d) ciliate denuded site. The temporal frequency responses obtained from the cilia sites show very high peaks around 9 Hz, while that of the cilia denuded region has mostly flat response over the entire spectrum. The temporal frequency response measured at air-medium interface presents elevated low frequency components, due to the higher reflectivity or intensity. (e) The selected regions are illustrated and marked in the structural image. All of them are representative single-pixel values. (f) The histogram of the peak frequencies extracted from ciliated sites.
To further validate our results, we acquired 1350 B-scans at the same cross-section (as in Fig. 4–6) of the tissue by using a custom-built ultrahigh-resolution (UHR) SD-OCT centered at 840 nm [40]. The frame rate was set to 64 Hz. We used the image obtained by the UHR SD-OCT as a reference, since the fidelity of the system has already been proved in our previous study [34]. Speckle variance images obtained from both systems are shown side-by-side in Fig. 7. The ciliated regions are identified due to their elevated intensity. We could observe that the resemblance between the red-boxed region in Fig. 7(a) (from SS-OCT) and the Fig. 7(b) (from UHR SD-OCT) is remarkable: the continuous layer structure is missing in the leftmost region in both images, which suggests that region is cilia-denuded; and the residual bright pixels mostly come from the motion artifacts.
Fig. 7.
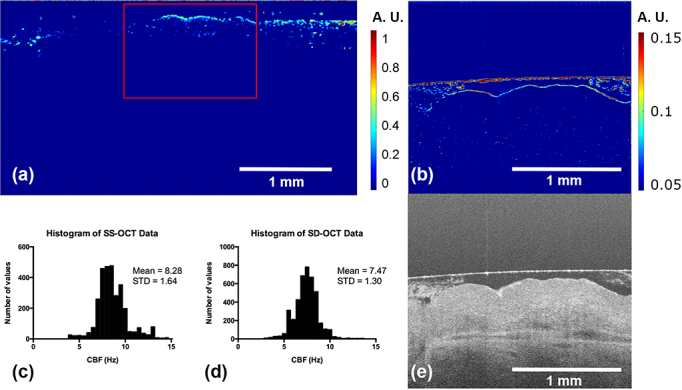
Side-by-side comparison on speckle variance images taken from the SS-OCT system and UHR SD-OCT system. (a) Speckle variance image from SS-OCT, and (b) from UHR SD-OCT. The red-boxed region in (a) indicates approximately the same field-of-view as that in (b). The histogram of CBFs measured by (c) SS-OCT and (d) UHR SD-OCT from the same cross-section. The structural image of the same cross-section taken by UHR SDOCT is given in (e) for reference.
Temporal frequency analysis was conducted on both datasets. We presented the histograms of measured CBFs for SS-OCT and UHR SD-OCT systems in Fig. 7 (c) and (d), respectively. For the same cross-section (red-boxed region in Fig. 7(a) and Fig. 7(b)), the measure mean CBF is 8.28 Hz in SS-OCT and 7.47 Hz in UHR SD-OCT, while the standard deviation is 1.64 Hz in SS-OCT and 1.30 Hz in UHR SD-OCT.
4. Discussion and conclusion
We present a fully-operational functional phase-stable SS-OCT imaging system based on a new type of light source for the first time. The utility of the system is supported by a preliminary biological experiment, measuring ciliary beat frequency on a human trachea sample ex vivo.
4.1. Considerations on the sampling rate
The sampling rate plays an important role in the phase performance of SS-OCT. A sampling rate well above the Nyquist rate would always be preferred, if the best phase stability is sought after. However, it will inevitably impose a harsher requirement on the throughput of data transfer, record, and process. For example, the required data throughput is around 3.2 GB/s, if the proposed system is operated at 800 MS/s. This number could be scaled, if a faster light source or a higher oversampling rate is used.
The oversampling rate could be relaxed, if the SS-OCT system is operated in low-SNR regime (e.g. below ∼30 dB). In low-SNR regimes, the noise in SS-OCT phase measurement is dominated by AWGN and is thus shot-noise limited. For example, if the object has −80 dB reflectivity (measured SNR of ∼24 dB) and a sample location of 150 μm, the phase stability will not be affected when the sampling rate is tuned from 600 MS/s to 1.4 GS/s.
4.2. CBF measurement with low resolution system
One of the highlights of this manuscript is that we conducted an ex vivo human trachea experiment, from which we successfully segmented the ciliated epithelium layer from the rest of the tissue by using four different techniques, including speckle variance imaging, temporal frequency analysis, phase variance imaging, and averaged phase difference, and measured the CBF. The success of aforementioned techniques relies on a phase-stable system. To our best knowledge, this is the first time that human CBF is measured using a SS-OCT system. Moreover, the result was intriguing, given that the axial resolution was previously considered as a key factor in differentiating thin ciliated epithelium layer from the rest of trachea by the community [34,37,41,42].
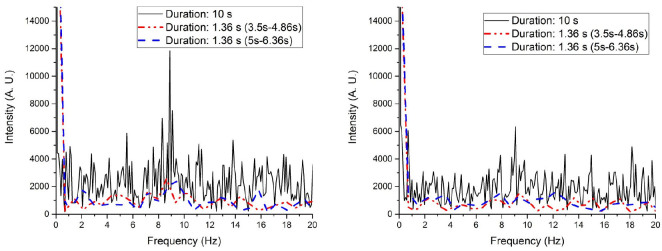
Although pending further investigation, we suggest that the longer acquisition duration and thus the higher sampling resolution in the frequency domain of the proposed system enabled the visualization of the ciliary motion and the extraction of CBF. To verify the hypothesis, we re-evaluate two ciliated sites by using only 272 consecutive frames (duration = 1.36 s). The results were plotted in Fig. 8 along with the results obtained from the full data set. As expected, the frequency response curve obtained from a subset of the entire data shows significantly worse contrast in both locations.
Fig. 8.
The frequency response at two different cilia sites are plotted in (a) and (b) respectively. The black solid curve stands for the frequency response by analyzing the entire 10 s data, while the red dash-dot-dot curve and the blue dash curve represents an excerpt of 1.36 s starting at 3.5 s and 5 s, respectively.
4.3. Comparison of different techniques used in segmenting ciliated epithelium
In Section 3.2, we presented the cilia coverage map calculated by four different functional imaging techniques. We furthered the study here by providing a qualitative comparison. We first manually selected three small regions (5 pixels × 5 pixels) to represent ciliated region (I), cilia-denuded region (II), and background region (III), respectively. The mean pixel value within each region was calculated based on the cilia coverage map obtained by different techniques and the results are listed in Table 2.
Table 2.
The calculated average pixel value for manually segmented cilia (I), cilia-denuded (II), and background (III) region (5pixels × 5 pixels).
| Region | Speckle variance | Temporal frequency | Phase variance | Phase difference |
|---|---|---|---|---|
| I | 1.10 | 2.05 | 26.68 | 1.32 |
| II | 0.88 | 0.60 | 7.76 | 0.81 |
| III | 0.76 | 0.60 | 5.21 | 0.76 |
This makes the system a versatile imaging platform that supports multiple functional extensions, especially for phase sensitive tasks that demand high temporal resolution in the same time. For example, the proposed system could detect higher frequency vibration than normal FD-OCT systems due to its higher A-line rate, while maintain a very low phase noise floor or high sensitivity.
4.4. Limitations of the system
Despite the very good phase stability, the coherence length of the proposed system is shorter compared with other long-range SS-OCT systems [27, 43]. This is fundamentally limited by the external cavity design and the limited number of resolvable spots of the KTN electro-optic deflector [44]. Moreover, the A-line rate of 200 kHz is decent compared with spectral domain OCT, but not fast enough to resolve rapid phase changes such as the transient mechanical waves propagation [45]. In the future, an upgraded version of the akinetic light source with faster wavelength-sweeping rate might be considered to increase the A-line rate [46]
4.5. Conclusion and future work
To summarize, we present a 200-kHz SS-OCT system based on an electro-optically tuned light source. The system has an A-line acquisition rate of 200 kHz and the axial resolution was measured to be ∼16 μm. Thanks to the akinetic nature of the light source as well as the additional reference channel used for wavenumber calibration, the measured scanning variability of the system is 0.0012% and the timing jitter is 714.5 ps at 800 MS/s. The utility of the system is supported by a preliminary biologically relevant experiment, which is the CBF measurement on ex vivo human tracheobronchial ciliated epithelium.
In the future, we will continue the study on ex vivo human tracheobronchial tissues. We will design a cross-platform experiment including different OCT systems with different configurations to figure out the key system parameters involved in CBF measurement. A more quantitative study will be conducted to examine the effectiveness of different functional imaging techniques in segmenting ciliated epithelium. In addition, we plan to apply the proposed system in vibrometry and elastography functional analysis on various ex vivo biological samples such as, cardiac tissues, breast tissues, cervix slices, cochlea, and tracheobronchial samples.
Acknowledgements
The authors would like to thank Dr. Yi Zhang and Dr. Charles Emala for the assistance in human trachea experiment.
Funding
National Institute of Health (NIH) 1DP2HL127776-01 (CPH), National Science Foundation (NSF) CAREER Award 1454365 (CPH).
Disclosures
The authors declare that there are no conflicts of interest related to this article.
References and links
- 1.Huang D., Swanson E. A., Lin C. P., Schuman J. S., Stinson W. G., Chang W., Hee M. R., Flotte T., Gregory K., Puliafito C. A., Fujimoto J. G., “Optical coherence tomography,” Science 254(5035), 1178–1181 (1991). 10.1126/science.1957169 [DOI] [PMC free article] [PubMed] [Google Scholar]
- 2.Yun S. H., Tearney G. J., Vakoc B. J., Shishkov M., Oh W. Y., Desjardins A. E., Suter M. J., Chan R. C., Evans J. A., Jang I.-K., Nishioka N. S., de Boer J. F., Bouma B. E., “Comprehensive volumetric optical microscopy in vivo,” Nat. Med. 12(12), 1429–1433 (2006). 10.1038/nm1450 [DOI] [PMC free article] [PubMed] [Google Scholar]
- 3.de Carlo T. E., Bonini Filho M. A., Chin A. T., Adhi M., Ferrara D., Baumal C. R., Witkin A. J., Reichel E., Duker J. S., Waheed N. K., “Spectral-Domain Optical Coherence Tomography Angiography of Choroidal Neovascularization,” Ophthalmology 122(6), 1228–1238 (2015). 10.1016/j.ophtha.2015.01.029 [DOI] [PubMed] [Google Scholar]
- 4.Yin J., Yang H.-C., Li X., Zhang J., Zhou Q., Hu C., Shung K. K., Chen Z., “Integrated intravascular optical coherence tomography ultrasound imaging system,” J. Biomed. Opt. 15(1), 010512 (2010). 10.1117/1.3308642 [DOI] [PMC free article] [PubMed] [Google Scholar]
- 5.Wang T., Pfeiffer T., Regar E., Wieser W., van Beusekom H., Lancee C. T., Springeling G., Krabbendam I., van der Steen A. F. W., Huber R., van Soest G., “Heartbeat OCT: in vivo intravascular megahertz-optical coherence tomography,” Biomed. Opt. Express 6(12), 5021–5032 (2015). 10.1364/BOE.6.005021 [DOI] [PMC free article] [PubMed] [Google Scholar]
- 6.Hariri L. P., Mino-Kenudson M., Lanuti M., Miller A. J., Mark E. J., Suter M. J., “Diagnosing Lung Carcinomas with Optical Coherence Tomography,” Ann. Am. Thorac. Soc. 12(2), 193–201 (2015). 10.1513/AnnalsATS.201408-370OC [DOI] [PMC free article] [PubMed] [Google Scholar]
- 7.Suter M. J., Vakoc B. J., Yachimski P. S., Shishkov M., Lauwers G. Y., Mino-Kenudson M., Bouma B. E., Nishioka N. S., Tearney G. J., “Comprehensive microscopy of the esophagus in human patients with optical frequency domain imaging,” Gastrointest. Endosc. 68(4), 745–753 (2008). 10.1016/j.gie.2008.05.014 [DOI] [PMC free article] [PubMed] [Google Scholar]
- 8.Adler D. C., Zhou C., Tsai T.-H., Schmitt J., Huang Q., Mashimo H., Fujimoto J. G., “Three-dimensional endomicroscopy of the human colon using optical coherence tomography,” Opt. Express 17(2), 784–796 (2009). 10.1364/OE.17.000784 [DOI] [PMC free article] [PubMed] [Google Scholar]
- 9.Tsai M.-T., Lee H.-C., Lee C.-K., Yu C.-H., Chen H.-M., Chiang C.-P., Chang C.-C., Wang Y.-M., Yang C. C., “Effective indicators for diagnosis of oral cancer using optical coherence tomography,” Opt. Express 16(20), 15847–15862 (2008). 10.1364/OE.16.015847 [DOI] [PubMed] [Google Scholar]
- 10.Zhao Y., Chen Z., Saxer C., Xiang S., de Boer J. F., Nelson J. S., “Phase-resolved optical coherence tomography and optical Doppler tomography for imaging blood flow in human skin with fast scanning speed and high velocity sensitivity,” Opt. Lett. 25(2), 114–116 (2000). 10.1364/OL.25.000114 [DOI] [PubMed] [Google Scholar]
- 11.Chen Z., Liu M., Minneman M., Ginner L., Hoover E., Sattmann H., Bonesi M., Drexler W., Leitgeb R. A., “Phase-stable swept source OCT angiography in human skin using an akinetic source,” Biomed. Opt. Express 7(8), 3032–3048 (2016). 10.1364/BOE.7.003032 [DOI] [PMC free article] [PubMed] [Google Scholar]
- 12.Wang S., Lopez A. L., Morikawa Y., Tao G., Li J., Larina I. V., Martin J. F., Larin K. V., “Noncontact quantitative biomechanical characterization of cardiac muscle using shear wave imaging optical coherence tomography,” Biomed. Opt. Express 5(7), 1980–1992 (2014). 10.1364/BOE.5.001980 [DOI] [PMC free article] [PubMed] [Google Scholar]
- 13.Kennedy K. M., Chin L., McLaughlin R. A., Latham B., Saunders C. M., Sampson D. D., Kennedy B. F., “Quantitative micro-elastography: imaging of tissue elasticity using compression optical coherence elastography,” Sci. Rep. 5, 15538 (2015). 10.1038/srep15538 [DOI] [PMC free article] [PubMed] [Google Scholar]
- 14.Kennedy B. F., Kennedy K. M., Sampson D. D., “A Review of Optical Coherence Elastography: Fundamentals, Techniques and Prospects,” IEEE J. Sel. Top. Quantum Electron. 20(2), 272–288 (2014). 10.1109/JSTQE.2013.2291445 [DOI] [Google Scholar]
- 15.de Boer J. F., Milner T. E., Nelson J. S., “Determination of the depth-resolved Stokes parameters of light backscattered from turbid media by use of polarization-sensitive optical coherence tomography,” Opt. Lett. 24(5), 300–302 (1999). 10.1364/OL.24.000300 [DOI] [PubMed] [Google Scholar]
- 16.Götzinger E., Pircher M., Hitzenberger C. K., “High speed spectral domain polarization sensitive optical coherence tomography of the human retina,” Opt. Express 13(25), 10217–10229 (2005). 10.1364/OPEX.13.010217 [DOI] [PMC free article] [PubMed] [Google Scholar]
- 17.Yamanari M., Makita S., Yasuno Y., “Polarization-sensitive swept-source optical coherence tomography with continuous source polarization modulation,” Opt. Express 16(8), 5892–5906 (2008). 10.1364/OE.16.005892 [DOI] [PubMed] [Google Scholar]
- 18.Ling Y., Gan Y., Yao X., Hendon C. P., “Phase-noise analysis of swept-source optical coherence tomography systems,” Opt. Lett. 42(7), 1333–1336 (2017). 10.1364/OL.42.001333 [DOI] [PMC free article] [PubMed] [Google Scholar]
- 19.Vakoc B. J., Yun S. H., de Boer J. F., Tearney G. J., Bouma B. E., “Phase-resolved optical frequency domain imaging,” Opt. Express 13(14), 5483–5493 (2005). 10.1364/OPEX.13.005483 [DOI] [PMC free article] [PubMed] [Google Scholar]
- 20.Adler D. C., Chen Y., Huber R., Schmitt J., Connolly J., Fujimoto J. G., “Three-dimensional endomicroscopy using optical coherence tomography,” Nat. Photon. 1(12), 709–716 (2007). 10.1038/nphoton.2007.228 [DOI] [Google Scholar]
- 21.Gora M., Karnowski K., Szkulmowski M., Kaluzny B. J., Huber R., Kowalczyk A., Wojtkowski M., “Ultra high-speed swept source OCT imaging of the anterior segment of human eye at 200 kHz with adjustable imaging range,” Opt. Express 17(17), 14880–14894 (2009). 10.1364/OE.17.014880 [DOI] [PubMed] [Google Scholar]
- 22.Potsaid B., Baumann B., Huang D., Barry S., Cable A. E., Schuman J. S., Duker J. S., Fujimoto J. G., “Ultrahigh speed 1050nm swept source / Fourier domain OCT retinal and anterior segment imaging at 100,000 to 400,000 axial scans per second,” Opt. Express 18(19), 20029–20048 (2010). 10.1364/OE.18.020029 [DOI] [PMC free article] [PubMed] [Google Scholar]
- 23.Xi J., Huo L., Li J., Li X., “Generic real-time uniform K-space sampling method for high-speed swept-Source optical coherence tomography,” Opt. Express 18(9), 9511–9517 (2010). 10.1364/OE.18.009511 [DOI] [PMC free article] [PubMed] [Google Scholar]
- 24.Hendargo H. C., McNabb R. P., Dhalla A.-H., Shepherd N., Izatt J. A., “Doppler velocity detection limitations in spectrometer-based versus swept-source optical coherence tomography,” Biomed. Opt. Express 2(8), 2175–2188 (2011). 10.1364/BOE.2.002175 [DOI] [PMC free article] [PubMed] [Google Scholar]
- 25.Choi W., Potsaid B., Jayaraman V., Baumann B., Grulkowski I., Liu J. J., Lu C. D., Cable A. E., Huang D., Duker J. S., Fujimoto J. G., “Phase-sensitive swept-source optical coherence tomography imaging of the human retina with a vertical cavity surface-emitting laser light source,” Opt. Lett. 38(3), 338–340 (2013). 10.1364/OL.38.000338 [DOI] [PMC free article] [PubMed] [Google Scholar]
- 26.Sasaki Y., Fujimoto M., Yagi S., Yamagishi S., Toyoda S., Kobayashi J., “Ultrahigh-phase-stable swept source based on KTN electro-optic deflector towards Doppler OCT and polarization-sensitive OCT,” Proc. SPIE 8934, 89342Y (2014). 10.1117/12.2036078 [DOI] [Google Scholar]
- 27.Bonesi M., Minneman M. P., Ensher J., Zabihian B., Sattmann H., Boschert P., Hoover E., Leitgeb R. A., Crawford M., Drexler W., “Akinetic all-semiconductor programmable swept-source at 1550 nm and 1310 nm with centimeters coherence length,” Opt. Express 22(3), 2632–2655 (2014). 10.1364/OE.22.002632 [DOI] [PubMed] [Google Scholar]
- 28.Song S., Xu J., Wang R. K., “Long-range and wide field of view optical coherence tomography for in vivo 3D imaging of large volume object based on akinetic programmable swept source,” Biomed. Opt. Express 7(11), 4734–4748 (2016). 10.1364/BOE.7.004734 [DOI] [PMC free article] [PubMed] [Google Scholar]
- 29.Sasaki Y., Toyoda S., Sakamoto T., Yamaguchi J., Ueno M., Imai T., Sakamoto T., Fujimoto M., Yamada M., Yamamoto K., Sugai E., Yagi S., “Electro-optic KTN deflector stabilized with 405-nm light irradiation for wavelength-swept light source,” Proc. SPIE 10100, 101000H (2017). 10.1117/12.2251413 [DOI] [Google Scholar]
- 30.Hasegawa S., Shinagawa M., Toyoda S., Ueno M., Sasaki Y., Kobayashi J., “Phase stability analysis of swept light source with KTa1−xNbxO3 electro-optic deflector toward Doppler optical coherence tomography,” in CPMT Symposium Japan (ICSJ) (IEEE, 2014), 7–10. [Google Scholar]
- 31.Nakamura K., Miyazu J., Sasaura M., Fujiura K., “Wide-angle, low-voltage electro-optic beam deflection based on space-charge-controlled mode of electrical conduction in KTa1−xNbxO3,” Appl. Phys. Lett. 89(13), 131115 (2006). 10.1063/1.2357335 [DOI] [Google Scholar]
- 32.Okabe Y., Sasaki Y., Ueno M., Sakamoto T., Toyoda S., Yagi S., Naganuma K., Fujiura K., Sakai Y., Kobayashi J., Omiya K., Ohmi M., Haruna M., “200 kHz swept light source equipped with KTN deflector for optical coherence tomography,” Electron. Lett. 48(4), 201–202 (2012). 10.1049/el.2011.4057 [DOI] [Google Scholar]
- 33.Cogliati A., Canavesi C., Hayes A., Tankam P., Duma V.-F., Santhanam A., Thompson K. P., Rolland J. P., “MEMS-based handheld scanning probe with pre-shaped input signals for distortion-free images in Gabor-domain optical coherence microscopy,” Opt. Express 24(12), 13365–13374 (2016). 10.1364/OE.24.013365 [DOI] [PubMed] [Google Scholar]
- 34.Ling Y., Yao X., Gamm U. A., Arteaga-Solis E., Emala C. W., Choma M. A., Hendon C. P., “Ex vivo visualization of human ciliated epithelium and quantitative analysis of induced flow dynamics by using optical coherence tomography,” Lasers Surg. Med. 49(3), 270–279 (2017). 10.1002/lsm.22653 [DOI] [PMC free article] [PubMed] [Google Scholar]
- 35.Nassif N. A., Cense B., Park B. H., Pierce M. C., Yun S. H., Bouma B. E., Tearney G. J., Chen T. C., de Boer J. F., “In vivo high-resolution video-rate spectral-domain optical coherence tomography of the human retina and optic nerve,” Opt. Express 12(3), 367–376 (2004). 10.1364/OPEX.12.000367 [DOI] [PubMed] [Google Scholar]
- 36.Tarantola A., Inverse Problem Theory and Methods for Model Parameter Estimation, (SIAM, 2005). 10.1137/1.9780898717921 [DOI] [Google Scholar]
- 37.Oldenburg A. L., Chhetri R. K., Hill D. B., Button B., “Monitoring airway mucus flow and ciliary activity with optical coherence tomography,” Biomed. Opt. Express 3(9), 1978–1992 (2012). 10.1364/BOE.3.001978 [DOI] [PMC free article] [PubMed] [Google Scholar]
- 38.Lemieux B. T., Chen J. J., Jing J., Chen Z., Wong B. J. F., “Measurement of ciliary beat frequency using Doppler optical coherence tomography,” Int. Forum Allergy Rhinol. 5(11), 1048–1054 (2015). 10.1002/alr.21582 [DOI] [PMC free article] [PubMed] [Google Scholar]
- 39.Kim D. Y., Fingler J., Werner J. S., Schwartz D. M., Fraser S. E., Zawadzki R. J., “In vivo volumetric imaging of human retinal circulation with phase-variance optical coherence tomography,” Biomed. Opt. Express 2(6), 1504–1513 (2011). 10.1364/BOE.2.001504 [DOI] [PMC free article] [PubMed] [Google Scholar]
- 40.Yao X., Gan Y., Marboe C. C., Hendon C. P., “Myocardial imaging using ultrahigh-resolution spectral domain optical coherence tomography,” J. Biomed. Opt. 21(6), 061006 (2016). 10.1117/1.JBO.21.6.061006 [DOI] [PMC free article] [PubMed] [Google Scholar]
- 41.Liu L., Chu K. K., Houser G. H., Diephuis B. J., Li Y., Wilsterman E. J., Shastry S., Dierksen G., Birket S. E., Mazur M., Byan-Parker S., Grizzle W. E., Sorscher E. J., Rowe S. M., Tearney G. J., “Method for Quantitative Study of Airway Functional Microanatomy Using Micro-Optical Coherence Tomography,” PLoS ONE 8(1), e54473 (2013). 10.1371/journal.pone.0054473 [DOI] [PMC free article] [PubMed] [Google Scholar]
- 42.Barrick J., Doblas A., Gardner M. R., Sears P. R., Ostrowski L. E., Oldenburg A. L., “High-speed and high-sensitivity parallel spectral-domain optical coherence tomography using a supercontinuum light source,” Opt. Lett. 41(24), 5620–5623 (2016). 10.1364/OL.41.005620 [DOI] [PMC free article] [PubMed] [Google Scholar]
- 43.Jayaraman V., John D. D., Burgner C., Robertson M. E., Potsaid B., Jiang J. Y., Tsai T. H., Choi W., Lu C. D., Heim P. J. S., Fujimoto J. G., Cable A. E., “Recent advances in MEMS-VCSELs for high performance structural and functional SS-OCT imaging,” Proc. SPIE 8934, 893402 (2014). 10.1117/12.2041718 [DOI] [Google Scholar]
- 44.Yuzo S., Yuichi O., Masahiro U., Seiji T., Junya K., Shogo Y., Kazunori N., “Resolution Enhancement of KTa1−xNbxO3 Electro-Optic Deflector by Optical Beam Shaping,” Appl. Phys. Express 6(10), 102201 (2013). 10.7567/APEX.6.102201 [DOI] [Google Scholar]
- 45.Song S., Wei W., Hsieh B.-Y., Pelivanov I., Shen T. T., O’Donnell M., Wang R. K., “Strategies to improve phase-stability of ultrafast swept source optical coherence tomography for single shot imaging of transient mechanical waves at 16 kHz frame rate,” Appl. Phys. Lett. 108(19), 191104 (2016). 10.1063/1.4949469 [DOI] [PMC free article] [PubMed] [Google Scholar]
- 46.Sakamoto T., Toyoda S., Ueno M., Kobayashi J., “350 kHz large-angle scanning of laser light using KTa1−xNbxO3 optical deflector,” Electron. Lett. 50(25), 1965–1966 (2014). 10.1049/el.2014.1797 [DOI] [Google Scholar]


