Abstract
High-sensitivity cardiac troponin assay development enables determination of biological variation in healthy populations, more accurate interpretation of clinical results and points towards earlier diagnosis and rule-out of acute myocardial infarction. In this paper, we report on preliminary tests of an immunoassay analyzer employing an optimized LED excitation to measure on a standard troponin I and a novel research high-sensitivity troponin I assay. The limit of detection is improved by factor of 5 for standard troponin I and by factor of 3 for a research high-sensitivity troponin I assay, compared to the flash lamp excitation. The obtained limit of detection was 0.22 ng/L measured on plasma with the research high-sensitivity troponin I assay and 1.9 ng/L measured on tris-saline-azide buffer containing bovine serum albumin with the standard troponin I assay. We discuss the optimization of time-resolved detection of lanthanide fluorescence based on the time constants of the system and analyze the background and noise sources in a heterogeneous fluoroimmunoassay. We determine the limiting factors and their impact on the measurement performance. The suggested model can be generally applied to fluoroimmunoassays employing the dry-cup concept.
OCIS codes: (120.3890) Medical optics instrumentation; (170.4580) Optical diagnostics for medicine; (170.6280) Spectroscopy, fluorescence and luminescence
1. Introduction
Cardiac troponin (cTn) is the preferred biomarker for aid in the diagnosis of acute myocardial infarction (AMI) [1]. The recommended decision limit for the myocardial injury is the 99th percentile of the healthy reference population. However, recent studies suggest that the troponin values in healthy individuals are sex and age dependent [2–5]. Determining the biological variation has not been possible with contemporary cTn assays because the assays cannot reliably measure and quantify the cTn concentrations of a healthy population, most of the assays only detect measurable values in <15% of healthy individuals [6]. Measurement of troponin variations in healthy populations will allow for adjustment of the 99th percentile values, assist to determine accurate decision limits and thus help in the clinical interpretation of the results leading to earlier and improved diagnosis and rule-out of AMI [6–9].
For these reasons there has been a need for development of a high-sensitivity troponin (hsTn) assay [7,10]. There are two criteria for hsTn (can be troponin I or T) assays: first, the coefficient of variation (CV) at the 99th percentile value has to be smaller than or equal to 10%. Secondly, troponin values of at least 50% (ideally >95%) of the healthy population have to be measurable, i.e. above the limit of detection (LoD) [6]. Contemporary cTn assays do not satisfy these criteria [6]. Recently, Abbott [5,6,8,10], Siemens Healthcare Diagnostics [2] and Roche [4,6,9] have been developing assays which potentially meet these hsTn assay criteria. However, these assays are only intended for laboratory use.
Point-of-care (PoC) immunoassay instruments, in contrast to central laboratory, are employed in testing performed near the patient (e.g., in emergency units and intensive care departments), with the focus on a short turnaround time and automated testing [11,12]. PoC test instruments have approached the performance of central laboratories in terms of sensitivity with equal or marginally inferior performance [13,14].
Most fluoroimmunoassay instruments are based on time-resolved fluorescence detection utilizing lanthanide chelates which are commonly employed due to their long fluorescence lifetime and large Stokes shift [15,16]. The widely employed excitation light sources for lanthanide chelates were until recently Xenon flash lamps [17,18]. UV LEDs at 365 nm have been implemented for flow cytometry [19,20] and fluorescence microscopy [21,22] however these do not match the excitation spectra of lanthanides well. 340 nm LEDs have recently been used for immunoassay detection with a performance similar to that of flash lamp based systems [23]. In that work, the improvement could be achieved only by increasing the excitation energy, and with measurements performed manually on a bench-top setup to exclude instrument-inherent noise sources e.g. cup-to-cup variation.
To our knowledge, this is the first report of UV LED optical excitation based point-of-care immunoassay analyzer outperforming state-of-the-art flash lamp based instruments and preliminarily satisfying the hsTn assay criteria when used with a research hsTnI assay. We report and compare the test results on a standard TnI assay to a novel point-of-care research hsTnI assay. We compare the results to the Radiometer AQT90 FLEX TnI assay with a known LoD of 9.5 ng/L, 99th percentile of 23 ng/L, 22 ng/L, 26 ng/L for combined whole blood (WB) and plasma, WB alone, and plasma alone, respectively. The 99th percentile was determined with WB samples from 231 individuals and plasma samples from 298 individuals in a healthy reference population [24]. Using data from the prototype hsTnI assay on the Dimension Vista® 1500 System (Siemens Healthcare Diagnostics) [2] which meets the hsTn criteria and has a ratio of 60 between its 99th percentile value and its LoD, we estimate a required LoD of 0.43 ng/L for plasma in order to fulfill the hsTn criteria. We have obtained a LoD of 1.9 ng/L on tris-saline-azide buffer containing bovine serum albumin (BSA-TSA) for the standard TnI assay and 0.22 ng/L on plasma with the research hsTnI assay, thus improving the LoD by factors of 5 and 3 when compared to the flash lamp, respectively. Reaching this value is an important step towards hsTnI development for PoC immunoassay analysis. Improving the LoD to a level satisfying the hsTn assay criteria will enable detection of cTn in >90% of healthy population leading towards early diagnosis of AMI.
In section 2, we describe the optimized optical setup that utilizes decreased illumination area compared to [23] in order to match the chemically active area of the assays, and list the assays employed. In section 3, we first compare the optimized LED based immunoassay instrument with state-of-the-art flash lamp based instruments for the standard TnI assay analysis. Secondly, we report on the performance of the LED based instrument on a research hsTnI assay and compare to the flash lamp based instrument. We show that combining the optimized LED based excitation system and the research hsTnI assay we achieve a performance preliminarily meeting the hsTn assay criteria. In section 3, we also provide a simple model describing the background and noise contributions based on time decay constants, which can be generally applied to PoC fluoroimmunoassay instruments. We discuss limiting factors in the PoC immunoassay instruments such as cup-to-cup variation and its impact on measurement performance. Moreover, we discuss that increasing the excitation energy the performance improvement cannot be achieved in an automated measurement due to dominating cup-to-cup variation, inevitably appearing in an automated PoC instrument, in contrast to benchtop measurements. Finally, in section 4 we conclude the paper.
2. Methods and materials
2.1 Optical setup
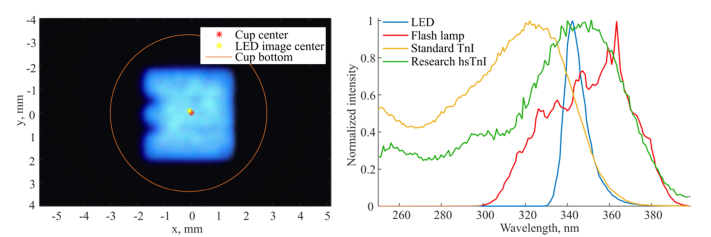
The optical system is a reflection-type fluorimeter which includes two subsystems. In the excitation subsystem, a single chip UV LED (manufactured by Seoul Viosys Co., Ltd) is used as a light source with output power up to 55 mW at 500 mA. An image of the LED is formed at the bottom of a test cup with a magnification of 4. The image is 4x4 mm2 in size and takes up 45% of cup bottom area which is 6.7 mm in diameter, as shown in Fig. 1, left. The design of the excitation optics was modified to obtain smaller magnification at the cost of less collected light compared to [23]. In our previous work, the fluorescence signal was lower by 30% when excited by the LED compared to the flash lamp due to non-optimal overlap of the UV illumination area and chemically active area. Considering the conclusions of our previous work the illumination area was decreased by 36% to increase the detected fluorescence signal. The size of the active fluorescent area was estimated with a scanning fluorimeter to be approximately 4 mm in diameter. With the optimized LED system, the fluorescent signal was increased by a factor of 2, compared to the first LED system (measured on BSA-TSA samples with TnI concentration of 139 ng/L). The detection optical path remains unchanged. The emitted fluorescence is detected by a photomultiplier tube (PMT). The two optical paths are separated by a dichroic beam splitter and two sets of filters. The LED emission spectrum has an intensity peak at 343 nm and a FWHM (defined at half maximum) of 10 nm, which is 4.8 times narrower than the filtered flash lamp spectrum, as shown in Fig. 1, right. The LED based optical units (OU) are compatible with the flash lamp based immunoassay analyzers and can be integrated for automated measurements in a standard PoC environment. The excitation energy of the LED based instruments is equal to that of the flash lamp based instruments. A single measurement consists of 3x861 excitation pulses at a repetition frequency of 250 Hz giving a total measurement time of 10.3 s.
Fig. 1.
Left: an LED image is formed in the bottom of a test cup which is 6.7 mm in diameter. The 4x4 mm2 LED image takes up 45% of the cup area. Right: normalized emission spectra of the LED (blue), filtered flash lamp (red) and normalized excitation spectra of the standard TnI (yellow) and the research high-sensitivity TnI assays (green).
2.2 Assays
The single wells are prepared according to the all-in-one dry cup technology [25] with europium chelate as a fluorescence marker. The long fluorescence lifetime of europium, in the range of hundreds of microseconds up to a millisecond [16], allows for the implementation of long excitation LED pulses. The assays used in the experiments are described below.
➢ Assay 1: standard TnI assay of Radiometer AQT90 FLEX [24,26] used to determine the improvement of LoD obtained by the LED excitation source compared to the standard flash lamp based system. The europium chelate used for the tracer antibody in the standard TnI has an excitation peak at 325 nm.
➢ Assay 2: hsTnI research assay utilizing three biotinylated capture antibodies and one europium-labelled tracer antibody.
➢ Assay 3: hsTnI research assay used in the optimization study is similar to Assay 2 but with two tracer antibodies binding to separate epitopes on the TnI molecule.
The research hsTnI assays 2 and 3 have been developed with the standard TnI assay (Assay 1) as a starting point by modifying the chemical components in order to increase analytical sensitivity. The research hsTnI assays are also based on the all-in-one dry cup technology.
The TnI assay excitation spectrum is shown in Fig. 1, right (yellow). Both hsTnI assays have their excitation peak at 355 nm, as shown in Fig. 1, right (green). The emission peak of all assays is at 615 nm. The hsTnI assays have 73% and 28% better spectral overlap (calculated using the emission spectra normalized to have equal area under the spectral curve) with the LED and filtered flash lamp emission spectra, respectively, compared to the standard TnI. For both standard and high-sensitivity TnI assays the LED excitation proved more optimal compared to the filtered flash lamp.
3. Results and discussion
3.1 Optimized LED excitation based measurement of standard TnI assay
The performance of the LED based instruments was first tested with the standard TnI assay (Assay 1). Five fully automated instruments were used in the experiment. The measurements from the instruments with a flash lamp OU (AQT90 FLEX manufactured by Radiometer Medical) are used as reference baseline for the measurements. Then the flash lamp OUs were replaced with the LED OUs. The samples consist of ternary troponin ITC complex (produced by HyTest) and troponin complex (by BBI Solutions) diluted in BSA-TSA. The sample TnI concentration was 139 ng/L for instrument 1, and 30 ng/L for instruments 2-5. The instruments 1-5 are equivalent.
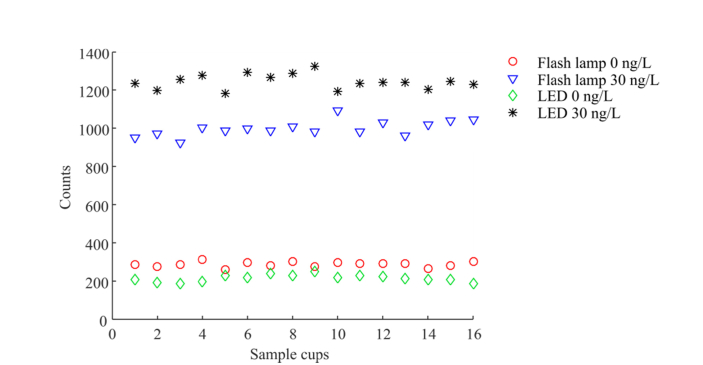
The relative change of signal of the blank cups (processed with assay buffer (AB), i.e. background) decreased with LED excitation for four out of the five instruments, whereas the fluorescence signal of the sample cup increased when excited by the LED, as shown in Table 1. The data for individual test cups measured on instrument 2 is shown in Fig. 2. Compared to our previous work [23], the smaller illumination area provides an increased signal.
Table 1. Relative change of the averaged fluorescence signal of sample cups with a concentration of 30 ng/L and blank cups, after the flash lamp OUs were replaced by the optimized LED based OUs measured with the TnI assay.
| Instrument | 1 | 2 | 3 | 4 | 5 |
|---|---|---|---|---|---|
| Relative change of sample cups averaged signal, % | + 57a | + 25 | + 40 | + 18 | + 17 |
| Relative change of blank cups averaged signal (null concentration), % | −28 | −26 | + 17 | −28 | −47 |
data for 139 ng/L sample
Fig. 2.
Fluorescence signal of 16 replicates measured on Instrument 2 for the flash lamp based analyzer (baseline measurement) and with the optimized LED based unit: for blank cups (processed with AQT90 FLEX assay buffer) and BSA-TSA buffer containing 30 ng/L TnI. The fluorescence signal at the concentration of 30 ng/L has increased by 25% whereas the background (concentration 0 ng/L) dropped by 26%.
To determine the limit of blank (LoB) and the LoD of the instruments with the LED OU, we ran a dilution series with TnI concentrations of 1; 2.5; 5; 15; 30 ng/L in BSA-TSA. The blank cups were processed with AB. The sample volume was 35 µL. For the first instrument we had 16 replicates for 1; 2.5; 5 ng/L and 8 replicates for 15 ng/L and 30 ng/L. For the other four instruments we had 16 replicates at all concentrations. The LoB and LoD were calculated using the parametric approach described in the Clinical and Laboratory Standards Institute (CLSI) guidelines [27]. The LoB is calculated with blank cups processed with null concentration sample as:
| (1) |
and are average value and standard deviation of the measured blank cups, respectively. B is the number of blank cups replicates measured (of all blank samples in total), and K is the number of blank samples used in the experiment (number of subsets of blank cups). The LoD was calculated with the low concentration samples of 1; 2.5; 5 ng/L according to:
| (2) |
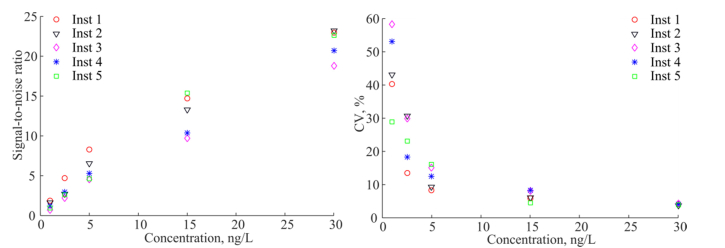
L is the total number of low concentration sample results, i.e. total number of replicates of all concentrations used in the calculation. J is number of the low concentration samples used in the experiment, ni is number of results for i-th low concentration sample, and is standard deviation of the distribution of replicates of i-th low concentration sample. The limits of quantification (LoQ) were calculated by fitting a power fit function to the CV vs. concentration curve shown in Fig. 3, right (fits not shown).
Fig. 3.
SNR (left) and CV (right) of the five LED based instruments measured on TnI assay.
The LoBs are calculated to be in the range from 0.8 ng/L to 1.1 ng/L, and the LoDs are in the range from 1.5 ng/L to 2.1 ng/L for the five LED based instruments as shown in Table 2. We compare the calculated values of the LoB and LoD to the data of the standard TnI assay measured in the current platform AQT90 FLEX [24], where the reported experiment was performed according to the CLSI EP17-A protocol [28]. The reported LoB was 4.3 ng/L, LoD 9.5 ng/L, and the concentration that corresponded to CV of 10% and 20% was 24 ng/L and 18 ng/L for WB, and 24 ng/L and 16 ng/L for plasma, respectively. In our experiment the LoB was improved by a factor of 4.7 corresponding to the decreased background value. The LoD was improved by factor of 5. However, it should be noted that our experiments are preliminary in the sense that it does not contain the full required number of replicates as recommended by [27].
Table 2. LoB, LoD and LoQ of the five LED based instruments measured on BSA-TSA buffer based TnI samples with TnI assay compared to the current state-of-the art flash lamp based instrument.
| BSA-TSA buffer based samplesa | Plasma or WB samples | |||||
|---|---|---|---|---|---|---|
| Instrument | 1 | 2 | 3 | 4 | 5 | Radiometer AQT90 FLEX [24] |
| LoB, ng/L | 0.8 | 0.9 | 1.1 | 0.8 | 1.0 | 4.3 |
| LoD, ng/L | 1.5 | 1.9 | 2.1 | 1.9 | 2.0 | 9.5 (plasma) |
| LoQ (CV 20%), ng/L | 1.9 | 2.5 | 3.3 | 2.7 | 2.4 | 18 (whole blood) 16 (plasma) |
| LoQ (CV 10%), ng/L | 5.8 | 6.9 | 8.4 | 7.3 | 6.8 | 24 (whole blood) 24 (plasma) |
| Averaged background value , counts | 204 | 214 | 281 | 195 | 149 | |
| Background standard deviation, counts | 19 | 18 | 20 | 15 | 14 | |
LOB determined on AB samples
We calculate the signal-to-noise ratios (SNR) as, where is the signal averaged over N sample cups, is the background averaged over N blank cups, and is the standard deviation of the signal. The valueis the number of photons detected and is the useful fluorescence signal, or specific signal. The CVs are calculated for the measured concentration. SNR and CV as a function of the sample concentration are shown in Fig. 3.
3.2 Measurement of the research hsTnI assay with the LED based instrument
In this section we present the results of the LED based instrument using the research hsTnI assay (Assay 2). Details of the novel assay will be published elsewhere. We ran nine BSA-TSA samples, four lithium heparin (LiHep) plasma samples, five ethylenediaminetetraacetic acid (EDTA) plasma samples and two serum samples. The concentration values and number of replicates for each level are shown in Table 3. The sample volume was 80 µL (increased compared to 35 µL used previously), the shaking speed was increased by factor of 2.5 to improve the chemical reaction efficiency. Additionally, a parabolic shaped specular reflector was placed under the test cup instead of a flat diffuse reflector. These changes were proven to make a positive impact on the detected signal (unpublished data). The LoB is calculated according to Eq. (1) based on measurements of both BSA-TSA and AB processed blank cups. The LoD is calculated according to Eq. (2) based on a combination of 1) low sample signals from the three low level BSA-TSA samples, 2) estimated standard deviation from all BSA-TSA samples, 3) the specific signal level (signal/concentration) of the plasma and serum samples.
Table 3. Samples used in the hsTnI assay measurements.
| Sample | BSA-TSA | ||||||||
|---|---|---|---|---|---|---|---|---|---|
| Concentration, ng/L | 0.29 | 0.59 | 0.83 | 1.4 | 2.2 | 4.1 | 8.9 | 17 | 46 |
| Number of replicates | 10 | 10 | 10 | 10 | 5 | 5 | 5 | 5 | 5 |
| Sample | Lithium heparin (LiHep) plasma | ||||||||
| Concentration, ng/L | 0.64 | 1 | 1.8 | 9.3 | |||||
| Number of replicates | 5 | 5 | 5 | 5 | |||||
| Sample | EDTA plasma | ||||||||
| Concentration, ng/L | 0.8 | 1.1 | 0.62 | 8.4 | 0.23 | ||||
| Number of replicates | 5 | 5 | 5 | 5 | 5 | ||||
| Sample | Serum | ||||||||
| Concentration, ng/L | 0.77 | 12.4 | |||||||
| Number of replicates | 5 | 5 | |||||||
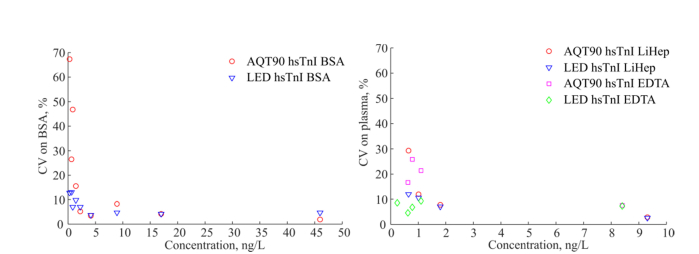
The LoD measured with the LED based instrument on plasma with the hsTnI assay was 0.22 ng/L. The hsTnI assay showed a LoD of 0.67 ng/L measured with the flash lamp based instrument and no hardware changes compared to the AQT90 FLEX instrument. The CV as a function of sample concentration for the BSA-TSA and plasma samples is shown in Fig. 4, measured on the hsTnI assay using both the AQT90 FLEX instrument and the optimized LED based instrument. The CV was improved significantly using the LED based OU. The obtained LoD of the LED based instrument is improved by factor of 3 compared to the LoD of the AQT90 FLEX, see Table 4.
Fig. 4.
CV vs. concentration measured on BSA-TSA samples (left) and plasma samples (right) with the LED based analyzer and the AQT90 FLEX analyzer (flash lamp based instrument) with the research hsTnI assay.
Table 4. LoB and LoD measured with the LED based instrument and the flash lamp based instrument (AQT90 FLEX) on the hsTnI assay.
| Instrument | LED based | AQT90 FLEX (flash lamp based) |
|---|---|---|
| LoB, ng/L | 0.12 | 0.35 |
| LoD on plasma, ng/L | 0.22 | 0.67 |
In order to estimate the required LoD to fulfill the hsTn assay criteria, we use the data of a prototype hsTnI assay measured with the Dimension Vista® 1500 System (Siemens Healthcare Diagnostics), with reported LoD of 0.8 ng/L and the 99th percentile value of 48 ng/L [2]. The ratio between the 99th percentile and the LoD is 60, and measurable values of hsTnI were detected in 88% of the healthy reference cohort. Using the 99th percentile value determined for the standard TnI assay of 26 ng/L for plasma, based on 298 plasma samples (152 female and 146 male) [24], we estimate the required LoD to be 0.43 ng/L. The obtained LoD is about a factor of two lower than this value. Based on the set arguments above we expect that the obtained improvement will allow us to meet the hsTnI criteria for PoC applications. The final proof will involve the determination of the 99th upper reference limit with the LED based instrument and include a large study of the healthy reference population which will be performed later.
3.3 Optimization of the time-resolved fluorescence detection
The background and noise sources in the immunoassay detection system determine the measurement performance, i.e. LoB and LoD. Therefore, it is crucial to understand the main contributors. We discuss the background and noise sources in the following model. The background contributions in the system are the following:
| (3) |
is the background fluorescence from the optical unit (no temporal dependence), is the fluorescence of the empty cup (with a decay time of hundreds of µs), is the contribution originated from non-specific binding of tracer antibodies with fluorescent markers to the inner walls of the cup (with a decay time of the europium chelate of ms) and is a constant contribution from the detector (dark counts of the PMT). The first three sources of the background depend on the excitation light intensity, whereas the detector contribution is independent of the excitation light but is a function of temperature. The absolute values of all contributions for both the LED OU and flash lamp OU were reported in [29]. Correspondingly, the noise of the measurement is defined as:
| (4) |
N represents variance, or squared standard deviation, and is the shot noise of the useful fluorescence signal, is the shot noise of the total background defined in Eq. (3), and , , are cup-to-cup, lot-to-lot and instrument-to-instrument variations, respectively. These three noise contributions are not directly related to the background contributions. The cup-to-cup variation can originate both from the variation of individual empty cups (), from the difference in the chemical compositions of the cups () and from the variation of cups processing in the instrument (e.g. washing). The lot-to-lot variation is caused by both and. The instrument-to-instrument variation includes the variation of the background of the instrument () and the variation of optical component parameters in the OU.
In this optimization study we used the research hsTnI assay (Assay 3) to experimentally determine optimum timing parameters of the time-resolved detection of lanthanide-based chelates. Four LED based instruments were employed in the experiments, where the LED OUs were supplemented with a parabolic shaped specular reflector. No other hardware changes were made (normal sample volume, normal shaking speed). We ran dilution series of ternary troponin complex diluted in BSA-TSA buffer with concentrations of 0; 0.25; 0.5; 1; 5; 30 ng/L. Here the blank samples were processed with BSA-TSA null concentration buffer.
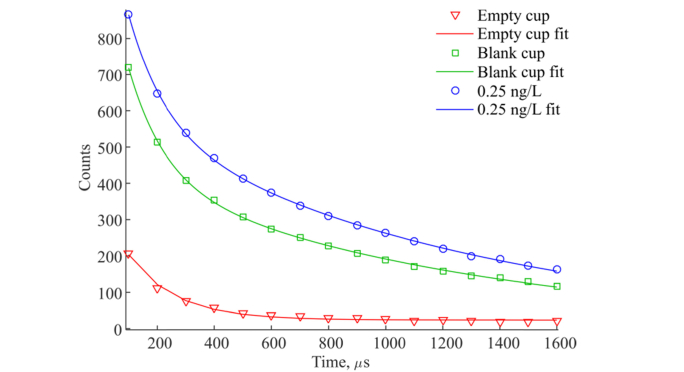
We have analyzed the decay time constants of empty cups (polystyrene only), blank cups (processed with BSA-TSA with null concentration), low concentration sample of 0.25 ng/L and high concentration sample of 30 ng/L. Data is averaged for 16 replicates for the empty cup, 32 replicates of the blank cup and the 0.25 ng/L sample, and for 8 replicates using 30 ng/L. The 16 replicates of empty cup showed variation CV of 10.7% of detected counts. We fitted a single exponential function to all replicates and obtained an average lifetime fluorescence decay of 155.6 µs with a standard deviation of 84.1 µs (CV 54.0%) with added constant background from the optical unit as shown in Fig. 5 (red curve) and Table 5. The constant term is calculated to be 23.4 ± 4.0 counts. The blank cup which includes chemical immunocomplexes before the processing, exhibits double exponential fluorescence decay with the time constants of 124.0 ± 43.6 µs and 1049.6 ± 168.1 µs. We believe that the short fluorescence decay of 124.0 comes from the empty cup and that the long decay is caused by non-specific binding of tracer antibodies (with europium chelate attached) to the inner walls of the cup. However, due to high variation of empty and blank cups the fitting data should be interpreted with caution. The decay curve of the cup processed with a low concentration sample of 0.25 ng/L shows the same double exponential behavior. The cup processed with the high concentration sample of 30 ng/L shows only a single long lifetime exponential decay of 1168.1 ± 8.8 µs because the europium fluorescence decay dominates the signal.
Fig. 5.
Fluorescence decays of empty cup (red), blank cup (green), and cup processed with the sample of 0.25 ng/L with the hsTnI assay (blue).
Table 5. Fluorescence decay lifetime constants of an empty cup and BSA-TSA samples with a TnI concentration of 0 ng/L (blank cup), 0.25 ng/L and 30 ng/L obtained by curve fitting for replicates measured on one instrument.
| Empty cup | Blank cup (BSA-TSA + 0 ng/L TnI) | BSA-TSA + 0.25 ng/L TnI | BSA-TSA + 30 ng/L TnI | |
|---|---|---|---|---|
| Decay constant(s), µs Average (standard deviation) |
155.6 (84.1) | 124.0 (43.6) 1049.6 (168.1) |
128.6 (42.8) 1108.0 (142.7) |
1168.1 (8.8) |
| Replicates | 16 | 32 | 32 | 8 |
Table 6 presents statistical data for the blank cups and the sample cups with a concentration of 0.25 ng/L for four LED based instruments measured on the hsTnI assay. The cup-to-cup variation of blank cups, measured on one instrument, does not exceed 10% for all four instruments. However, instrument-to-instrument variation is 10.7%. For the sample cups with a concentration of 0.25 ng/L, the variation between the instruments is also larger than the cup-to-cup variations. In the following, we average the data for the cup replicates but present the instruments separately, thus only cup-to-cup variations are present.
Table 6. Statistical data measured on four instruments with the hsTnI assay.
| Instrument | Blank cups BSA-TSA + 0 ng/L TnI | BSA-TSA + 0.25 ng/L TnI | ||||
|---|---|---|---|---|---|---|
| Averaged signal, counts | Standard deviation, counts | CV, % | Averaged signal, counts | Standard deviation, counts | CV, % | |
| 6 | 1128 | 56 | 4.9 | 1510 | 56 | 3.7 |
| 7 | 1441 | 82 | 5.7 | 1866 | 67 | 3.6 |
| 8 | 1410 | 57 | 4.0 | 1862 | 67 | 3.5 |
| 9 | 1306 | 82 | 6.2 | 1850 | 125 | 6.7 |
| All instruments | 1320 | 142 | 10.7 | 1773 | 172 | 9.7 |
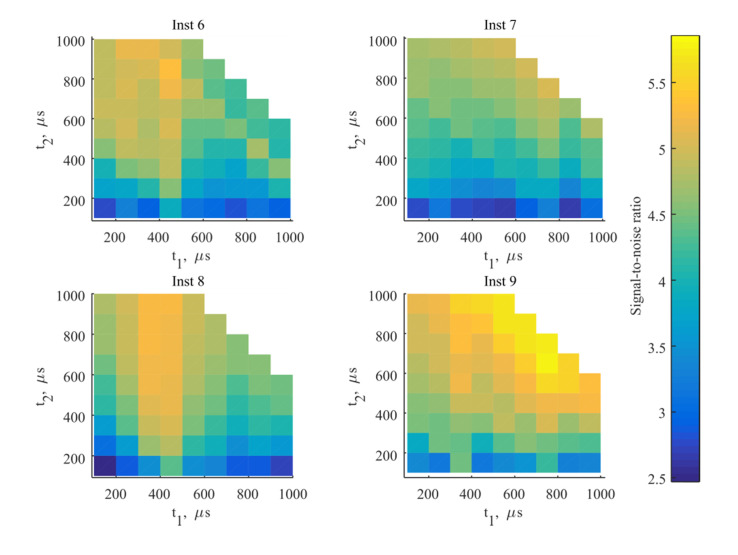
The optimal timing parameters such as pre-delay time, i.e. the time between the end of the excitation pulse and the measurement window, and the duration of measurement time are determined by the fluorescence decay constants of the europium chelate and the background noise in the system. In the following, we analyze the impact of these timing parameters on the SNR as shown in Fig. 6 for a concentration of 0.25 ng/L, where t1 is the pre-delay time and t2 refers to the duration of the measurement. The optimum pre-delay time has to be longer than the decay time of the short fluorescent cup background signal (see Table 5), i.e. 300-400 µs after the excitation pulse. The longer measurement window improves the SNR due to higher signal. At high concentrations such as 30 ng/L the impact of the timing parameters is not evident due to the high europium signal, however, at low concentrations SNR is improved as suggested. The data contains the cup variation as described above. The noise of the measurement and the SNR are dominated by the cup-to-cup variation as explained in the following. With one set of cups as presented here, division of the replicates into two equal sized groups, a calculation of the SNR for the two groups lead to slightly different results, where the behavior of the SNR is not necessarily maintained. This confirms the conclusion that the cup-to-cup variation is larger than the effect of timing parameters on the SNR. Correspondingly, when increasing the excitation energy the improvement is not obtained because the cup-to-cup noise contribution dominates over the shot noise.
Fig. 6.
SNR calculated for four LED based instruments measured on BSA-TSA samples with a TnI concentration of 0.25 ng/L as a function of the timing parameters: t1 as pre-delay time (i.e. time after the end of the excitation pulse before the measurement), and t2 as duration of the measurement time window.
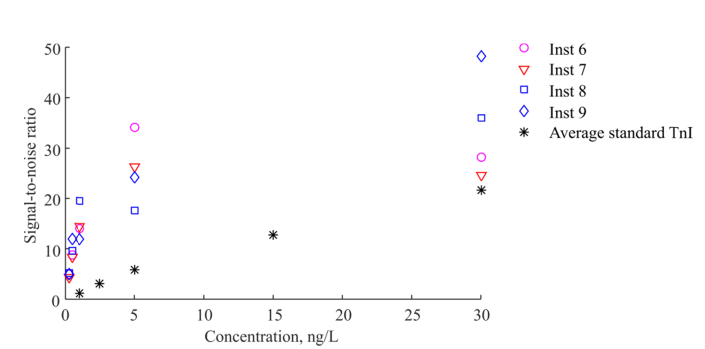
The SNR calculated for the LED based instruments configured with standard timing parameters (pre-delay of 400 µs and measurement window of 400 µs) is shown in Fig. 7. The SNR is improved for the hsTnI assay compared to the TnI assay when measured with the LED based instruments, compared to Fig. 3. The SNR generally improves at lower concentrations. However at a concentration of 30 ng/L the improvement is not seen supposedly due to high cup-to-cup variations.
Fig. 7.
SNR calculated for four LED based instruments with currently employed settings with the pre-delay time of 400 µs and the measurement window duration of 400 µs, measured on BSA-TSA samples with the novel hsTnI assay. Black star points represent average value for the LED based instruments measured on the standard TnI assay.
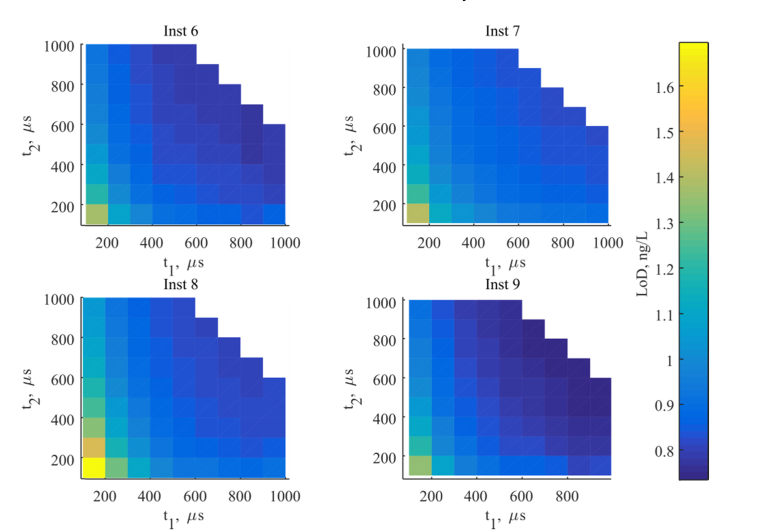
The LoD was calculated according to Eq. (2) from the samples with low concentrations of 0.25; 0.5; 1 ng/L as shown in Fig. 8. The LoD is in the range of 0.8-1.2 ng/L and is optimum for the longer pre-delay time and longer measurement time as discussed above. However, it did not exhibit a strong dependence on the parameters, excluding the case with the shortest both pre-delay time and measurement window. The LoD is higher than that obtained in section 3.2, probably because the experiment was performed on BSA-TSA samples, with slightly different hsTnI assay (two tracer antibodies vs. one tracer antibody) and without the two mentioned platform changes: larger sampling volume and accelerated shaking.
Fig. 8.
LoD calculated for four LED based instruments as a function of the pre-delay time t1 and duration of the measurement time window t2.
4. Conclusion
In this paper, we have tested a novel LED excitation based immunoassay instrument intended for PoC use. The laboratory tests were performed with a standard TnI assay and a research prototype hsTnI assay. The LoD was improved by a factor of 5, from 9.5 ng/L to 1.9 ng/L, for the standard TnI assay when measured with the LED based instrument, significantly outperforming the state-of-the-art flash lamp OU based instrument. The improvement was achieved primarily by optimizing the overlap between the UV illumination area and the chemically active area where the immunocomplexes are located.
In the implementation of the novel research hsTnI assay with the LED based instrument we have obtained a detection limit of 0.22 ng/L measured on plasma, showing an improvement by a factor of 3 compared to the flash lamp based instrument. Using data for an existing hsTnI assay from an external manufacturer, we estimated the required value of LoD to be 0.43 ng/L in order to meet the hsTnI criteria. The combination of the LED excitation and the prototype hsTnI assay enabled the LoD of 0.22 ng/L, which is 49% below the estimated requirement. We believe our preliminary results are an important step in the development of the hsTnI assay in PoC testing and that the hsTnI criteria will soon be documented in PoC systems using LED excitation, ultimately leading to more accurate interpretation of clinical tests and earlier diagnosis and rule-out of AMI.
We suggest a model which includes the background and noise contributions to describe immunoassay detection. The model can be generally applied to lanthanide-based heterogeneous time-resolved fluoroimmunoassays. We showed that the temporal decay of the background in the system includes two exponential terms. The SNR can be improved by choosing the optimal pre-delay time to largely match the short background decay time (about hundreds of µs), whereas the long lifetime decay term originating from the non-specific binding of the tracer antibodies to the cups inner walls cannot be filtered. We also demonstrate that the cup-to-cup variation is a dominating noise contributor that is limiting the instrument performance.
Disclosures
O. Rodenko, C. P. Troldborg, H. Fodgaard, and S. van Os: Radiometer Medical ApS (E), S. Eriksson: Radiometer Turku (E). C. Pedersen and P. Tidemand-Lichtenberg are employed by Technical University of Denmark and declare that they do not have any conflicts of interest related to this article.
Funding
Innovation Fund Denmark (grant 4135-00118B).
References and links
- 1.Thygesen K., Alpert J. S., Jaffe A. S., Simoons M. L., Chaitman B. R., White H. D., Katus H. A., Lindahl B., Morrow D. A., Clemmensen P. M., Johanson P., Hod H., Underwood R., Bax J. J., Bonow R. O., Pinto F., Gibbons R. J., Fox K. A., Atar D., Newby L. K., Galvani M., Hamm C. W., Uretsky B. F., Steg P. G., Wijns W., Bassand J. P., Menasché P., Ravkilde J., Ohman E. M., Antman E. M., Wallentin L. C., Armstrong P. W., Simoons M. L., Januzzi J. L., Nieminen M. S., Gheorghiade M., Filippatos G., Luepker R. V., Fortmann S. P., Rosamond W. D., Levy D., Wood D., Smith S. C., Hu D., Lopez-Sendon J. L., Robertson R. M., Weaver D., Tendera M., Bove A. A., Parkhomenko A. N., Vasilieva E. J., Mendis S., Joint ESC/ACCF/AHA/WHF Task Force for the Universal Definition of Myocardial Infarction , “Third universal definition of myocardial infarction,” Circulation 126(16), 2020–2035 (2012). 10.1161/CIR.0b013e31826e1058 [DOI] [PubMed] [Google Scholar]
- 2.McKie P. M., Heublein D. M., Scott C. G., Gantzer M. L., Mehta R. A., Rodeheffer R. J., Redfield M. M., Burnett J. C., Jr, Jaffe A. S., “Defining high-sensitivity cardiac troponin concentrations in the community,” Clin. Chem. 59(7), 1099–1107 (2013). 10.1373/clinchem.2012.198614 [DOI] [PubMed] [Google Scholar]
- 3.Kimenai D. M., Henry R. M., van der Kallen C. J., Dagnelie P. C., Schram M. T., Stehouwer C. D., van Suijlen J. D., Niens M., Bekers O., Sep S. J., Schaper N. C., van Dieijen-Visser M. P., Meex S. J., “Direct comparison of clinical decision limits for cardiac troponin T and I,” Heart 102(8), 610–616 (2016). 10.1136/heartjnl-2015-308917 [DOI] [PubMed] [Google Scholar]
- 4.Franzini M., Lorenzoni V., Masotti S., Prontera C., Chiappino D., Latta D. D., Daves M., Deluggi I., Zuin M., Ferrigno L., Mele A., Marcucci F., Caserta C. A., Surace P., Messineo A., Turchetti G., Passino C., Emdin M., Clerico A., “The calculation of the cardiac troponin T 99th percentile of the reference population is affected by age, gender, and population selection: A multicenter study in Italy,” Clin. Chim. Acta 438, 376–381 (2015). 10.1016/j.cca.2014.09.010 [DOI] [PubMed] [Google Scholar]
- 5.Zeller T., Ojeda F., Brunner F. J., Peitsmeyer P., Münzel T., Binder H., Pfeiffer N., Michal M., Wild P. S., Blankenberg S., Lackner K. J., “High-sensitivity cardiac troponin I in the general population-defining reference populations for the determination of the 99th percentile in the Gutenberg Health Study,” Clin. Chem. Lab. Med. 53(5), 699–706 (2015). 10.1515/cclm-2014-0619 [DOI] [PubMed] [Google Scholar]
- 6.Apple F. S., Collinson P. O., IFCC Task Force on Clinical Applications of Cardiac Biomarkers , “Analytical characteristics of high-sensitivity cardiac troponin assays,” Clin. Chem. 58(1), 54–61 (2012). 10.1373/clinchem.2011.165795 [DOI] [PubMed] [Google Scholar]
- 7.Twerenbold R., Jaffe A., Reichlin T., Reiter M., Mueller C., “High-sensitive troponin T measurements: what do we gain and what are the challenges?” Eur. Heart J. 33(5), 579–586 (2012). 10.1093/eurheartj/ehr492 [DOI] [PubMed] [Google Scholar]
- 8.Keller T., Zeller T., Ojeda F., Tzikas S., Lillpopp L., Sinning C., Wild P., Genth-Zotz S., Warnholtz A., Giannitsis E., Möckel M., Bickel C., Peetz D., Lackner K., Baldus S., Münzel T., Blankenberg S., “Serial Changes in Highly Sensitive Troponin I Assay and Early Diagnosis of Myocardial Infarction,” JAMA 306(24), 2684–2693 (2011). 10.1001/jama.2011.1896 [DOI] [PubMed] [Google Scholar]
- 9.Wildi K., Gimenez M. R., Twerenbold R., Reichlin T., Jaeger C., Heinzelmann A., Arnold C., Nelles B., Druey S., Haaf P., Hillinger P., Schaerli N., Kreutzinger P., Tanglay Y., Herrmann T., Moreno Weidmann Z., Krivoshei L., Freese M., Stelzig C., Puelacher C., Rentsch K., Osswald S., Mueller C., “Misdiagnosis of myocardial infarction related to limitations of the current regulatory approach to define clinical decision values for cardiac troponin,” Circulation 131(23), 2032–2040 (2015). 10.1161/CIRCULATIONAHA.114.014129 [DOI] [PMC free article] [PubMed] [Google Scholar]
- 10.Zeller T., Tunstall-Pedoe H., Saarela O., Ojeda F., Schnabel R. B., Tuovinen T., Woodward M., Struthers A., Hughes M., Kee F., Salomaa V., Kuulasmaa K., Blankenberg S., MORGAM Investigators , “High population prevalence of cardiac troponin I measured by a high-sensitivity assay and cardiovascular risk estimation: the MORGAM Biomarker Project Scottish Cohort,” Eur. Heart J. 35(5), 271–281 (2014). 10.1093/eurheartj/eht406 [DOI] [PubMed] [Google Scholar]
- 11.St-Louis P., “Status of point-of-care testing: promise, realities, and possibilities,” Clin. Biochem. 33(6), 427–440 (2000). 10.1016/S0009-9120(00)00138-7 [DOI] [PubMed] [Google Scholar]
- 12.von Lode P., “Point-of-care immunotesting: Approaching the analytical performance of central laboratory methods,” Clin. Biochem. 38(7), 591–606 (2005). 10.1016/j.clinbiochem.2005.03.008 [DOI] [PubMed] [Google Scholar]
- 13.Aldous S., Mark Richards A., George P. M., Cullen L., Parsonage W. A., Flaws D., Florkowski C. M., Troughton R. W., O’Sullivan J. W., Reid C. M., Bannister L., Than M., “Comparison of new point-of-care troponin assay with high sensitivity troponin in diagnosing myocardial infarction,” Int. J. Cardiol. 177(1), 182–186 (2014). 10.1016/j.ijcard.2014.09.026 [DOI] [PubMed] [Google Scholar]
- 14.Hjortshøj S., Venge P., Ravkilde J., “Clinical performance of a new point-of-care cardiac troponin I assay compared to three laboratory troponin assays,” Clin. Chim. Acta 412(3-4), 370–375 (2011). 10.1016/j.cca.2010.11.015 [DOI] [PubMed] [Google Scholar]
- 15.Hemmilä I., Laitala V., “Progress in lanthanides as luminescent probes,” J. Fluoresc. 15(4), 529–542 (2005). 10.1007/s10895-005-2826-6 [DOI] [PubMed] [Google Scholar]
- 16.Bünzli J.-C. G., “Lanthanide luminescence for biomedical analyses and imaging,” Chem. Rev. 110(5), 2729–2755 (2010). 10.1021/cr900362e [DOI] [PubMed] [Google Scholar]
- 17.Seveus L., Väisälä M., Syrjänen S., Sandberg M., Kuusisto A., Harju R., Salo J., Hemmilä I., Kojola H., Soini E., “Time-Resolved Fluorescence Imaging of Europium Chelate Label in Immunohistochemistry and In Situ Hybridization,” Cytometry 13(4), 329–338 (1992). 10.1002/cyto.990130402 [DOI] [PubMed] [Google Scholar]
- 18.Connally R., Veal D., Piper J., “Flash lamp-excited time-resolved fluorescence microscope suppresses autofluorescence in water concentrates to deliver an 11-fold increase in signal-to-noise ratio,” J. Biomed. Opt. 9(4), 725–734 (2004). 10.1117/1.1756594 [DOI] [PubMed] [Google Scholar]
- 19.Kettlitz S. W., Moosmann C., Valouch S., Lemmer U., “Sensitivity improvement in fluorescence-based particle detection,” Cytometry A 85(9), 746–755 (2014). 10.1002/cyto.a.22499 [DOI] [PubMed] [Google Scholar]
- 20.Jin D., Connally R., Piper J., “Practical time-gated luminescence flow cytometry. II: Experimental evaluation using UV LED excitation,” Cytometry A 71(10), 797–808 (2007). 10.1002/cyto.a.20449 [DOI] [PubMed] [Google Scholar]
- 21.Connally R., Jin D., Piper J., “High Intensity Solid-State UV Source for Time-Gated Luminescence Microscopy,” Cytometry A 69(9), 1020–1027 (2006). 10.1002/cyto.a.20326 [DOI] [PubMed] [Google Scholar]
- 22.Gahlaut N., Miller L. W., “Time-Resolved Microscopy for Imaging Lanthanide Luminescence in Living Cells,” Cytometry A 77(12), 1113–1125 (2010). 10.1002/cyto.a.20964 [DOI] [PMC free article] [PubMed] [Google Scholar]
- 23.Rodenko O., Fodgaard H., Tidemand-Lichtenberg P., Petersen P. M., Pedersen C., “340 nm pulsed UV LED system for europium-based time-resolved fluorescence detection of immunoassays,” Opt. Express 24(19), 22135–22143 (2016). 10.1364/OE.24.022135 [DOI] [PubMed] [Google Scholar]
- 24.Hedberg P., Wennecke G., “A preliminary evaluation of the AQT90 FLEX TnI immunoassay,” Clin. Chem. Lab. Med. 47(3), 376–378 (2009). 10.1515/CCLM.2009.076 [DOI] [PubMed] [Google Scholar]
- 25.Lövgren T., Meriö L., Mitrunen K., Mäkinen M. L., Mäkelä M., Blomberg K., Palenius T., Pettersson K., “One-step all-in-one dry reagent immunoassays with fluorescent europium chelate label and time-resolved fluorometry,” Clin. Chem. 42(8 Pt 1), 1196–1201 (1996). [PubMed] [Google Scholar]
- 26.Eriksson S., Ilva T., Becker C., Lund J., Porela P., Pulkki K., Voipio-Pulkki L.-M., Pettersson K., “Comparison of Cardiac Troponin I Immunoassays Variably Affected by Circulating Autoantibodies,” Clin. Chem. 51(5), 848–855 (2005). 10.1373/clinchem.2004.040089 [DOI] [PubMed] [Google Scholar]
- 27.CLSI, “Evaluation of Detection Capability for Clinical Laboratory Measurement Procedures; Approved Guideline−Second Edition,” CLSI document EP17–A2, Wayne, PA: Clinical and Laboratory Standards Institute; (2012). [Google Scholar]
- 28.CLSI/NCCLS, “Protocols for Determination of Limits of Detection and Limits of Quantitation; Approved Guideline,” NCCLS document EP17-A, Wayne, PA: Clinical and Laboratory Standards Institute; (2004). [Google Scholar]
- 29.Rodenko O., Fodgaard H., Tidemand-Lichtenberg P., Pedersen C., “340nm UV LED excitation in time-resolved fluorescence system for europium-based immunoassays detection,” Proc. SPIE 10072, 100720M (2017). [DOI] [PubMed] [Google Scholar]


