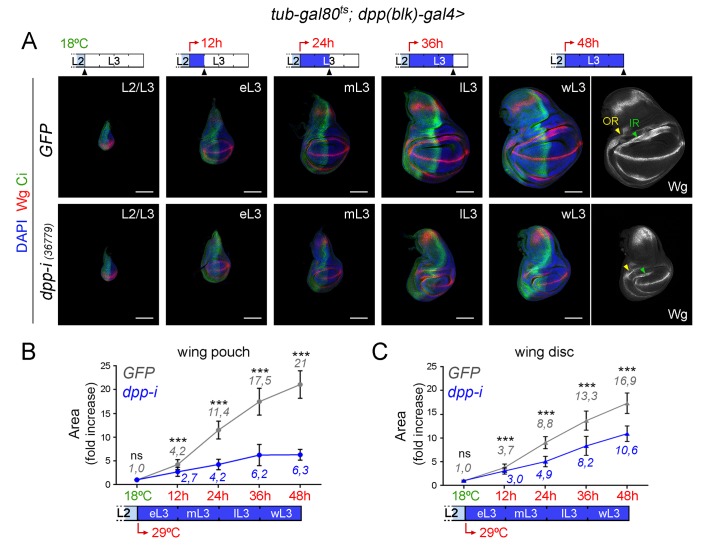
Figure 5. Effects on growth rates in the wing pouch and wing disc upon boundary depletion of Dpp.
(A) Larval wing discs of the indicated genotypes shifted from 18°C to 29°C at the L2/L3 transition (red arrows) and dissected 0, 12, 24, 36 and 48 hr thereafter. Discs stained for Wg (red) and Ci (green), and DAPI (blue). Scale bars, 100 µm. L2, L3, eL3, mL3, lL3, wL3: second, third, early-third, mid-third, late-third and wandering-third larval stages. In the right panel, the outer, OR, and inner, IR, rings of Wg are marked by arrowheads and used to delimit the hinge (between the rings). Note the width of the hinge is affected by Dpp depletion to a lesser extent than the pouch. (B, C) Fold change increase in the size of the wing pouch and wing disc (with respect to the one at the L2/L3 transition) of individuals expressing dpp-RNAi (blue) or GFP (grey) shifted from 18°C to 29°C at the L2/L3 transition (red arrows). The average fold change increases in the area of the wing pouch (B) and wing disc (C) with respect to the values at the beginning of the temperature shift at the L2/L3 transition are indicated. Error bars represent standard deviation. Number of wing discs per developmental point: n (GFP) = 25–45; n (dpp-i) = 30–40. ***p<0.001; ns, not significant.
DOI: http://dx.doi.org/10.7554/eLife.22013.015


