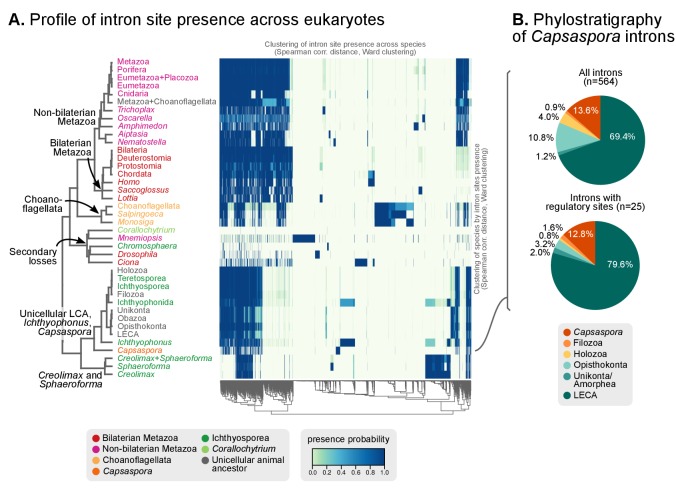
Figure 6. Profile of intron site presence across eukaryotes.
(A) Heatmap representing presence/absence of 4312 intron sites (columns) from extant and ancestral holozoan genomes, plus the line of ascent to the LECA (rows). Intron sites and genomes have been grouped according to their respective patterns of co-occurrence (dendrogram based on Spearman correlation distances and Ward clustering algorithm; see Methods). The dendrogram of genome clusterings is shown to the left. Figure 5—source data 2. (B) Phylostratigraphic analysis of the origin of Capsaspora introns, considering all sites (left) and those with putative regulatory sites (right; after [Sebé-Pedrós et al., 2016b]).

