Abstract
Objectives
The objective of this study was to develop a shade selection program that predicts the shade choice with the smallest CIEDE2000 color difference for dental composite resin restorations when given a backing and target shade. By utilizing previously generated regression models, a database of spectral reflectance information, and principles of Kubelka-Munk layering, a highly accurate shade selection program was designed.
Methods
Using SAS 9.3 Statistical Analysis Software, a shade selection program was developed that incorporated Kubelka-Munk layering data of Herculite Ultra and Estelite Omega composite resins from a characterized database of absorption and scattering information. Test scenarios represented an inquiry based off of a backing selection shade (Shade B) and a target selection shade (Shade T). For the simulation, the thickness of the layer on the backing was 1.9 mm and the CIE illuminant was D65. The selection program was designed to select the shade that would give the lowest CIEDE2000 color difference when selected for the specific target and backing. When using the 3-D Vita shade guide, analysis between direct reflectance data and RGB data regressed to reflectance data was included in order to verify accuracy of the regression.
Results
Test scenarios indicated a systematic and accurate shade selection system by suggesting a shade that resulted in a CIEDE2000 color difference of zero when using the same target and backing shades. Most scenarios of backing and target combinations gave at least one option that was beneath the acceptability threshold indicating a clinically acceptable shade match. Many test scenarios indicated options that were beneath the perceptibility threshold indicating a highly accurate process of shade selection. There was generally little variability in the CIEDE2000 color differences when using the reflectance data versus the RGB regression data as input into the shade selection program further verifying the accuracy of a previously generated regression model.
Conclusions
The shade selection program that was developed is a viable system that could reduce variability in observer selections while increasing patient satisfaction for potential use in clinical situations that require color matching a restoration to a tooth.
Keywords: shade selection program, color matching, digital images, Kubelka-Munk theory, RGB, regression model, color accuracy, CIEDE2000, CIEL*a*b*, spectroradiometry
Introduction
Translation of visual color to selection of a restorative material that best matches the natural dentition is a complicated process that can produce a high amount of inter-observer variability and lack of objectivity (1). Digital imaging as a method to aid in optimum and efficient shade matching in dentistry has become increasingly more relevant in the modern world of dentistry (2, 3). Methodology for standardizing the color data that comes from an image has become progressively more refined and reliable for use in color matching as well (4). Previous studies have confirmed the accuracy of Kubelka-Munk theory of reflectance for making color predictions of resin composite materials (5–7). The effects of interfacial reflection corrections on the overall accuracy of Kubelka-Munk theory of reflectance have also been determined, so that utilization of these correction models on the reflectance may provide the highest level of accuracy (8). Previous computer color matching systems using Kubelka-Munk theory have focused on matching dental porcelains and the mixing of porcelain shades rather than the utilization of fixed shades and layering to obtain a desired result (9–12). In addition, the previous systems involving computer aided color matching relied on a spectrophotometer or colorimeter rather than digital imaging with a regression model as implicated in the study set forth in this article (4, 9–13).
The specific objectives of this investigation were to design and develop a shade selection program using a precise combination of digital imaging with regression modeling (4), a previously characterized database of shade information, and Kubelka-Munk theory of reflectance (5, 6) in order to make the process of shade selection more objective and accurate while decreasing the variability in observer selections (14). Concepts of acceptability and perceptibility thresholds were integrated into the shade selection program in order to enhance the applicability to a clinical setting (15, 16). Validation of the system was accomplished through exploration of the following null hypothesis: The shade selection program selects a shade with a CIEDE2000 = 0 when given a query with the same target and backing shade. In addition, the results of the shade selection program utilizing the direct method and the method via a previously developed regression model were compared (4). The null hypothesis for this objective was as follows: There is no difference in the CIEDE2000 color differences in the shade selection output between the direct method and the method using regression estimates.
Materials and Methods
Information from a previously characterized database of optical information was utilized and expanded by fabrication of Kerr Herculite Ultra (Kerr Corporation, Orange, CA USA) and Estelite Omega (Tokuyama Dental America, Encinitas, CA USA) composite disc shaped samples using circular PVC templates of 20 mm diameter and a thickness of .25 mm and .6 mm in all shades of Herculite Ultra composite materials and in all shades of Estelite Omega composite materials (14). The previously characterized database also contained three different lots of Herculite Ultra shades A1, B2, and D3 which were analyzed to study potential differences in lot numbers of the same shade (14). Specimens were first pressed to flat and parallel surfaces utilizing a compressive force of approximately 800 N and were then light cured for approximately 30 seconds on each side using overlapping irradiation zones (14). They were then sanded with 600 and 1000 grit sandpaper to remove the matrix rich surface layer and to achieve the desired thickness with uniformity across specimens. Final thicknesses were then determined at the central point (14). Measurements of radiant energy were made against white, gray, and black opaque backings, with reflectance measurements of 0.8, 0.4, and 0.0 respectively, to simulate a single layering effect (14). The radiant energy data was converted to spectral reflectance (17). Kubelka-Munk theory was then used to predict theoretical absorption and scattering coefficients for these specimens on different backings using SAS ® Proprietary Software 9.3, (SAS Institute Inc., Cary, NC, USA.) to perform a non-linear least squares regression analysis to determine the best fit as performed previously (14). This absorption and scattering information serves as the database upon which the shade selection program draws (14).
Using SAS ® Proprietary Software 9.3, an all-encompassing model that incorporated the regressions previously generated with the spectral reflectance (4) and K-M layering data (5, 14), a shade selection program was designed. Test scenarios were developed that represented an inquiry based off of a backing selection shade (Shade B) and a target selection shade (Shade T). For the simulation, the thickness of the layer on the backing was 1.9 mm and the CIE illuminant was D65 (18). The selection program was designed to select the shade that would give the lowest CIEDE2000 color difference when selected for the specific target and backing as well as to indicate perceptibility and acceptability of the proposed shade match (16, 18). The null hypothesis was tested by setting up a test scenario where the backing and target shades were the same in order to determine CIEDE2000 of the output shade to the target shade. When using the VITA Linearguide 3D-MASTER® (VITA North America 22705 Savi Ranch Parkway, Suite #100 Yorba Linda, CA 92887), statistical analysis in the format of a paired t-test (α=0.05) between direct reflectance data and RGB data regressed to reflectance data was included in order to further verify accuracy of the regression model used (4).
Results
The CIEL*a*b* values for the selected combinations of target and backing used as test scenarios for the shade selection program are shown in Table 1.
Table 1.
CIE L*a*b* Values for the Selected Target and Backing Shades for the Test Scenarios in the Shade Selection Program
| Target | Backing | ||||||
|---|---|---|---|---|---|---|---|
| Target Shade | Backing Shade | L* | a* | b* | L* | a* | b* |
| A1 | A1 | 76.3 | 1.4 | 16.2 | 76.3 | 1.4 | 16.2 |
| A1 | B2 | 76.3 | 1.4 | 16.2 | 75.4 | −0.8 | 16.9 |
| A1 | D3 | 76.3 | 1.4 | 16.2 | 65.3 | 1.4 | 13.9 |
| B2 | A1 | 75.4 | −0.8 | 16.9 | 76.3 | 1.4 | 16.2 |
| B2 | B2 | 75.4 | −0.8 | 16.9 | 75.4 | −0.8 | 16.9 |
| B2 | D3 | 75.4 | −0.8 | 16.9 | 65.3 | 1.4 | 13.9 |
| D3 | A1 | 65.3 | 1.4 | 13.9 | 76.3 | 1.4 | 16.2 |
| D3 | B2 | 65.3 | 1.4 | 13.9 | 75.4 | −0.8 | 16.9 |
| D3 | D3 | 65.3 | 1.4 | 13.9 | 65.3 | 1.4 | 13.9 |
| 2M1 | 2M1 | 73.5 | 0.0 | 12.2 | 73.5 | 0.0 | 12.2 |
| 1M1 | 1M1 | 77.8 | −0.4 | 11.0 | 77.8 | −0.4 | 11.0 |
| 2L1.5 | 2L1.5 | 73.5 | −0.4 | 16.8 | 73.5 | −0.4 | 16.8 |
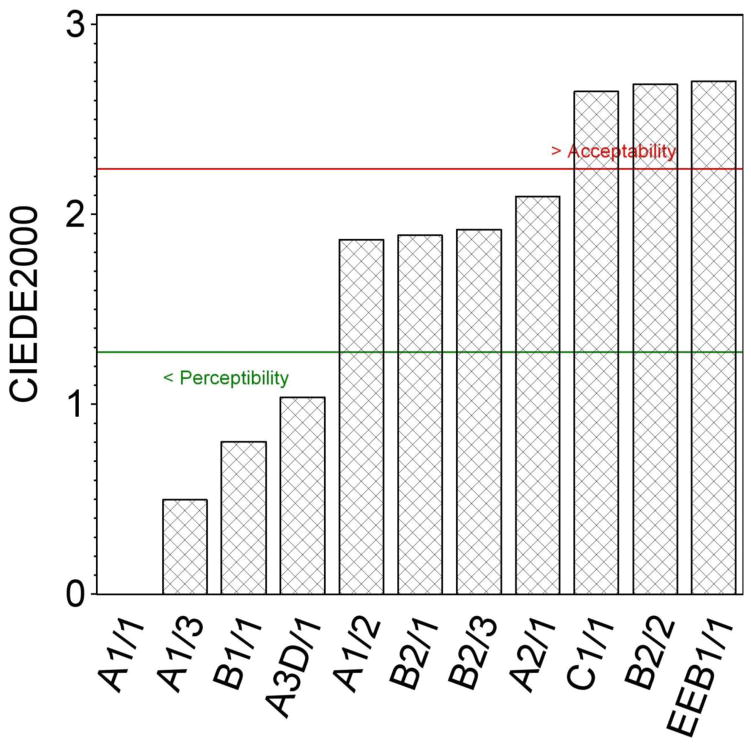
The following figures display the shade selection program results as Shade/Lot Number Versus CIEDE2000 Color Differences for different combinations of backing and target shades with acceptability and perceptibility thresholds. Herculite Ultra shades are reported as the shade/lot number with a “D” following the shade representing dentin shades and Estelite Omega shades are reported as “EE” shade/lot number. A sample of the CIEDE2000 color differences between the selected shades and the target shade with perceptibility and acceptability thresholds using the shade selection program for test scenarios using the same Herculite Ultra backing shade (B) and target shade (T) is displayed in Figure 1. In all three test scenarios utilizing the same target and backing shades, the CIEDE2000 between the output selected shade and the target shade was zero.
Figure 1.
Shade Selection Program Results Using the Direct Method. CIEDE2000 Color Differences from Herculite Ultra Shade A1 Target for Herculite Ultra Shade A1 Backing for Selected Shades/Lot Numbers.
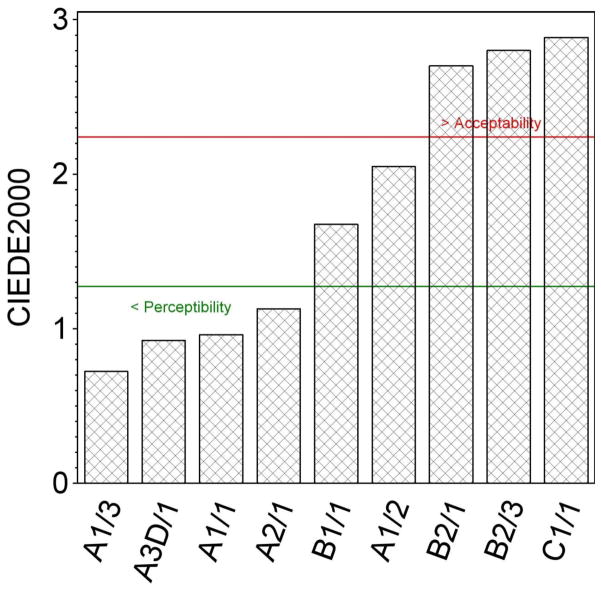
Figure 2 displays a sample of the results of the shade selection program and the CIEDE2000 color differences between the selected shades and the target shade for Herculite Ultra shades when the target and backing are different. Perceptibility and acceptability thresholds are indicated on these figures.
Figure 2.
Shade Selection Program Results Using the Direct Method. CIEDE2000 Color Differences from Herculite Ultra Shade A1 Target for Herculite Ultra Shade B2 Backing for selected Shades/Lot Numbers.
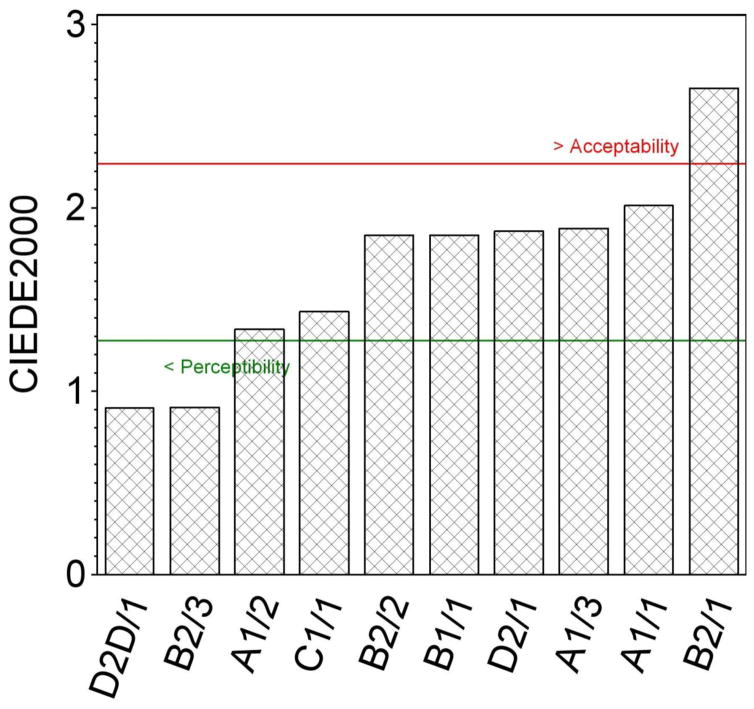
Figure 3 displays a sample of the results of the shade selection program and the CIEDE2000 color differences with perceptibility and acceptability thresholds between these results and the target shade using the reflectance data from the Vita 3-D shade guide tabs when using the same target shade and same backing shade.
Figure 3.
Shade Selection Program Results Using the Direct Method. CIEDE2000 Color Differences from Vita 3-D Shade Guide Tab 2M1 Target for Vita 3-D Shade Guide Tab 2M1 Backing for selected Shades/Lot Numbers.
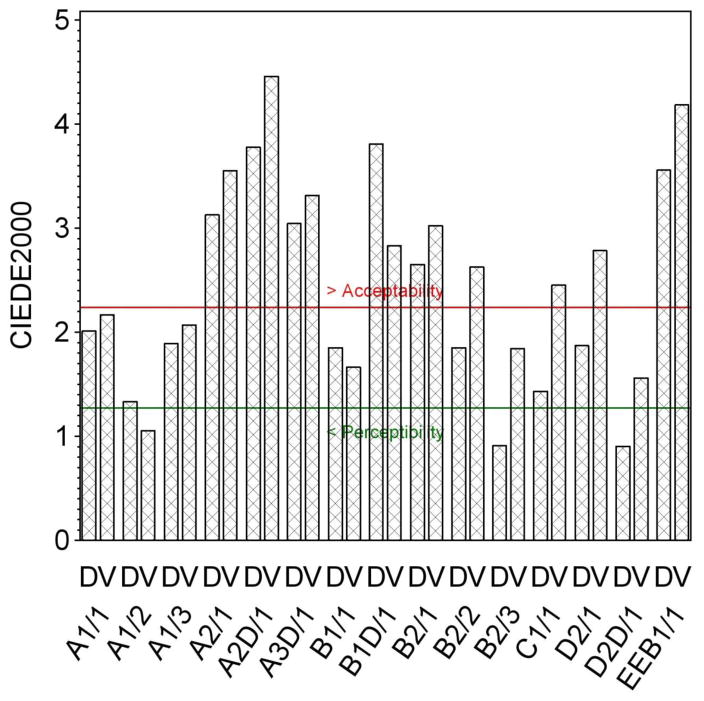
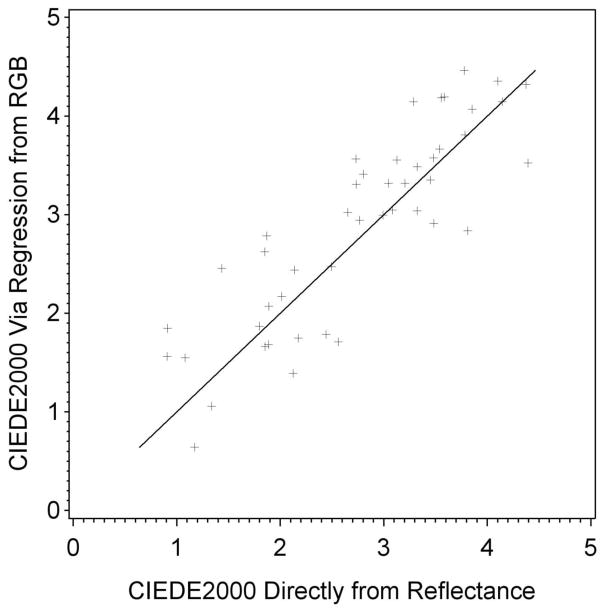
A total of 46 pairs of color differences were obtained where the CIEDE2000 color differences by both of the two methods was less than 4.5, which is double the acceptability level that was used. Of these 46 pairs, a sample of the CIEDE2000 color difference pairs from the shade selection program for the selected shades are shown in Figure 4 when the shade selection program uses direct reflectance data (D) and when it uses RGB data via regression to reflectance data (V) for only one VITA 3-D shade guide tab.
Figure 4.
Shade Selection Program Results: Shade/Lot Number Versus CIEDE2000 Color Differences Using Direct Reflectance Data (D) and RGB Data (V) for Vita 3-D Shade Guide Tab 2M1 Target and Vita 3-D Shade Guide Tab 2M1 Backing.
When all 46 pairs of color differences where the CIEDE2000 color differences by both of the two methods was less than 4.5 were analyzed by the paired t-test, the probability of a greater |t| was <.001. Figure 5 shows all of these 46 pairs for the direct and via regression methods.
Figure 5.
Paired Color Difference Results for the Direct and Via Regression Methods of Reflectance Specification. The solid line indicates perfect agreement between these methods.
Discussion
The test case scenarios using Herculite Ultra with the same backing and target shades accurately select the appropriate shade in all three test cases indicated by a CIEDE2000 color difference of 0. Therefore, the null hypothesis that the shade selection program selects a shade with a CIEDE2000 = 0 when given a query with the same target and backing shade is accepted. This test serves as a control indicating that the system is functional. In the cases where the target and backing are different, the shade selection program choices seem clinically reasonable and in almost all cases studied there was at least one option below the CIEDE2000 color difference acceptability threshold and in many cases beneath the CIEDE2000 perceptibility threshold (16), although in these later cases, the null hypothesis of a zero color difference was rejected.
The VITA Linearguide 3D-MASTER® shade tabs studied corresponded to at least one composite shade that was in the database within the acceptability range and in some cases beneath the perceptibility range. Correlating the VITA Linearguide 3D-MASTER® shade guide color information to composite shades in the database allowed incorporation of the RGB regression modeling into the shade selection program. This was further examined in the figure displaying the CIEDE2000 color differences between the selected shades and the target shades when using the reflectance data from the VITA Linearguide 3D-MASTER® shade guide and when using the RGB regression to reflectance image data from the VITA Linearguide 3D-MASTER® shade guide for the same target and backing shades. The null hypothesis that there is no difference in the CIEDE2000 color differences in the shade selection output between the direct method and the method using regression estimates was accepted, which further verifies the regression model previously studied (4). This is indicative of an acceptable regression from RGB image data to spectral reflectance data, therefore providing a means to transform photographic clinical image data to spectral reflectance input data as required by the shade selection program (4). This allows translation to clinically relevant shade selection programming.
Because the best color match should involve color matching by layering alone, color adjustment potential can be thought of as an optical compensation for an error in layering (19). Because of this flexibility, a color match through layering has a certain range of color adjustment potential that will allow for a less than perfect color match by layering alone. The output of the shade selection program indicates the color difference that would result from all selections and suggests the selection with the lowest color difference. Although this shade selection program was developed using dental composite resins, the same system design can be used for color matching any translucent dental material to the natural dentition. This system could be easily modified to include suggestions for layering and functions optimally with a very inclusive database of absorption and scattering information.
Conclusion
A database of optical characterization information for all shades of Herculite Ultra and Estelite Omega composite materials was created for subsequent use and analyses. For each shade this database included absorption (K) and scattering (S) coefficients and reflectivity spectra at visible wavelengths. The measurement system was found to be accurate and precise as indicated by the significant agreement between reflectance spectra and the reflectance spectra predictions through K-M Theory. This also indicated a well-designed system for determinations of absorption and scattering.
A shade selection program was designed and developed that depends on K-M layering to create the entire color match. Within this program, ranks of shades are given in order based on the least CIEDE2000 color difference between the resulting shade and the target shade (18). Concepts of color adjustment potential or blending contribute then in a positive way to creating a better color match and could adjust for error in color selection by layering alone (19–22). Test scenarios indicated a systematic and accurate shade selection system when using the same target and backing shades. Most scenarios of backing and target combinations gave at least one option that was beneath the acceptability threshold indicating a clinically acceptable shade match. Many test scenarios indicated options that were beneath the perceptibility threshold indicating a very accurate process of shade selection. The clinically relevant RGB image data displays a translation to reflectance data that generally has little variability, confirming the previously generated regression model (4). This concept is imperative to this process in order to make it translational to a clinically applicable system. While created using composite resin materials, this shade selection program was designed in a way that is applicable to shade matching any translucent dental material in the process of restoring dentition and is limited only by which materials are present in the database upon which it draws.
Acknowledgments
This research was supported by the National Institutes of Health (NIH) T32DE014320 training grant, entitled Comprehensive Training in Oral and Craniofacial Sciences (CTOC), supported by the National Institute for Dental and Craniofacial Research (NIDCR) and the Ohio State University College of Dentistry.
Footnotes
Publisher's Disclaimer: This is a PDF file of an unedited manuscript that has been accepted for publication. As a service to our customers we are providing this early version of the manuscript. The manuscript will undergo copyediting, typesetting, and review of the resulting proof before it is published in its final citable form. Please note that during the production process errors may be discovered which could affect the content, and all legal disclaimers that apply to the journal pertain.
Works Cited
- 1.Jivanescu A, Marcauteanu C, Pop D, Goguta L, Bratu D. Conventional Versus Spectrophotometric Shade Taking for the Upper Central Incisor: A Clinical Comparative Study [Google Scholar]
- 2.Wee AG, Lindsey DT, Kuo S, Johnston WM. Color accuracy of commercial digital cameras for use in dentistry. Dent Mater. 2006;22(6):553–9. doi: 10.1016/j.dental.2005.05.011. [DOI] [PMC free article] [PubMed] [Google Scholar]
- 3.Hong G, Luo MR, Rhodes PA. A study of digital camera colorimetric characterization based on polynomial modeling. Color Research & Application. 2001;26(1):76–84. [Google Scholar]
- 4.Carney MN, Johnston WM. A novel regression model from RGB image data to spectroradiometric correlates optimized for tooth colored shades. J Dent. 2016;51:45–8. doi: 10.1016/j.jdent.2016.05.011. [DOI] [PMC free article] [PubMed] [Google Scholar]
- 5.Mikhail SS, Johnston WM. Confirmation of theoretical colour predictions for layering dental composite materials. Journal of dentistry. 2014;42(4):419–24. doi: 10.1016/j.jdent.2014.01.008. [DOI] [PubMed] [Google Scholar]
- 6.Kubelka P. New Contributions to the Optics of Intensely Light-Scattering Materials. Part I. J Opt Soc Am. 1948;38(5):448–48. doi: 10.1364/josa.38.000448. [DOI] [PubMed] [Google Scholar]
- 7.Kubelka P, Munk F. Ein beitrag zur optik der farbanstriche. Zeitschrift fr Technische Physik. 1931;12:593–601. [Google Scholar]
- 8.Mikhail SS, Azer SS, Johnston WM. Accuracy of Kubelka–Munk reflectance theory for dental resin composite material. Dental Materials. doi: 10.1016/j.dental.2012.03.006. [DOI] [PubMed] [Google Scholar]
- 9.Ishikawa-Nagai S, Wang J, Seliger A, Lin J, Da Silva J. Developing a custom dental porcelain shade system for computer. Journal of dentistry. 2013;41:e3–e10. doi: 10.1016/j.jdent.2012.12.006. [DOI] [PubMed] [Google Scholar]
- 10.Ishikawa-Nagai S, Sawafuji F, Tsuchitoi H, Sato RR, Ishibashi K. Using a computer color-matching system in color reproduction of porcelain restorations. Part 2: Color reproduction of stratiform-layered porcelain samples. Int J Prosthodont. 1993;6(6):522–7. [PubMed] [Google Scholar]
- 11.Ishikawa-Nagai S, Sato RR, Shiraishi A, Ishibashi K. Using a computer color-matching system in color reproduction of porcelain restorations. Part 3: A newly developed spectrophotometer designed for clinical application. Int J Prosthodont. 1994;7(1):50–5. [PubMed] [Google Scholar]
- 12.Ishikawa-Nagai S, Sato R, Furukawa K, Ishibashi K. Using a computer color-matching system in color reproduction of porcelain restorations. Part 1: Application of CCM to the opaque layer. Int J Prosthodont. 1992;5(6):495–502. [PubMed] [Google Scholar]
- 13.Davis BK, Johnston WM, Saba RF. Kubelka-Munk reflectance theory applied to porcelain veneer systems using a colorimeter. Int J Prosthodont. 1994;7(3):227–33. [PubMed] [Google Scholar]
- 14.Carney MN, Johnston WM. Appearance Differences Between Lots and Brands of Similar Shade Designations of Dental Composite Resins. Journal of Esthetic and Restorative Dentistry. 2016 doi: 10.1111/jerd.12263. n/a-n/a. [DOI] [PMC free article] [PubMed] [Google Scholar]
- 15.Lindsey DT, Wee AG. Perceptibility and acceptability of CIELAB color differences in computer-simulated teeth. J Dent. 2007;35(7):593–9. doi: 10.1016/j.jdent.2007.03.006. [DOI] [PMC free article] [PubMed] [Google Scholar]
- 16.Paravina RD, Ghinea R, Herrera LJ, Bona AD, Igiel C, Linninger M, et al. Color difference thresholds in dentistry. J Esthet Restor Dent. 2015;27(Suppl 1):S1–9. doi: 10.1111/jerd.12149. [DOI] [PubMed] [Google Scholar]
- 17.Kürklü D, Azer SS, Yilmaz B, Johnston WM. Porcelain thickness and cement shade effects on the colour and translucency of porcelain veneering materials. Journal of dentistry. 2013;41(11):1043–50. doi: 10.1016/j.jdent.2013.08.017. [DOI] [PubMed] [Google Scholar]
- 18.CIE Technical Report: Colorimetry CIE Publication No. 15.3. Vienna, Austria: Commission Internationale de l’Eclairage (CIE or International Commission on Illumination); 2004. [Google Scholar]
- 19.Paravina RD, Westland S, Johnston WM, Powers JM. Color adjustment potential of resin composites. J Dent Res. 2008;87(5):499–503. doi: 10.1177/154405910808700515. [DOI] [PubMed] [Google Scholar]
- 20.Paravina RD, Westland S, Imai FH, Kimura M, Powers JM. Evaluation of blending effect of composites related to restoration size. Dental materials: official publication of the Academy of Dental Materials. 2006;22(4):299–307. doi: 10.1016/j.dental.2005.04.022. [DOI] [PubMed] [Google Scholar]
- 21.Paravina RD, Westland S, Kimura M, Powers JM, Imai FH. Color interaction of dental materials: Blending effect of layered composites. Dental materials: official publication of the Academy of Dental Materials. 2006;22(10):903–08. doi: 10.1016/j.dental.2005.11.018. [DOI] [PubMed] [Google Scholar]
- 22.Tanaka A, Nakajima M, Seki N, Foxton RM, Tagami J. The effect of tooth age on colour adjustment potential of resin composite restorations. J Dent. 2015;43(2):253–60. doi: 10.1016/j.jdent.2014.09.007. [DOI] [PubMed] [Google Scholar]


