

ABSTRACT
Antibiotics are important for treating bacterial infection; however, efficacies and side effects of antibiotics vary in medicine and experimental models. A few studies have correlated microbiota composition variations with health outcomes in response to antibiotics; however, no study has demonstrated causality. We had noted variation in colonic expression of C-type lectins, regenerating islet-derived protein 3β (Reg3β) and Reg3γ, after metronidazole treatment in a mouse model. To investigate the effects of specific variations in the preexisting microbiome on host response to antibiotics, mice harboring a normal microbiota were allocated to 4 treatments in a 2-by-2 factorial arrangement with or without commensal Escherichia coli and with or without metronidazole in drinking water. E. coli colonized readily without causing a notable shift in the microbiota or host response. Metronidazole administration reduced microbiota biodiversity, indicated by decreased Chao1 and Shannon index values, and altered microbiota composition. However, the presence of E. coli strongly affected metronidazole-induced microbiota shifts. Remarkably, this single commensal bacterium in the context of a complex population led to variations in host responses to metronidazole treatment, including increased expression of antimicrobial peptides Reg3β and Reg3γ and intestinal inflammation indicated by tumor necrosis factor alpha levels. Similar results were obtained from 2-week antibiotic exposure and with additional E. coli isolates. The results of this proof-of-concept study indicate that even minor variations in initial commensal microbiota can drive shifts in microbial composition and host response after antibiotic administration. As well as providing an explanation for variability in animal models using antibiotics, the findings encourage the development of personalized medication in antibiotic therapies.
IMPORTANCE This work provides an understanding of variability in studies where antibiotics are used to alter the gut microbiota to generate a host response. Furthermore, although providing evidence only for the one antibiotic, the study demonstrated that initial gut microbial composition is a key factor driving host response to antibiotic administration, creating a compelling argument for considering personalized medication based on individual variations in gut microbiota.
KEYWORDS: Escherichia coli, gut microbiota, metronidazole, regenerating islet-derived protein 3β (Reg3β), regenerating islet-derived protein 3γ (Reg3γ)
INTRODUCTION
Antibiotics have been extensively used in therapy of human and animal infections. The rational mechanisms of antibiotic therapies include decreasing bacterial density, eliminating targeted detrimental bacteria, inhibiting secondary bacterial proliferation, and reducing bacterial translocation; however, such effects occur at the expense of a strong alteration in the commensal microbiota (1). It is well known that antibiotics have strong effects on the gut microbiota, resulting in imbalances of the microbial ecosystem and concomitantly affecting host physiology, particularly those aspects involving innate defense mechanisms (2–4). Antibiotic treatment that might help one individual can cause adverse outcomes in another (5). For instance, in inflammatory bowel disease (IBD) trials, the antibiotic therapies using metronidazole and ciprofloxacin resulted in contradictory outcomes (6–8). Moreover, the compositional changes of gut commensal microbiota in response to antibiotic therapies differ between individuals. A large cohort study showed variation in the diversity and richness of antibiotic resistance genes in the human gut microbiota, which indicated the differences in altered microbiota caused by antibiotic usage (9). Administration of 500 mg ciprofloxacin twice a day for 5 days affected about 30% of bacterial taxa in the gut with, however, interindividual differences in the magnitude of the effects (10, 11). The mechanisms by which antibiotic administration leads to inconsistent host outcome are not entirely clear.
Several studies have illustrated the importance of monitoring the initial composition of gut microbiota prior to antibiotic administration. A recent human study, which recruited 18 healthy volunteers to take a therapeutic dosage of the antibiotic cefprozil for a week, showed that a subset of participants had a dramatic increase in the levels of a specific group of bacteria in response to antibiotic treatment. The subset consisted of participants who were initially categorized as harboring a Bacteroides enterotype with lower microbial diversity (12). While the researchers pointed out the necessity of monitoring initial microbial composition, the study did not provide direct evidence of variations in host response resulting from the initial differences in microbiota. Understanding of the host response underlying functional changes in the microbiota responding to antibiotic treatments remains limited, primarily because most studies to date have focused on compositional changes in microbiota and have failed to provide information on corresponding changes in host response.
Our previous independent studies showed contradictory results for host gene expression of MUC2, regenerating islet-derived protein 3β (Reg3β), and regenerating islet-derived protein 3γ (Reg3γ) in the mouse colon in response to metronidazole administration (reference 13 and unpublished data). Metronidazole is a broad-spectrum antibiotic which is highly active against Gram-negative anaerobic microbes (14). It was first used by D. L. S. Shinn in 1962 to treat acute ulcerative gingivitis; more recently, it has been extensively used in treating diseases such as IBD and Clostridium difficile infection (15). The colonic mucosal barrier plays an important role in protecting epithelium integrity and functionality. The secretion of mucus, which is predominately mediated by the secretory mucin MUC2, and of other components such as antimicrobial peptides and immunoglobulins forms a complex biochemical matrix to maintain a dynamic and healthy barrier (16, 17). The C-type lectins Reg3β and Reg3γ are encoded by members of the REG family and are antimicrobial peptides synthesized by Paneth cells in the small intestine and by crypt epithelium in the colon (18) and represent key elements of host defense supporting the mucosal barrier (19). Reg3β and Reg3γ have been reported to influence host-commensal and host-pathogen interactions in the gastrointestinal (GI) tract and to regulate the innate immune response (20, 21). It has been shown that metronidazole treatment significantly increased the expression of Reg3γ in the distal colon of mice, indicating increased microbial stimulation of the epithelium and a weakened mucosal barrier (13). In subsequent unpublished studies, however, we observed reduced Reg3γ expression in response to metronidazole treatment. It was noted that, in studies where Reg3γ expression dropped in response to metronidazole, there was a lack of Escherichia coli, whereas in experiments where Reg3γ expression increased, E. coli flourished in response to metronidazole treatment. Therefore, we hypothesized that the composition of the initial commensal microbiota, particularly with respect to the presence or absence of E. coli, contributed to the differences in host response to metronidazole treatment. In this study, it was found that the addition of a single commensal E. coli isolate resulted in a distinct pattern of microbial shift and host response after metronidazole treatment. While this study focused on a single commensal organism and a single antibiotic, it was designed as a proof-of-concept study to demonstrate that variations in the membership of the preexisting microbiota impact the subsequent changes in microbial composition as well as the host response to antibiotic treatment.
RESULTS
Metronidazole treatment stimulated an overgrowth of colonic commensal E. coli.
A commensal E. coli isolate was collected from a fresh mouse fecal sample on MacConkey agar. The genome of the mouse E. coli isolate consisted of a single circular chromosome of 5,190,098 bp with an average GC content of 50.60%. The number of predicted unique genes carried by the chromosome is 4,826. There were no identified hits of toxin virulence factor (VF)-related genes in the genome of the E. coli isolate.
Wild-type C57BL/6 mice obtained from Jackson Laboratory (Bar Harbor, ME) were identified to be free of E. coli by selective culture of fecal samples on MacConkey agar. The commensal E. coli isolate successfully colonized the mouse intestine with a single dose in the group subjected to E. coli colonization only (EC group) and in the group given metronidazole treatment after E. coli colonization (EC-MET group), with levels ranging from 2.22 × 10⁵ to 2.25 × 10⁶ CFU/g feces 2 days after exposure. The abundance ranged from 1.07 × 10⁵ to 6.21 × 10⁶ CFU/g feces 10 days after E. coli treatment, indicating the stability of the E. coli colonization (Fig. 1B). Enumeration of E. coli in mouse feces collected after 4 days of metronidazole/water administration showed that E. coli was 6,830-fold more abundant in the EC-MET group than in the EC group (CFU/gram of feces) (Fig. 1B). Neither body weight loss nor death was observed with colonization of E. coli. There were no differences in body weight between the metronidazole-treated (MET) group and the vehicle control (CON) group (Fig. 1C).
FIG 1.

Experimental protocol. (A) E. coli resuspended in PBS at a concentration of 2.0 × 10⁸ CFU/ml was given to mice (0.1 ml/each mouse). Metronidazole was given at 750 mg/liter in drinking water. Body weight was recorded weekly. Mice were sacrificed on day 4 (A1) or day 14 (A2). (B) Enumeration of E. coli in mouse feces before metronidazole treatment and 4 days after metronidazole/water administration. Dots represent individual mice, and lines depict the mean values. (C) Body weight change during the E. coli treatment and after 4 days of metronidazole/water treatment. For all treatment groups, n = 8. Data are shown as means ± SEM. Means that do not share a letter (a or b) are significantly different. α = 0.05.
Metronidazole treatment reduced enteric microbial biodiversity.
The intestinal microbiota was characterized after 4 days of metronidazole/water treatment by sequencing of 16S rRNA gene tags (V3-V4 region) from colonic contents using an Illumina MiSeq platform. The number of sequencing reads obtained was 3,134,825, with an average of 101,123 ± 36,174 (mean ± standard deviation [SD]) quality-controlled and chimera-checked reads per sample. Operational taxonomic unit (OTU) clustering (97% cutoff) yielded a total of 535 OTUs for the entire data set, which included 373 OTUs associated with the CON data set, 167 OTUs associated with the MET group, 262 OTUs associated with the EC-MET group, and 320 OTUs associated with the EC group.
To evaluate the phylogenetic richness and evenness of the intestinal microbiota, Chao1 diversity index and Shannon index values were calculated for each sample. The number of sequences per library was normalized to 29,037 for the bacterial community according to the minimum number of reads among all of the libraries. E. coli-metronidazole interactions were demonstrated in the Chao1 index values (P < 0.05) and the Shannon index values (P < 0.01) (Fig. 2A). The Chao1 and Shannon index values for the intestinal microbiota in the CON and EC groups were significantly higher than those in both metronidazole-treated groups, indicating that a lower level of alpha diversity resulted from metronidazole treatment (P < 0.05) (Fig. 2A). Under conditions of treatment with metronidazole, the group with E. coli colonization showed a greater reduction in alpha diversity than the MET group (Shannon index, P < 0.05; Fig. 2A).
FIG 2.

(A) Alpha diversity analysis of bacterial communities in colon contents of mice. All the colonic contents were harvested after 4 days of metronidazole/water administration. Data are shown as means ± SEM. Means that do not share a letter (a, b, or c) are significantly different. α = 0.05. (B) Bar chart indicating microbial community profiles between groups, summarized down to the genus level. Microbial compositions of the four groups before experimental treatment are labeled CON_PRE, MET_PRE, EC_MET_PRE, and EC_PRE, respectively. uncl, unclassified.
Overall structural changes of gut microbiota in response to metronidazole treatment.
To assess the abundance profiles of different phyla and genera, all sequences were assigned to taxonomy using RDP Classifier. There were significant differences between groups at different taxonomic levels. Bacteroidetes was the most predominant phylum in the CON and EC groups, contributing averages of 77.8% and 72.6% of the microbial communities, respectively. Firmicutes was the next most dominant phylum, representing averages of 21.5% and 26.2%, respectively. In the MET group, the most abundant phylum was Firmicutes (71.7%), while Actinobacteria (23.2%) and Verrucomicrobia (4.6%) constituted the next most abundant phyla. However, in the EC-MET group, Proteobacteria was the dominant phylum, with 81.8% of the microbiota, and much lower levels of Firmicutes (10.1%), Actinobacteria (6.2%), and Bacteroidetes (1.8%) were present (Fig. 2B). Principal-component (PC) analysis based on weighted UniFrac distances revealed a distinct clustering of MET and EC-MET groups but no separation of the CON and EC groups based on the first two PC analysis scores, which accounted for 88.30% and 9.82% of the total variation, respectively (Fig. 3A). The permutational multivariate analysis of variance (adonis) exhibited the separation of the MET and EC-MET groups from the CON and EC groups (P < 0.01).
FIG 3.

(A) Principal-component analysis (PCA) plots of the bacterial communities based on the weighted UniFrac distance matrix. Each plot point represents an individual mouse. (B) Box plots show selective levels of bacterial abundance in different treated groups at the family level. Colonic contents were collected after 4 days of metronidazole/water treatment. For all treatment groups, n = 8. Data are shown as means ± SEM. Means that do not share a letter (a, b, or c) are significantly different. α = 0.05.
Multivariate analysis performed on the OTUs suggested that colonization by E. coli isolates did not result in major shifts in microbial composition compared to the microbial profile in the CON group. The most profound changes were those of enrichment of the genera of Allobaculum (0.65% versus 0.04%, P < 0.01), Akkermansia (0.85% versus 0.2%, P < 0.01), Lactobacillus (2.16% versus 0.76%, P < 0.01), and Ruminococcus (0.66% versus 0.29%, P < 0.01) in the EC group versus the CON group (Fig. 2B). In addition, the microbiota in the MET group underwent profound losses (P < 0.05) of the genera of unclassified Clostridiales (represented in outputs as “Clostridiales_unclassified”) and Rikenellaceae_unclassified and became dominated by Lactobacillus, Bifidobacterium, Enterococcaceae_unclassified, Turicibacter, and Akkermansia species in comparison to the CON and EC groups (Fig. 2B and 3B). However, with the presence of E. coli, metronidazole treatment induced a distinct pattern of microbial composition. The EC-MET group showed marked expansion of the Enterobacteriaceae proportions (represented by the inoculated E. coli only) compared to the EC group (81.74% versus 0.02%) and contractions of previously dominant populations, which were substantial for Bacteroidales_S24-7_unclassified and Clostridiales_unclassified and modest for Turicibacter (Fig. 2B and 3B). The presence of E. coli and metronidazole administration interacted in producing significant effects on the abundance of certain bacterial families, including Bifidobacteriaceae, Lactobacillaceae, Enterococcaceae, and Enterobacteriaceae (Fig. 3B). The distinct effect of metronidazole on colonic microbial composition confirmed that the alterations in bacterial communities were highly dependent on the presence of E. coli before antibiotic administration.
Because analysis of microbial composition is based on relative levels of abundance and because the increase in the level of E. coli alone could reduce the relative abundances of other taxa without reducing their numbers, the microbiota of the EC-MET group were compared to those of the MET group, with the OTUs representing the effects of E. coli removal. Even with E. coli removed from the analysis, the community compositions determined on the basis of beta diversity were still significantly different between the EC-MET and MET groups (adonis analysis, P < 0.05; number of permutations, 999). In addition, there were differences in the abundances of some genera between the metronidazole-treated groups, including reduced abundance of Turicibacteraceae in the EC-MET group (17.9 ± 5.81%, means ± standard errors of the means [SEM]) compared to the MET group (0.69 ± 0.23%, means ± SEM).
Host response to metronidazole treatment is driven by the corresponding initial bacterial composition.
As mentioned above, our previous studies in mice showed inconsistent changes in mRNA expression of host antimicrobial protein Reg3γ in response to metronidazole treatment. Based on the hypothesis that the preexisting gut microbiota may play a role in driving the differences in host responses to administration of antibiotics, the levels of mRNA expression of Reg3β, Reg3γ, MUC2, and IL-22 were analyzed using real-time PCR. As shown in Fig. 4A and B, EC-MET mice exhibited a significant increase in mRNA expression of both Reg3β and Reg3γ compared to the levels seen in the CON group (P < 0.05). Mice without E. coli colonization showed substantial variations (7.94-fold ± 4.43-fold change, means ± SEM) in Reg3β mRNA expression levels in response to metronidazole treatment, whereas the group with E. coli colonization showed a consistent increase in Reg3β expression (13.07-fold ± 2.07-fold change, means ± SEM) with metronidazole treatment (Fig. 4A). In contrast, the increased mRNA expression of Reg3γ in response to metronidazole treatment was tightly associated with the enrichment of the proportion of E. coli (Fig. 4B). It has been reported that metronidazole treatment induced a reduction in MUC2 mRNA expression and a thinning of the mucus layer in the distal colon in mice (13). In the current study, colonization of E. coli tended to stimulate the mRNA expression of MUC2 (0.05 < P ≤ 0.1) (Fig. 4C). Although the MET group had slightly lower expression levels of MUC2 mRNA, there was no significant difference between the MET and CON groups in MUC2 expression. There was no significant change in IL-22 expression detected in the MET, EC, and EC-MET groups compared to the CON group (P > 0.05, Fig. 4D).
FIG 4.

Quantitative RT-PCR results of (A) Reg3β, (B) Reg3γ, (C) MUC2, and (D) IL-22 expression in the colon of untreated and E. coli- and metronidazole-treated mice. Colonic tissue samples were harvested after 4 days of metronidazole/water administration. For all treatment groups, n = 8. Data are shown as means ± SEM. Means that do not share a letter (a or b) are significantly different. α = 0.05.
To determine whether increased Reg3β and Reg3γ expression was associated with intestinal inflammation, colonic cytokines were measured by enzyme-linked immunosorbent assay (ELISA). The most profound change in the colonic cytokine profile was the level of tumor necrosis factor alpha (TNF-α), as shown in Fig. 5A1. TNF-α expression was induced in EC-MET mice compared to all other treatment groups (P < 0.01). There was an E. coli-metronidazole interaction corresponding to the expression level of TNF-α (P < 0.05), which indicated that the combination of E. coli and metronidazole was required to drive this response. Metronidazole treatment in the absence of E. coli did not increase TNF-α levels; however, it did increase the expression level of interleukin-1 beta (IL-1β) (P < 0.05), IL-6 (P < 0.01), and IL-10 (P < 0.01) (Fig. 5B).
FIG 5.

Results of cytokine analysis of (A1) TNF-α, (B1) IL-1β, (B2) IL-6, and (B3) IL-10 production in the colon. Colonic tissue samples were collected after 4 days of metronidazole/water treatment. For all treatment groups, n = 8. Data are shown as means ± SEM. Means that do not share a letter (a or b) are significantly different. α = 0.05. (A2) Correlation of colonic E. coli bacterial load with TNF-α expression levels in EC-MET group. Spearman's correlation coefficient (r values) and significance P values are shown.
The correlation between enriched E. coli abundance in the EC-MET group and levels of TNF-α was analyzed using Spearman's rank correlation. As shown in Fig. 5A2, there was a trend for TNF-α expression levels to be correlated with colonic E. coli counts (r = 0.643, P = 0.096). Collectively, there was a clear pattern of increased proinflammatory cytokines (TNF-α) in E. coli-colonized mice in response to metronidazole administration, though the histological analysis of distal colon sections from all groups did not show significant evidence of inflammation (Fig. 6). In contrast, in the absence of E. coli, the MET group did not exhibit upregulation of TNF-α. The results suggest that the immune homeostatic imbalance of colonic epithelium triggered by metronidazole treatment was driven by the initial commensal microbial composition profile.
FIG 6.
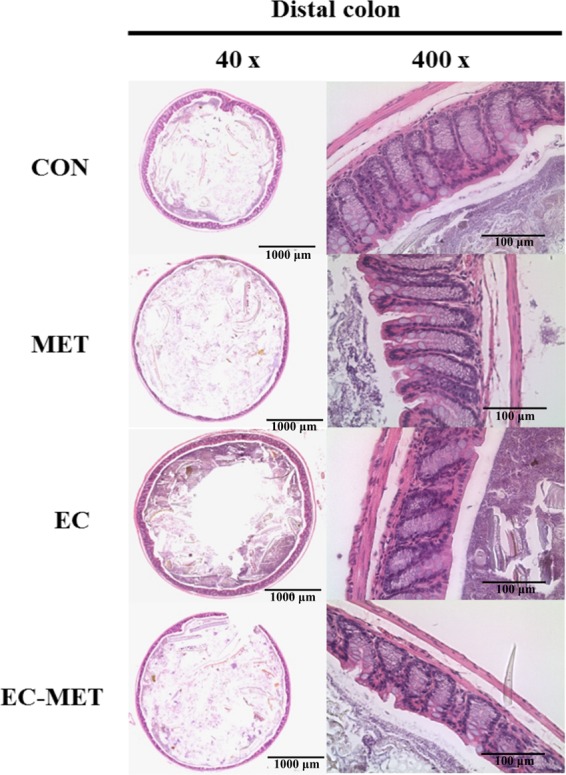
Distal colon sections from CON, MET, EC, and EC-MET mice 4 days after metronidazole/water treatment were stained with hematoxylin and eosin. There was no significant inflammation evidence in any of the treatments, including inflammation and damage to the lumen, surface epithelium, mucosa, and submucosa, as well as the number of goblet cells. Original magnification and bars: left, ×40 and 1,000 μm; right, ×400 and 100 μm.
In the long-term metronidazole treatment experiment, the stimulating effects of metronidazole on colonic commensal E. coli growth were stable (Fig. 7A1). The abundance of E. coli after metronidazole treatment for 14 days ranged from 1.50 × 10⁸ to 2.08 × 10¹⁰ CFU/g feces, whereas the abundance of E. coli in the group that received water for 14 days ranged from 7.50 × 10⁴ to 9.44 × 10⁵ CFU/g feces (Fig. 7A1). With the overgrowth of E. coli during the long-term metronidazole administration, the expression levels of Reg3β and Reg3γ mRNA persisted (P < 0.05) (Fig. 7A2 and A3).
FIG 7.

Enumeration of E. coli in mouse feces and colonic gene expression of mice colonized with (A) commensal E. coli isolates, (B) a wild mouse E. coli isolate, and (C) a rat E. coli isolate. For enumeration of E. coli in mouse feces, samples were taken before metronidazole treatment and after 14 days (A1) or 4 days (B1 and C1) of metronidazole/water treatment. Dots represent individual mice, and lines depict the mean values. Reg3β and Reg3γ expression in the colon of untreated and E. coli- and metronidazole-treated mice was detected by quantitative RT-PCR. Colonic tissue samples were harvested after 14 days (A2 and A3) or 4 days (B2, B3, C2, and C3) of metronidazole/water administration. For all treatment groups, n = 5. Data are shown as means ± SEM. Means that do not share a letter (a or b) are significantly different. α = 0.05.
The commensal E. coli strains isolated from wild mouse and healthy rat stably colonized the mouse intestine, with average abundances of 5.57 × 10⁶ and 1.15 × 10⁵ CFU/g feces, respectively. Four-day metronidazole treatment significantly increased the abundance of E. coli to averages of 3.35 × 10⁹ and 1.24 × 10⁹ CFU/g feces in the group with metronidazole treatment after wild mouse E. coli isolate colonization (WMEC-MET group) and the group with metronidazole treatment after rat E. coli isolate colonization (REC-MET group), respectively (Fig. 7B1 and C1). In the wild mouse E. coli isolate-colonized mice, metronidazole administration also increased (P < 0.05) the expression levels of Reg3β and Reg3γ mRNA, which showed 2.8-fold and 7.7-fold changes, respectively, compared to the levels in the CON group (Fig. 7B2 and B3). However, in the rat E. coli isolate-colonized mice, metronidazole treatment did not significantly affect the expression of these two genes in conjunction with E. coli proliferation (Fig. 7C2 and C3).
DISCUSSION
The results of this study show that the preexisting composition of commensal microbes plays an important role in how the host responds to antibiotic treatment. In particular, the presence or absence of commensal E. coli impacts mucosal immunity of the colon and alters the shifts in microbial composition induced by metronidazole treatment. Our current study showed that metronidazole administration dramatically reduced the biodiversity of the gut microbiota, as indicated by Chao1 and Shannon index values. Changes in the microbiome largely reflected an increase in the E. coli population, which induced expression of genes encoding antimicrobial peptides and inflammation-related gene products.
It is well recognized that administration of broad-spectrum antibiotics significantly reduces the richness and evenness of the intestinal microbiota (22, 23). In the current study, we observed lower biodiversity in gut microbiota after a 4-day metronidazole treatment. Among the metronidazole-treated mice, the presence of E. coli accelerated the reduction in the diversity of the gut microbiota, as indicated by Shannon index values. The observation suggested that the gut microbial composition before treatment with an antibiotic could be predictive of the degree of reduction in diversity, at least in the case of administration of this specific antibiotic.
Previously published studies have shown that metronidazole treatment induced a significant disturbance in the microbial composition of the colon, targeting depletion of obligate anaerobic Bacteroidales communities (13, 14, 24). Consistent with previous findings, the results of comparison of the MET group to the CON group exhibited a dramatic decrease in the relative abundance of members of the Bacteroidales S24-7 family. Studies in humans and animal models have demonstrated that broad-spectrum antibiotics targeting specific pathogenic organisms can influence the commensal microbial community to a much greater degree than previously assumed. A recent study which used metronidazole and vancomycin to treat wild-type C57BL/6 mice from Jackson Laboratory showed that the populations of members of Enterococcus and Proteobacteria_unclassified and of novel members of Lactobacillus and Clostridium greatly expanded with metronidazole treatment and that those of Lactobacillus aviarius, Enterococcus faecalis, Klebsiella oxytoca, and Akkermansia muciniphilia expanded with vancomycin treatment. Moreover, the authors observed that the expansion of the populations was highly dependent on the composition of the initially colonized communities (24). Another study reported that a single dose of clindamycin treatment administered for 1 day in mice resulted in generally similar expansions and contractions of gut microbiota populations but that occasional differences between individuals were observed. The authors concluded that these differences between individuals were likely due to the subtle differences in the initial commensal microbiota (25). In concordance with the previous studies, we observed a great expansion of populations of Enterococcus, Lactobacillus, and Clostridium compared to the initial point in the MET group. In addition, the presence of commensal E. coli resulted in very different expansion characteristics, showing the remarkable effects of a subtle difference in the populations in the initial microbiota. It has been widely recognized that the compositions of human gut microbiota differ among individuals as a result of different selection pressures from the host, microbial ecosystem, and environment. Therefore, it is essential to be aware of the initial difference in evaluating the outcome of antibiotic treatments.
In the current study, there was a distinct host response to metronidazole treatment with respect to innate immunity as well as mucosal homeostasis due to the addition of a single commensal organism to the initial microbiota. Evidence has correlated changes of host innate mucosal immunity with commensal microorganisms in previous studies. Acute colonization with commensal Schaedler's E. coli in immunocompetent germfree BALB/c mice resulted in 1.6-fold to 3.5-fold induction of Reg3β and Reg3γ expression and no induction of gamma interferon (IFN-γ) (26). In the current study, the addition of E. coli alone did not result in increased expression of Reg3β and Reg3γ. This likely reflects the much greater degree to which E. coli colonizes in a germfree animal than in a conventional animal (27). Interestingly, in another study where germfree C57BL/6 mice were monocolonized with a non-host-adapted commensal E. coli JM83 strain for 3 weeks, Reg3γ expression was not increased (28), indicating that E. coli must be somewhat host adapted and must have the ability to penetrate to the mucosal surface to elicit this response. It has been reported that Lactobacillus reuteri exhibited different host-adapted lineages in mice, indicating the evolutional host-driven diversification (29). In addition, a study using a germfree mouse model colonized with single commensal bacteria clearly showed that Reg3γ expression is not driven by an enriched total number of bacteria but is instead triggered by increased microbe-epithelium contact at the mucosal surface (18). The increased expression of Reg3β and Reg3γ genes has been associated with an inflammatory response and bacterial reconstitution, which was accompanied with strengthened communication between gut commensal bacteria and the mucosal surface (30). In the current study, the elicited expression of the Reg3β and Reg3γ genes in the EC-MET group (at both 4 days and 14 days) and in the WMEC-MET group was likely due to increased contact between commensal bacteria and the mucosal surface, which was stimulated by the imbalanced microbiota to fortify epithelial barrier function. The lack of increased expression observed in Reg3β and Reg3γ genes in the REC-MET group may reveal that host adaptation is a prerequisite for the stimulation of gut epithelium by gut commensal bacteria.
Evidence suggests that IL-22 is a key element in the direct induction of expression of Reg3γ in the colon (31, 32); however, increased levels of IL-22 were not observed in the current study. It has been shown that Bifidobacterium breve NCC2950 induced expression of Reg3γ in the absence of IL-22, implying that the induction of expression of members of the Reg3 family involves multiple pathways (28). Therefore, the induced expression of Reg3β and Reg3γ in the current study likely occurred through a non-IL-22-mediated mechanism.
Metronidazole treatment of C57BL/6 mice has previously been shown to reduce mRNA expression of MUC2, resulting in a thinner mucus layer (13). However, it has been reported that metronidazole administration in rats increased the levels of bacteria penetrating the crypts and a thickening of the mucus layer in the proximal colon (33). In the current study, E. coli colonization significantly increased the expression of MUC2 whereas metronidazole treatment did not impact expression of the gene. This difference may be explained by the nature of the shifts in the microbiome seen in the previous rat study compared to the current study, supporting the concept that responses to antibiotic treatment vary depending on the preexisting microbiota.
An array of cytokines was analyzed in the colon of mice in response to antibiotic treatment as an indicator of intestinal inflammation. The results showed a trend for a correlation between E. coli enrichment and expression of TNF-α. Studies in different models, especially in vitro cell culture models, have reported the stimulation of inflammatory cytokines by commensal bacteria. It has been reported that a commensal E. coli strain stimulated Caco-2 cells to produce TNF-α and IL-1β but did not induce secretion of IFN-γ, IL-4, or IL-12 (34). The increase in TNF-α expression by commensal E. coli has been shown in an HT-29 cell line model as well (35). TNF-α is a proinflammatory cytokine for which expression is enhanced by a variety of stimuli such as bacterial endotoxin (lipopolysaccharide [LPS]) (36). The changes in expression of this proinflammation-related cytokine seen in the current study suggested that, with the acute and strong expansion of the commensal E. coli population in response to metronidazole treatment, the microbial changes triggered an imbalance in immune homeostasis. The immune homeostatic imbalance was likely due to the increase in contact between commensal bacteria and the intestinal epithelium resulting from E. coli expansion, and the imbalance in immune homeostasis might have in turn further exaggerated the alterations of the gut microbiota.
While the relationship between E. coli and metronidazole is of direct interest, this report provides a proof of concept with respect to the care that must be taken using antibiotics as a study tool since the differences in results from one experiment to the next can be attributed to the preexisting microbiota. Furthermore, the study demonstrated that initial gut microbial composition is a key factor driving host response to antibiotics administration, creating a compelling argument to consider personalized medication based on individual variation in gut microbiota.
MATERIALS AND METHODS
Mice.
C57BL/6J female mice (Jackson Laboratory, Bar Harbor, ME) (6 to 8 weeks of age) were housed in the animal facilities at the University of Alberta. Mice were kept in filter-topped cages, fed autoclaved food and water, and handled in a biosafety cabinet under specific-pathogen-free (SPF) conditions. Mice were randomly grouped into eight cages with 4 mice per cage by a laboratory animal technician under blind conditions and were balanced for average body weight. The cages were allocated to 4 treatments: a no-treatment control (CON), E. coli colonization (EC), metronidazole treatment (MET), and metronidazole treatment after E. coli colonization (EC-MET). The protocol of the study is shown in panel A1 of Fig. 1. Briefly, mice in the EC and EC-MET groups were exposed to commensal E. coli by oral gavage, while mice in the CON and MET groups received phosphate-buffered saline (PBS). At 10 days postcolonization, the MET and EC-MET mice were given metronidazole (Sigma-Aldrich, Oakville, Ontario, Canada) at 750 mg/liter in drinking water for 4 days, while the CON and EC groups continued on sterilized water. Mice were euthanized after 4 days of metronidazole/water administration, and tissues were harvested. The experiment was repeated 3 times with sample sizes of 4, 8, and 8, respectively (n = 20 in total).
To further investigate whether the effects of metronidazole on E. coli abundance and host response were transient or long term, 20 mice were randomly grouped into eight cages with 2 or 3 mice per cage. The cages were allocated to 4 treatments as described above (n = 5). The procedure for the 14 day metronidazole treatment is shown in Fig. 1A2. Additionally, in order to study whether the host response to metronidazole administration with the presence of E. coli was unique to the specific strain studied, two additional commensal E. coli isolates were added to repeat the protocol as shown in Fig. 1A1. Forty mice were randomly grouped into 16 cages with 2 or 3 mice per cage. The cages were allocated to 6 treatments (n = 5): a no-treatment control (CON), wild mouse E. coli isolate colonization (WMEC), rat E. coli isolate colonization (REC), metronidazole treatment (MET), metronidazole treatment after wild mouse E. coli isolate colonization (WMEC-MET), and metronidazole treatment after rat E. coli isolate colonization (REC-MET). The protocols employed were approved by the University of Alberta's Animal Care Committee and in direct accordance with the guidelines of the Canadian Council on the Use of Laboratory Animals.
Bacterial strains.
The commensal E. coli strains were isolated from a healthy NIH Swiss mouse (Harlan Laboratories, Inc., Indianapolis, IN), feces from a wild mouse (glycerol stock), and rat feces on MacConkey agar. The bacterial strains were cultivated in 5 ml of Luria-Bertani (LB) medium (Fisher Scientific, Nepean, Ontario, Canada) at 37°C for 16 h. The culture medium containing approximately 2.0 × 10⁸ CFU/ml of E. coli was centrifuged at 5,000 × g for 10 min to harvest the bacterial cells. The pellets of E. coli cells were suspended in 1× PBS, and the mice were exposed to E. coli by oral gavage with 0.1 ml of suspension. Enumeration of E. coli was conducted by serial dilutions of fecal samples plated on MacConkey agar (BD, Sparks, MD), and total CFU counts per gram fecal contents were then calculated.
Whole-genome sequencing and annotation.
To determine whether the E. coli isolates from a healthy mouse had any known virulence factors, the genome was sequenced. Whole-genome sequences of the isolated commensal E. coli strain were generated on an Illumina MiSeq platform. Illumina fragment libraries were generated using a Nextera XT DNA library preparation kit (Illumina, San Diego, CA) and quantified by the use of a Qubit 2.0 fluorometer (Invitrogen, Carlsbad, CA). Libraries were normalized to 2 nM, denatured using 0.1 N NaOH, and mixed with 5% PhiX genomic DNA as a positive control. The sequencing flow cell cluster amplification was performed with 2 × 300-bp end reads on an Illumina MiSeq instrument, using V3 MiSeq sequencing-by-synthesis kits (Illumina, San Diego, CA). The draft genome was assembled with the SPAdes assembler (37), and Rapid Annotations using Subsystems Technology (RAST) (38) was used for genome annotation. IslandViewer was used for predicting toxin-related virulence in the whole genome of the E. coli isolate (39).
Tissue collection.
At 4 days or 14 days after metronidazole treatment, mice were euthanized by CO2 asphyxiation followed by cervical dislocation. The terminal 5-mm piece of distal colon was collected for histological analysis, and the remaining colon tissue was harvested for subsequent gene expression and cytokine analysis. Colonic contents were collected for microbial composition analysis. All tissue samples were immediately placed in 10% neutral buffered formalin for histological studies or snap-frozen in liquid nitrogen.
Microbial composition analysis.
Total DNA was extracted from colonic contents using a QIA stool extraction kit (Qiagen Inc., Valencia, CA) with the addition of a bead-beating step as described in a previous study (40). Amplicon libraries were constructed from colonic content samples that amplified the V3-V4 region of the 16S rRNA gene according to the protocol from Illumina (16S metagenomic sequencing library preparation). The primers targeting the region were as follows: forward, 5′-TCGTCGGCAGCGTCAGATGTGTATAAGAGACAGCCTACGGGNGGCWGCAG-3′; reverse, 5′-GTCTCGTGGGCTCGGAGATGTGTATAAGAGACAGGACTACHVGGGTATCTAATCC-3′. A paired-end sequencing run was performed on an Illumina MiSeq platform (Illumina Inc., San Diego, CA) using 2 × 300 cycles. The raw sequence data obtained were filtered through a quality control pipeline, and bases with quality scores lower than 33 were filtered using FASTX-Toolkit. Paired-end sequencing reads were merged using the PANDAseq algorithm. The QIIME 1.9.1 (Quantitative Insight into Microbial Ecology) toolkit and Usearch version 7.1 were applied for obtaining an operational taxonomic unit (OTU) table (41, 42) using the following procedures. First, merged sequences were dereplicated and filtered for chimeras against the ChimeraSlayer reference database. Second, the high-quality reads were mapped against the database of usearch_global and the OTU table was obtained using the uc2otutab.py script. The classification of representative sequences for each OTU was carried out using the QIIME pipeline with the default algorithm of the Ribosome Database Project (RDP) classifier (confidence threshold, 80%). The Greengenes (GG) v.13_8 reference database clustered at 97% identity was used for assigning taxonomy. The alpha diversity parameters for the microbial community, including the Chao1 and Shannon index parameters, were estimated by normalizing the number of sequences per sample to the lowest counts among all samples.
RNA isolation and cDNA synthesis.
Colon tissue was excised, snap-frozen in liquid nitrogen, and subsequently stored at −80°C until RNA extraction. RNA was extracted using a GeneJET RNA purification kit (Thermo Scientific, Nepean, Ontario, Canada) following the manufacturer's instructions. RNA quality was verified by gel electrophoresis using 2× RNA gel loading dye (Thermo Scientific, Nepean, Ontario, Canada). The concentration of RNA was determined using a NanoDrop ND-2000 spectrophotometer (NanoDrop Technologies, Wilmington, DE), and 1 μg RNA was used for reverse transcription (RT) using a Maxima First Strand cDNA synthesis kit (Thermo Scientific, Nepean, Ontario, Canada).
Real-time PCR.
Real-time PCR was performed using PerfeCTa SYBR green Supermix (Quanta Bio, Gaithersburg, MD). Primers for expression of host genes (Reg3β, Reg3γ, MUC2, and IL-22) are listed in Table 1. Real-time PCR was performed using an ABI StepOne real-time system (Applied Biosystems, Foster City, CA) and the following cycles: 95°C for 20 s and 40 cycles of 94°C for 10 s and 60°C for 30 s. The glyceraldehyde-3-phosphate dehydrogenase gene (GAPDH) was used as the housekeeping gene for normalization. The fold change of gene expression compared to that seen with the control group was calculated using the 2−ΔΔCT method.
TABLE 1.
Primers and thermal cycling profiles for real-time PCR analysisa
| Targeted gene | Oligonucleotide sequence (5′–3′) | Reference |
|---|---|---|
| Reg3β | Forward: GGCTTCATTCTTGTCCTCCA | 43 |
| Reverse: TCCACCTCCATTGGGTTCT | ||
| Reg3γ | Forward: AAGCTTCCTTCCTGTCCTCC | 43 |
| Reverse: TCCACCTCTGTTGGGTTCAT | ||
| MUC2 | Forward: GCTGACGAGTGGTTGGTGAATG | 44 |
| Reverse: GATGAGGTGGCAGACAGGAGAC | ||
| IL-22 | Forward: TTGAGGTGTCCAACTTCCAGCA | 45 |
| Reverse: AGCCGGACGTCTGTGTTGTTA | ||
| GAPDH | Forward: ATTGTCAGCAATGCATCCTG | 13 |
| Reverse: ATGGACTGTGGTCATGAGCC |
The annealing temperature used for all of the genes was 60°C.
Cytokine determination.
For protein extraction, 50 to 100 mg snap-frozen colon tissues was stored at −80°C and subsequently homogenized in 150 μl radioimmunoprecipitation assay (RIPA) buffer containing 50 mM Tris-HCl (pH 8.0), 150 mM NaCl, 0.1% Triton X-100, 0.5% sodium deoxycholate, 1 mM sodium orthovanadate, 1 mM NaF, and protease inhibitor cocktail (Sigma-Aldrich, Oakville, Ontario, Canada). The homogenates were centrifuged at 10,000 × g for 20 min, and the supernatant was collected. Protein concentrations in the supernatant were determined using a Pierce bicinchoninic acid (BCA) protein assay kit (Thermo Scientific, Nepean, Ontario, Canada). An MSD Proinflammatory Panel 1 (mouse) kit (Meso Scale Discovery, Gaithersburg, MD) was used to quantify cytokines according to the manufacturer's recommendations, with an input protein concentration of 5 mg/ml. Cytokine concentrations were normalized to protein content.
Histology.
The distal 5-mm section of the colon was collected and immediately placed in 10% neutral buffered formalin at room temperature for 24 h and then placed into 70% ethanol. Fixed tissue was embedded in paraffin, sectioned into 5-μm slices, and subjected to hematoxylin and eosin (H&E) staining (13). Images were taken using an EVOS FL Auto Imaging system (Thermo Scientific, Nepean, Ontario, Canada). The well-oriented cross sections were assessed for pathology as previous described (13).
Statistical analysis and visualization.
Data were analyzed in a completely randomized design, and the fixed effects of the treatment in the model were E. coli presence and metronidazole treatment and their interaction. The individual mouse was considered the experimental unit. To compare the enumerations of E. coli determined at different time points, the Kruskal-Wallis test was used to calculate P values and Dunn's test was used for multiple comparisons (SAS Institute Inc., Cary, NC). Data of body weight, gene expression, and cytokine and microbial abundance (regularized log [x + 1] transformed) were analyzed by PROC GLM with Bonferroni correction in SAS. Microbial diversity indices (Chao1 and Shannon) for each sample were calculated using the vegan package in R (R 3.3.2). Results are expressed as mean values with standard errors of the means (SEM). Probability values below 0.05 were considered representative of significant difference. Principal-component analysis (PCA) of data derived from weighted UniFrac distance values was performed to evaluate the overall differences between groups using the JMP software program (version 10.0.2; SAS Institute Inc.). The permutational multivariate analysis of variance (adonis) was used to compare beta diversity data from four groups on the basis of Bray-Curtis dissimilarities with 999 permutations using R. Correlation of colonic E. coli bacterial loads with tumor necrosis factor alpha (TNF-α) levels was analyzed by Spearman rank correlation using SAS. GraphPad Prism 6 software (GraphPad Software, Inc., La Jolla, CA) was used for data graphing.
Accession number(s).
The whole-genome sequences of the mouse commensal E. coli isolate were deposited in the Sequence Read Archive (SRA) under accession number SRP092800. Raw sequence reads of the 16S rRNA gene amplicon data are available through the SRA with accession number SRP092663.
ACKNOWLEDGMENTS
We thank Kunimasa Suzuki from the Molecular Biology Core at the Alberta Diabetes Institute for his technical assistance with cytokine analysis.
This research was supported by a Natural Sciences and Engineering Research Council Discovery grant held by B.P.W. T.J. was supported by a Graduate Student Scholarship from Alberta Innovates-Technology Futures, Alberta, Canada. B.P.W. is supported by the Canada Research Chair Program.
REFERENCES
- 1.Sartor RB. 2004. Therapeutic manipulation of the enteric microflora in inflammatory bowel diseases: antibiotics, probiotics, and prebiotics. Gastroenterology 126:1–15. doi: 10.1053/j.gastro.2004.03.024. [DOI] [PubMed] [Google Scholar]
- 2.Jernberg C, Löfmark S, Edlund C, Jansson JK. 2007. Long-term ecological impacts of antibiotic administration on the human intestinal microbiota. ISME J 1:56–66. doi: 10.1038/ismej.2007.3. [DOI] [PubMed] [Google Scholar]
- 3.Jernberg C, Löfmark S, Edlund C, Jansson JK. 12 August 2010. Long-term impacts of antibiotic exposure on the human intestinal microbiota. Microbiology doi: 10.1099/mic.0.040618-0. [DOI] [PubMed] [Google Scholar]
- 4.Willing BP, Russell SL, Finlay BB. 2011. Shifting the balance: antibiotic effects on host-microbiota mutualism. Nat Rev Microbiol 9:233–243. doi: 10.1038/nrmicro2536. [DOI] [PubMed] [Google Scholar]
- 5.Langdon A, Crook N, Dantas G. 2016. The effects of antibiotics on the microbiome throughout development and alternative approaches for therapeutic modulation. Genome Med 8:39. doi: 10.1186/s13073-016-0294-z. [DOI] [PMC free article] [PubMed] [Google Scholar]
- 6.Colombel JF, Lemann M, Cassagnou M, Bouhnik Y, Duclos B, Dupas JL, Notteghem B, Mary JY. 1999. A controlled trial comparing ciprofloxacin with mesalazine for the treatment of active Crohn's disease. Groupe d'Etudes Therapeutiques des Affections Inflammatoires Digestives (GETAID). Am J Gastroenterol 94:674–678. [DOI] [PubMed] [Google Scholar]
- 7.Arnold GL, Beaves MR, Pryjdun VO, Mook WJ. 2002. Preliminary study of ciprofloxacin in active Crohn's disease. Inflamm Bowel Dis 8:10–15. doi: 10.1097/00054725-200201000-00002. [DOI] [PubMed] [Google Scholar]
- 8.Guslandi M. 2005. Antibiotics for inflammatory bowel disease: do they work? Eur J Gastroenterol Hepatol 17:145–147. doi: 10.1097/00042737-200502000-00003. [DOI] [PubMed] [Google Scholar]
- 9.Hu Y, Yang X, Qin J, Lu N, Cheng G, Wu N, Pan Y, Li J, Zhu L, Wang X, Meng Z, Zhao F, Liu D, Ma J, Qin N, Xiang C, Xiao Y, Li L, Yang H, Wang J, Yang R, Gao GF, Wang J, Zhu B. 2013. Metagenome-wide analysis of antibiotic resistance genes in a large cohort of human gut microbiota. Nat Commun 4:2151. doi: 10.1038/ncomms3151. [DOI] [PubMed] [Google Scholar]
- 10.Dethlefsen L, Huse S, Sogin ML, Relman DA. 2008. The pervasive effects of an antibiotic on the human gut microbiota, as revealed by deep 16S rRNA sequencing. PLoS Biol 6:e280. doi: 10.1371/journal.pbio.0060280. [DOI] [PMC free article] [PubMed] [Google Scholar]
- 11.Dethlefsen L, Relman DA. 2011. Incomplete recovery and individualized responses of the human distal gut microbiota to repeated antibiotic perturbation. Proc Natl Acad Sci U S A 108(Suppl 1):4554–4561. doi: 10.1073/pnas.1000087107. [DOI] [PMC free article] [PubMed] [Google Scholar]
- 12.Raymond F, Ouameur AA, Déraspe M, Iqbal N, Gingras H, Dridi B, Leprohon P, Plante PL, Giroux R, Bérubé È, Frenette J, Boudreau DK, Simard JL, Chabot I, Domingo MC, Trottier S, Boissinot M, Huletsky A, Roy PH, Ouellette M, Bergeron MG, Corbeil J. 11 September 2015. The initial state of the human gut microbiome determines its reshaping by antibiotics. ISME J doi: 10.1038/ismej.2015.148. [DOI] [PMC free article] [PubMed] [Google Scholar]
- 13.Wlodarska M, Willing B, Keeney KM, Menendez A, Bergstrom KS, Gill N, Russell SL, Vallance BA, Finlay BB. 2011. Antibiotic treatment alters the colonic mucus layer and predisposes the host to exacerbated Citrobacter rodentium-induced colitis. Infect Immun 79:1536–1545. doi: 10.1128/IAI.01104-10. [DOI] [PMC free article] [PubMed] [Google Scholar]
- 14.Löfmark S, Edlund C, Nord CE. 2010. Metronidazole is still the drug of choice for treatment of anaerobic infections. Clin Infect Dis 50(Suppl 1):S16–S23. doi: 10.1086/647939. [DOI] [PubMed] [Google Scholar]
- 15.Eykyn SJ, Phillips I. 1976. Metronidazole and anaerobic sepsis. Br Med J 2:1418. doi: 10.1136/bmj.2.6049.1418. [DOI] [PMC free article] [PubMed] [Google Scholar]
- 16.Van der Sluis M, De Koning BAE, De Bruijn ACJM, Velcich A, Meijerink JPP, Van Goudoever JB, Büller HA, Dekker J, Van Seuningen I, Renes IB, Einerhand AWC. 2006. Muc2-deficient mice spontaneously develop colitis, indicating that MUC2 is critical for colonic protection. Gastroenterology 131:117–129. doi: 10.1053/j.gastro.2006.04.020. [DOI] [PubMed] [Google Scholar]
- 17.Zarepour M, Bhullar K, Montero M, Ma C, Huang T, Velcich A, Xia L, Vallance BA. 2013. The mucin muc2 limits pathogen burdens and epithelial barrier dysfunction during Salmonella enterica serovar Typhimurium colitis. Infect Immun 81:3672–3683. doi: 10.1128/IAI.00854-13. [DOI] [PMC free article] [PubMed] [Google Scholar]
- 18.Vaishnava S, Yamamoto M, Severson KM, Ruhn KA, Yu X, Koren O, Ley R, Wakeland EK, Hooper LV. 2011. The antibacterial lectin RegIIIgamma promotes the spatial segregation of microbiota and host in the intestine. Science 334:255–258. doi: 10.1126/science.1209791. [DOI] [PMC free article] [PubMed] [Google Scholar]
- 19.Hiemstra PS. 2001. Epithelial antimicrobial peptides and proteins: their role in host defence and inflammation. Paediatr Respir Rev 2:306–310. [DOI] [PubMed] [Google Scholar]
- 20.Cash HL, Whitham CV, Behrendt CL, Hooper LV. 2006. Symbiotic bacteria direct expression of an intestinal bactericidal lectin. Science 313:1126–1130. doi: 10.1126/science.1127119. [DOI] [PMC free article] [PubMed] [Google Scholar]
- 21.Brandl K, Plitas G, Schnabl B, DeMatteo RP, Pamer EG. 2007. MyD88-mediated signals induce the bactericidal lectin RegIIIγ and protect mice against intestinal Listeria monocytogenes infection. J Exp Med 204:1891–1900. doi: 10.1084/jem.20070563. [DOI] [PMC free article] [PubMed] [Google Scholar]
- 22.Perez-Cobas AE, Gosalbes MJ, Friedrichs A, Knecht H, Artacho A, Eismann K, Otto W, Rojo D, Bargiela R, von Bergen M, Neulinger SC, Daumer C, Heinsen FA, Latorre A, Barbas C, Seifert J, Santos Dos VM, Ott SJ, Ferrer M, Moya A, Pérez-Cobas AE, Bergen Von M, Däumer C, Martins V, Dos Santos VM. 2013. Gut microbiota disturbance during antibiotic therapy: a multi-omic approach. Gut 62:1591–1601. doi: 10.1136/gutjnl-2012-303184. [DOI] [PMC free article] [PubMed] [Google Scholar]
- 23.Francino MP. 12 January 2016. Antibiotics and the human gut microbiome: dysbioses and accumulation of resistances. Front Microbiol doi: 10.3389/fmicb.2015.01543. [DOI] [PMC free article] [PubMed] [Google Scholar]
- 24.Lewis BB, Buffie CG, Carter RA, Leiner I, Toussaint NC, Miller LC, Gobourne A, Ling L, Pamer EG. 2015. Loss of microbiota-mediated colonization resistance to Clostridium difficile infection with oral vancomycin compared with metronidazole. J Infect Dis 212:1656–1665. doi: 10.1093/infdis/jiv256. [DOI] [PMC free article] [PubMed] [Google Scholar]
- 25.Buffie CG, Jarchum I, Equinda M, Lipuma L, Gobourne A, Viale A, Ubeda C, Xavier J, Pamer EG. 2012. Profound alterations of intestinal microbiota following a single dose of clindamycin results in sustained susceptibility to Clostridium difficile-induced colitis. Infect Immun 80:62–73. doi: 10.1128/IAI.05496-11. [DOI] [PMC free article] [PubMed] [Google Scholar]
- 26.Keilbaugh SA, Shin ME, Banchereau RF, McVay LD, Boyko N, Artis D, Cebra JJ, Wu GD. 2005. Activation of RegIIIbeta/gamma and interferon gamma expression in the intestinal tract of SCID mice: an innate response to bacterial colonisation of the gut. Gut 54:623–629. doi: 10.1136/gut.2004.056028. [DOI] [PMC free article] [PubMed] [Google Scholar]
- 27.Willing BP, Van Kessel AG. 2007. Enterocyte proliferation and apoptosis in the caudal small intestine is influenced by the composition of colonizing commensal bacteria in the neonatal gnotobiotic pig. J Anim Sci 85:3256–3266. doi: 10.2527/jas.2007-0320. [DOI] [PubMed] [Google Scholar]
- 28.Natividad JMM, Hayes CL, Motta JP, Jury J, Galipeau HJ, Philip V, Garcia-Rodenas CL, Kiyama H, Bercik P, Verdu EF. 2013. Differential induction of antimicrobial REGIII by the intestinal microbiota and Bifidobacterium breve NCC2950. Appl Environ Microbiol 79:7745–7754. doi: 10.1128/AEM.02470-13. [DOI] [PMC free article] [PubMed] [Google Scholar]
- 29.Oh PL, Benson AK, Peterson DA, Patil PB, Moriyama EN, Roos S, Walter J. 2010. Diversification of the gut symbiont Lactobacillus reuteri as a result of host-driven evolution. ISME J 4:377–387. doi: 10.1038/ismej.2009.123. [DOI] [PubMed] [Google Scholar]
- 30.Loonen LMP, Stolte EH, Jaklofsky MTJ, Meijerink M, Dekker J, van Baarlen P, Wells JM. 2014. REG3γ-deficient mice have altered mucus distribution and increased mucosal inflammatory responses to the microbiota and enteric pathogens in the ileum. Mucosal Immunol 7:939–947. [DOI] [PubMed] [Google Scholar]
- 31.Zheng Y, Valdez PA, Danilenko DM, Hu Y, Sa SM, Gong Q, Abbas AR, Modrusan Z, Ghilardi N, de Sauvage FJ, Ouyang W. 2008. Interleukin-22 mediates early host defense against attaching and effacing bacterial pathogens. Nat Med 14:282–289. doi: 10.1038/nm1720. [DOI] [PubMed] [Google Scholar]
- 32.Sanos SL, Vonarbourg C, Mortha A, Diefenbach A. 2011. Control of epithelial cell function by interleukin-22-producing RORgammat+ innate lymphoid cells. Immunology 132:453–465. doi: 10.1111/j.1365-2567.2011.03410.x. [DOI] [PMC free article] [PubMed] [Google Scholar]
- 33.Pélissier MA, Vasquez N, Balamurugan R, Pereira E, Dossou-Yovo F, Suau A, Pochart P, Magne F. 2010. Metronidazole effects on microbiota and mucus layer thickness in the rat gut. FEMS Microbiol Ecol 73:601–610. [DOI] [PubMed] [Google Scholar]
- 34.Haller D, Bode C, Hammes WP, Pfeifer AM, Schiffrin EJ, Blum S. 2000. Non-pathogenic bacteria elicit a differential cytokine response by intestinal epithelial cell/leucocyte co-cultures. Gut 47:79–87. doi: 10.1136/gut.47.1.79. [DOI] [PMC free article] [PubMed] [Google Scholar]
- 35.Bahrami B, Macfarlane S, Macfarlane GT. 2011. Induction of cytokine formation by human intestinal bacteria in gut epithelial cell lines. J Appl Microbiol 110:353–363. doi: 10.1111/j.1365-2672.2010.04889.x. [DOI] [PubMed] [Google Scholar]
- 36.De Plaen IG, Tan XD, Chang H, Wang L, Remick DG, Hsueh W. 2000. Lipopolysaccharide activates nuclear factor kappaB in rat intestine: role of endogenous platelet-activating factor and tumour necrosis factor. Br J Pharmacol 129:307–314. doi: 10.1038/sj.bjp.0703055. [DOI] [PMC free article] [PubMed] [Google Scholar]
- 37.Bankevich A, Nurk S, Antipov D, Gurevich AA, Dvorkin M, Kulikov AS, Lesin VM, Nikolenko SI, Pham S, Prjibelski AD, Pyshkin AV, Sirotkin AV, Vyahhi N, Tesler G, Alekseyev MA, Pevzner PA. 2012. SPAdes: a new genome assembly algorithm and its applications to single-cell sequencing. J Comput Biol 19:455–477. doi: 10.1089/cmb.2012.0021. [DOI] [PMC free article] [PubMed] [Google Scholar]
- 38.Aziz RK, Bartels D, Best AA, DeJongh M, Disz T, Edwards RA, Formsma K, Gerdes S, Glass EM, Kubal M, Meyer F, Olsen GJ, Olson R, Osterman AL, Overbeek RA, McNeil LK, Paarmann D, Paczian T, Parrello B, Pusch GD, Reich C, Stevens R, Vassieva O, Vonstein V, Wilke A, Zagnitko O. 2008. The RAST server: rapid annotations using subsystems technology. BMC Genomics 9:75. doi: 10.1186/1471-2164-9-75. [DOI] [PMC free article] [PubMed] [Google Scholar]
- 39.Dhillon BK, Laird MR, Shay JA, Winsor GL, Lo R, Nizam F, Pereira SK, Waglechner N, McArthur AG, Langille MGI, Brinkman FSL. 2015. IslandViewer 3: more flexible, interactive genomic island discovery, visualization and analysis. Nucleic Acids Res 43:W104–W108. doi: 10.1093/nar/gkv401. [DOI] [PMC free article] [PubMed] [Google Scholar]
- 40.Willing BP, Vacharaksa A, Croxen M, Thanachayanont T, Finlay BB. 2011. Altering host resistance to infections through microbial transplantation. PLoS One 6:e26988. doi: 10.1371/journal.pone.0026988. [DOI] [PMC free article] [PubMed] [Google Scholar]
- 41.Caporaso JG, Kuczynski J, Stombaugh J, Bittinger K, Bushman FD, Costello EK, Fierer N, Peña AG, Goodrich JK, Gordon JI, Huttley GA, Kelley ST, Knights D, Koenig JE, Ley RE, Lozupone CA, McDonald D, Muegge BD, Pirrung M, Reeder J, Sevinsky JR, Turnbaugh PJ, Walters WA, Widmann J, Yatsunenko T, Zaneveld J, Knight R. 2010. QIIME allows analysis of high-throughput community sequencing data. Nat Methods 7:335–336. doi: 10.1038/nmeth.f.303. [DOI] [PMC free article] [PubMed] [Google Scholar]
- 42.Edgar RC. 2010. Search and clustering orders of magnitude faster than BLAST. Bioinformatics 26:2460–2461. doi: 10.1093/bioinformatics/btq461. [DOI] [PubMed] [Google Scholar]
- 43.Curtis MM, Hu Z, Klimko C, Narayanan S, Deberardinis R, Sperandio V. 2014. The gut commensal bacteroides thetaiotaomicron exacerbates enteric infection through modification of the metabolic landscape. Cell Host Microbe 16:759–769. doi: 10.1016/j.chom.2014.11.005. [DOI] [PMC free article] [PubMed] [Google Scholar]
- 44.Hoebler C, Gaudier E, De Coppet P, Rival M, Cherbut C. 2006. MUC genes are differently expressed during onset and maintenance of inflammation in dextran sodium sulfate-treated mice. Dig Dis Sci 51:381–389. doi: 10.1007/s10620-006-3142-y. [DOI] [PubMed] [Google Scholar]
- 45.Satoh-Takayama N, Serafini N, Verrier T, Rekiki A, Renauld JC, Frankel G, DiSanto J. 2014. The chemokine receptor CXCR6 controls the functional topography of interleukin-22 producing intestinal innate lymphoid cells. Immunity 41:776–788. doi: 10.1016/j.immuni.2014.10.007. [DOI] [PubMed] [Google Scholar]