

ABSTRACT
Sunlight influences microbial water quality of surface waters. Previous studies have investigated photoinactivation mechanisms and cellular photostress responses of fecal indicator bacteria (FIB), including Escherichia coli and enterococci, but further work is needed to characterize photostress responses of bacterial pathogens. Here we investigate the photoinactivation of Staphylococcus aureus (strain Newman), a pigmented, waterborne pathogen of emerging concern. We measured photodecay using standard culture-based assays and cellular membrane integrity and investigated photostress response by measuring the relative number of mRNA transcripts of select oxidative stress, DNA repair, and metabolism genes. Photoinactivation experiments were performed in both oxic and anoxic systems to further investigate the role of oxygen-mediated and non-oxygen-mediated photoinactivation mechanisms. S. aureus lost culturability much faster in oxic systems than in anoxic systems, indicating an important role for oxygen in photodecay mechanisms. S. aureus cell membranes were damaged by sunlight exposure in anoxic systems but not in oxic systems, as measured by cell membrane permeability to propidium iodide. After sunlight exposure, S. aureus increased expression of a gene coding for methionine sulfoxide reductase after 12 h of sunlight exposure in the oxic system and after 6 h of sunlight exposure in the anoxic system, suggesting that methionine sulfoxide reductase is an important enzyme for defense against both oxygen-dependent and oxygen-independent photostresses. This research highlights the importance of oxygen in bacterial photoinactivation in environmentally relevant systems and the complexity of the bacterial photostress response with respect to cell structure and transcriptional regulation.
IMPORTANCE Staphylococcus aureus is a pathogenic bacterium that causes gastrointestinal, respiratory, and skin infections. In severe cases, S. aureus infection can lead to life-threatening diseases, including pneumonia and sepsis. Cases of community-acquired S. aureus infection have been increasing in recent years, pointing to the importance of considering S. aureus transmission pathways outside the hospital environment. Associations have been observed between recreational water contact and staphylococcal skin infections, suggesting that recreational waters may be an important environmental transmission pathway for S. aureus. However, prediction of human health risk in recreational waters is hindered by incomplete knowledge of pathogen sources, fate, and transport in this environment. This study is an in-depth investigation of the inactivation of a representative strain of S. aureus by sunlight exposure, one of the most important factors controlling the fate of microbial contaminants in clear waters, which will improve our ability to predict water quality changes and human health risk in recreational waters.
KEYWORDS: Staphylococcus aureus, coastal waters, enterococci, fecal indicator bacteria, photoinactivation
INTRODUCTION
In marine recreational waters, sunlight strongly influences concentrations of microbial contaminants through photoinactivation—inactivation due to exposure to light in the UV and visible spectra. A number of studies have therefore investigated bacterial photoinactivation in the context of environmental water quality (1–7), with further studies also focusing on photoinactivation in drinking water treatment (8–11), photodynamic therapy (12–15), and wastewater treatment (16–20). Bacteria can be inactivated by sunlight by direct and indirect mechanisms. Direct photoinactivation involves the absorption of photons from sunlight by vital cellular components, like DNA, resulting in changes in chemical bond structure that render the cell inactive (21). Alternatively, indirect photoinactivation involves the absorption of photons by sensitizers either within (endogenous) or outside (exogenous) the cell. Excited sensitizers can then transfer energy to vital cellular components, often through the generation of reactive oxygen species (ROS), to damage proteins, lipids, or DNA through oxidative mechanisms (17). The relative importance of direct and indirect bacterial photoinactivation in environmental systems remains poorly understood.
The majority of previous work on bacterial photoinactivation mechanisms in aquatic environments has focused on fecal indicator bacteria (FIB), such as enterococci, fecal coliforms, and Escherichia coli (2, 5, 6, 11, 19, 22–24), which are the basis of recreational and drinking water quality monitoring criteria (25) and have served as process indicators for decades. Fewer studies have investigated photoinactivation mechanisms of bacterial pathogens in aquatic environments (13, 26–28). Previous studies have identified factors and characteristics associated with increased photoinduced damage of FIB. For example, higher concentrations of dissolved oxygen lead to increased photoinactivation of fecal coliforms and Enterococcus faecalis (6, 17), and the presence of carotenoid pigments in certain enterococci tends to decrease their susceptibility to photoinactivation (4, 18). However, most previous research has focused on loss of culturability as the sole metric of photoinactivation, with a limited number of studies also addressing the effects of sunlight exposure on membrane integrity, cell metabolism, protein content, and gene expression in FIB (6–8, 29). These studies demonstrate that the bacterial photostress response is complex and not yet well understood. A more in-depth understanding of the photostress response of both FIB and pathogens may therefore improve our ability to model and predict water quality changes and human health risk.
Staphylococcus aureus, a Gram-positive pathogenic bacterium, is a major cause of skin and soft tissue infections, and frequencies of both health care- and community-associated S. aureus infections have been increasing in recent years (30). Community-associated infections in particular are cause for concern due to increases in antibiotic resistance among S. aureus strains, along with the ability of community-associated strains to cause illness in a generally younger and healthier population (31). S. aureus is commonly detected at recreational beaches in both seawater and sand (32–36), suggesting that the recreational water environment may be an important reservoir for S. aureus. Epidemiology studies have found associations between recreational water contact and skin ailments (37–40), further pointing to recreational water exposure as a transmission route for pathogenic S. aureus.
S. aureus has a membrane-bound carotenoid pigment called staphyloxanthin (41), which accumulates in S. aureus cells as they age. The carotenoid protects S. aureus from oxidative stress by scavenging radicals (42). Staphyloxanthin may also provide resistance to other stresses like desiccation and light exposure (43, 44). Previous field and laboratory studies on photoinactivation of Enterococcus spp. have found that pigmented enterococci are more resistant to photoinactivation than nonpigmented enterococci (4, 18), suggesting that the presence of pigmentation is an important factor for bacterial persistence in sunlight-exposed environments.
The present study investigated photoinactivation mechanisms and the photostress response of S. aureus strain Newman in clear seawater exposed to simulated sunlight. S. aureus was chosen due to its human health relevance (30), persistent detection in recreational waters (33), and production of carotenoid pigments that may protect against photostress (42). Photoinactivation of S. aureus was considered in both oxic and anoxic systems to differentiate between the effects of oxygen-mediated and oxygen-independent photoinactivation mechanisms. Additionally, multiple metrics were used to evaluate the effects of sunlight exposure, including loss of culturability, membrane damage, and expression changes in select stress response genes. Finally, a comparison of photoinactivation rates and photostress responses between S. aureus and E. faecalis was conducted, including the E. faecalis photoinactivation rates generated in this study, to address the applicability of using Enterococcus spp. as indicators for S. aureus.
RESULTS
Photoinactivation of Staphylococcus aureus.
Photoinactivation experiments were performed using simulated sunlight, with reactors consisting of seawater spiked with S. aureus strain Newman cultures. Experiments were performed under both oxic and anoxic conditions, and reactors were exposed to sunlight for 1, 6, or 12 h. During sunlight exposure, S. aureus initially decayed with approximate first-order rate kinetics under both oxic and anoxic conditions, followed by tailing where only low concentrations were detected (Fig. 1). A biphasic model was used to determine photoinactivation rate constants. Pearson's χ2 test was used to verify the goodness of fit of the decay models, with P > 0.05 under both conditions. The S. aureus photoinactivation rate constants (shown as mean ± standard error [SE]) for the first phase (k1) in the oxic and anoxic systems were 0.1 ± 0.004 and 0.03 ± 0.002 m2 kJ−1, respectively (Table 1). These rate constants are significantly different from each other (P < 0.05), as determined by a Z test, demonstrating that S. aureus photoinactivated more slowly under the anoxic condition than the oxic condition. For the oxic condition, the second-phase rate constant (k2 [−0.0006 ± 0.0009 m2 kJ−1]) is not statistically different from 0, suggesting that this phase represents a residual resistant population that is no longer inactivating. For the anoxic condition, k2 (0.003 ± 0.002 m2 kJ−1) is different from 0, suggesting this phase represents a subpopulation inactivating at a lower rate than the majority of cells.
FIG 1.
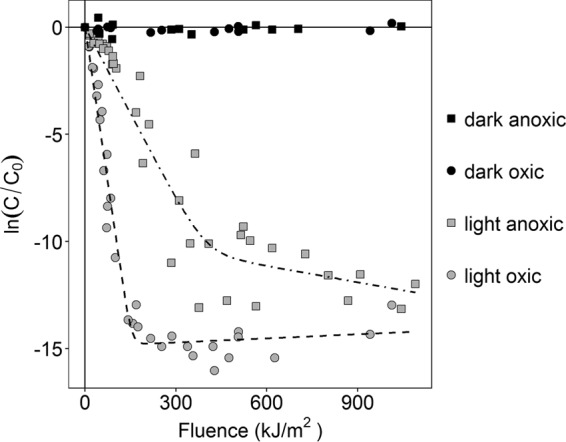
Photoinactivation of S. aureus in oxic and anoxic systems with respect to fluence (kilojoules per square meter). C, concentration of S. aureus at a particular fluence level; C0, initial concentration (both in CFU per milliliter). Dashed lines are modeled biphasic photoinactivation curves based on nonlinear regression.
TABLE 1.
Photoinactivation rate constants for S. aureus and E. faecalis under oxic and anoxic conditions
| Organism | Rate constant (m2 kJ−1) for reactor conditiona |
|||
|---|---|---|---|---|
| Light |
Dark |
|||
| Oxic | Anoxic | Oxic | Anoxic | |
| S. aureus | 0.1 ± 0.004 | 0.03 ± 0.002 | −0.000001 ± 0.00009 | 0.00002 ± 0.0002 |
| E. faecalis | 0.03 ± 0.005 | 0.01 ± 0.0008 | 0.0006 ± 0.0009 | 0.0002 ± 0.0002 |
Shown are the photoinactivation rate constants (mean ± standard error) for S. aureus and E. faecalis under oxic and anoxic conditions. Rate constants for S. aureus represent the first phase of inactivation (i.e., k1).
S. aureus concentrations in dark control reactors did not change over the course of the experiments in either the oxic or the anoxic system, as demonstrated by k values that did not significantly differ from 0 (Fig. 1 and Table 1). This result confirms that inactivation of S. aureus due to factors other than sunlight exposure did not occur in either the oxic or anoxic systems.
Membrane damage after sunlight exposure.
The membrane integrity of S. aureus cells was observed by using a nucleic acid dual-staining technique and fluorescence microscopy. Total cell concentrations stayed relatively constant throughout the photoinactivation experiments at ∼2 × 10⁸ cells/ml (Fig. 2). Approximately 92% of cells in the initial bacterial suspensions had intact cell membranes. By comparing samples taken before and after sunlight exposure, the fraction of intact cells in the light oxic, dark oxic, and dark anoxic reactors did not change significantly over the course of the experiments (paired t test, P > 0.05) (Fig. 2). In the light anoxic reactors, the fraction of intact cells decreased to ∼75% intact after 12 h of sunlight exposure (paired t test, P = 0.04).
FIG 2.

Effect of sunlight on S. aureus total cells and cell membrane integrity as determined by fluorescence microscopy. (Top) Total cell concentrations of S. aureus with respect to fluence. Concentrations are represented as the natural log-transformed relative concentration. C, concentration of total cells at a certain fluence level; C0, initial concentration (both in cells per milliliter). (Bottom) Fraction of intact cells with respect to fluence. The fraction of intact cells was calculated as the intact cell concentration divided by the total cell concentration (both in cells per milliliter).
Relative expression of oxidative stress, DNA repair, and metabolism genes.
Expression of a select set of stress response genes during sunlight exposure was evaluated by reverse transcription-quantitative PCR (RT-qPCR). Based on rankings from the NormFinder algorithm (45), the most appropriate reference genes for oxic and anoxic conditions were different (Table 2). For the oxic condition, the three most stable genes were recA, gapA, and pta. For the anoxic condition, the three most stable genes were pta, sodA, and ftsZ. These genes were used as reference genes for the two respective conditions. All genes not used as reference genes were analyzed as target genes (Table 2).
TABLE 2.
Target and reference genes analyzed by RT-qPCR
| Gene | Gene type by conditiona: |
|
|---|---|---|
| Oxic | Anoxic | |
| sodA | T | R |
| trxB | T | T |
| msrA | T | T |
| crtN | T | T |
| recA | R | T |
| rexA | T | T |
| gapA | R | T |
| ftsZ | T | R |
| pta | R | R |
T, target; R, reference. Reference genes were determined by the NormFinder algorithm. Any potential reference genes that were not among the genes most stably expressed were subsequently analyzed as target genes.
In general, expression of the selected target genes in the light versus dark reactors stayed fairly constant under both oxic and anoxic conditions, with the majority of relative expression ratios falling between 0.5 and 2 (Fig. 3). In total, only two time points showed expression that was different by at least 2-fold in the light versus dark microcosms. In the oxic system, increased expression (∼2-fold) was observed for msrA after 12 h of sunlight exposure. In the anoxic system, ∼4-fold increased expression was observed for msrA after 6 h of sunlight exposure. None of the target genes showed more than 2-fold decreased expression in the light versus dark microcosms (i.e., R ≥ 0.5 for all samples and target genes).
FIG 3.

Relative expression of crtN, gapA, msrA, pta, recA, rexA, sodA, and trxB. (Top) Oxic reactors. (Bottom) Anoxic reactors. Note that gapA and recA are not represented in the oxic plot and ftsZ and sodA are not represented in the anoxic plot because these genes were used as reference genes. Error bars represent ± geometric standard deviation. The dashed horizontal lines indicate a relative expression ratio of 1. *, R > 2.
Due to the fact that expression stayed relatively constant between treatment (sunlit) and control (dark) conditions, we chose to also evaluate smaller changes in expression by using an alternative metric for significance. In this case, we determined expression to be slightly increased or decreased if R was >1 or <1, respectively, and the standard deviation of R did not cross 1 (Table 3). In this case, trends in the expression of trxB are identical across oxic and anoxic conditions, with no significant changes in expression at any sunlight exposure duration. crtN, msrA, and rexA, on the other hand, are expressed differently under these two conditions. For crtN, expression was stable at all sunlight exposure durations under the oxic condition; under the anoxic condition, crtN expression decreased after 12 h of sunlight exposure. For msrA, expression increased in the oxic condition at 1 and 12 h of sunlight exposure but was stable at 6 h; under the anoxic condition, msrA expression was stable at 1 h but increased at 6 and 12 h of sunlight exposure. For rexA, expression was stable under the oxic condition at 1 and 6 h of sunlight exposure but decreased after 12 h, while under the anoxic condition rexA expression decreased at 1 h of sunlight exposure and remained stable after 6 and 12 h. Under the oxic condition, sodA expression increased at 6 h of sunlight exposure and ftsZ expression decreased at 12 h of sunlight exposure. In the anoxic microcosm, recA and gapA expression was stable across all time points.
TABLE 3.
Binary interpretation of relative expression ratios for target genes calculated by RT-qPCRa

Green and red table cells indicate values where R ± SD is significantly >1 or <1, respectively. In this case, significance is determined if the standard deviation does not cross 1. Asterisks indicate values where R is >2. Cells labeled “ref” indicate reference genes.
Comparison to Enterococcus faecalis photoinactivation.
We compared S. aureus photoinactivation kinetics to those of the nonpigmented indicator bacterium Enterococcus faecalis strain NCTC 775 (Table 1). Instead of comparing these values to E. faecalis photoinactivation rates found previously in the literature, we opted to perform replicate experiments in our lab with E. faecalis in order to keep all other factors (culture growth conditions, light source, reactor solution, and reactor geometry) identical and facilitate the comparison. No tailing was observed for E. faecalis photoinactivation curves, so a simple log-linear model was used to determine inactivation rate constants. Similar to S. aureus, E. faecalis was photoinactivated faster in the oxic than in the anoxic system, which is in agreement with a previous study (6). The E. faecalis photoinactivation rate constants in the oxic and anoxic systems were 0.03 and 0.01 m2 kJ−1, respectively, and were statistically significantly different from each other (P < 0.05). E. faecalis k values were smaller than k1 values for S. aureus under both oxic and anoxic conditions (P < 0.05).
DISCUSSION
The presence of oxygen significantly influenced photoinactivation. The first-phase decay rate constant of S. aureus strain Newman was significantly larger under the oxic compared to anoxic conditions, suggesting that oxygen-mediated indirect photoinactivation mechanisms are important for the decay of S. aureus. Such oxygen-mediated mechanisms are generally understood to depend on the generation of ROS that damage the cell through photooxidation, and studies have observed that oxygen increases photoinactivation rates for fecal indicator bacteria in environmental systems (6, 17, 19). In our experiments, ROS were likely generated by sensitizers inside S. aureus cells (i.e., endogenous sensitizers), because reactors consisted only of clear, simulated seawater seeded with S. aureus. The non-zero rate constant for S. aureus in the anoxic reactors indicates that S. aureus was also susceptible to non-oxygen-mediated photoinactivation mechanisms such as direct photoinactivation. These results are in agreement with previous work with E. faecalis, which showed decreased photoinactivation in anoxic systems (6).
Comparison of photoinactivation kinetics with those from previous studies is difficult due to differences in reactor geometries, aqueous solutions, light spectra, and cultivation conditions. Additionally, some studies do not report rate constants or report rate constants only as a function of time as opposed to fluence. Nevertheless, to compare our work with previous literature, we calculated the fluence dosage required for 90% decay (termed F90 [in kilojoules per square meter]) of S. aureus and E. faecalis. Under oxic conditions, the F90s for S. aureus and E. faecalis are 23.8 and 31.5 kJ/m2, respectively. While these values are lower than reported F90 values for E. coli (78.7 to 1,210 kJ/m2) (28, 46), they are similar to that of Staphylococcus epidermidis (31.5 kJ/m2) and higher than that of Campylobacter jejuni (7.0 kJ/m2) (28), suggesting that our observed photoinactivation kinetics are comparable to those from previous studies. However, we refrain from making more direct comparisons due to the differences in experimental design across these studies that can have a significant impact on observed photoinactivation rates.
Previous studies have shown that pigmented bacteria, such as S. aureus and certain strains of enterococci, are less susceptible to photostress and oxidative stress due to the pigments' ability to quench ROS (4, 18, 42). It is thus somewhat surprising that the pigmented S. aureus k1 value is larger than the k value for nonpigmented E. faecalis under oxic conditions. This conclusion suggests that there are some other characteristics of S. aureus that make it more susceptible to photooxidative damage (such as higher concentrations of endogenous sensitizers) or some characteristics of E. faecalis that make it more resistant (such as more efficient antioxidant mechanisms). The fact that the S. aureus first-phase rate constant was also larger than that of E. faecalis in the anoxic system suggests that S. aureus is also more sensitive to oxygen-independent photoinactivation mechanisms than E. faecalis. Possibly, this increased sensitivity to oxygen-independent photoinactivation allowed for a compounding effect in the oxic system, keeping the ROS-quenching ability of the carotenoid from adequately protecting the cells. However, it should also be noted that the S. aureus carotenoid would only be expected to protect the cell from oxidative stress if ROS were generated near the cell membrane, where the carotenoid is located (42). Previous studies have demonstrated the protective effect of the S. aureus carotenoid against oxidizers like hydrogen peroxide (H2O2) (42) and singlet oxygen (1O2) (47), but in these studies, ROS were generated exogenous to the cell. It is therefore possible that the S. aureus carotenoid was unable to provide significant protection for S. aureus exposed to sunlight due to ROS being generated endogenously.
In addition to assessing photoinactivation of S. aureus by a loss of culturability, we also measured membrane permeability to propidium iodide to draw conclusions regarding the cellular structural integrity. During the oxic experiments, we observed no increase in membrane permeability over 12 h of sunlight exposure, suggesting that the structural integrity of S. aureus cells remained largely intact, even when the majority of cells were not culturable. However, increases in membrane permeability were observed in cells exposed to sunlight under anoxic conditions. These results are in contrast to previous studies that have observed membrane damage in E. coli, Salmonella enterica, Shigella flexneri, and E. faecalis after sunlight or UVA exposure under oxic conditions (6, 10, 48). While it is difficult to directly compare results between studies due to differences in light spectra and cultivation conditions, this difference may be explained by the lower overall fluence experienced by cells in our study compared to others (10, 48). Perhaps we would expect to observe membrane damage in S. aureus under higher-exposure conditions. Alternatively, we hypothesize that the lack of membrane damage observed here may instead be due to the ROS-quenching ability of staphyloxanthin in the S. aureus cell membrane. Possibly, in the oxic system, ROS cause internal cellular damage rendering cells unculturable but are unable to significantly damage cellular membranes due to the presence of membrane-bound carotenoid pigments that quench any ROS generated near the cell membrane (42, 47). In contrast, in the anoxic system, ROS production is reduced and sunlight energy may more significantly target the cell membrane (see Fig. S1 in the supplemental material), possibly through direct breakdown of membrane proteins. Further study is needed to investigate this hypothesis.
To gain further insight into photoinactivation mechanisms in oxic and anoxic systems, we used RT-qPCR to measure the transcript abundance of various genes that we hypothesized could play a role in the S. aureus photostress response. sodA, trxB, and msrA are genes that encode oxidoreductase enzymes that have been shown to play a role in bacterial response to sunlight stress (6, 7) or other oxidative stresses in S. aureus (49, 50). crtN encodes squalene synthase, an enzyme involved in carotenoid biosynthesis (41). recA and rexA encode enzymes involved in various DNA repair functions (21, 51, 52). We also selected an additional three genes associated with basic metabolism and cell division functions (gapA, ftsZ, and pta); these genes, along with sodA and recA, were analyzed to determine appropriate reference genes for the oxic and anoxic conditions. Perhaps not surprisingly, in order to minimize stability values for possible reference genes, oxic and anoxic conditions were considered separately, indicating that the expression profiles in these systems were quite different from each other. Thus, sodA, pta, and ftsZ were used to normalize expression in the anoxic microcosms, and recA, gapA, and pta were used to normalize expression in the oxic microcosms.
Overall, expression of S. aureus target genes in the seawater microcosms was relatively stable between the light and dark conditions. This is likely because microcosms were oligotrophic and therefore did not provide cells with any additional energy source to initiate extensive protein synthesis. Additionally, the ranges of relative expression ratios determined here (minimum, R = 0.5; maximum, R = 4.4) are similar to expression levels in previous studies of E. faecalis in oligotrophic seawater systems (6, 7), which found maximum changes in expression of ∼3-fold by microarray. In contrast, some previous studies have observed larger expression changes in E. coli after sunlight exposure, but we expect this may be due to either the use of growth medium during sunlight exposure (9) or the use of a different method (i.e., transcriptome sequencing [RNA-seq]) to detect gene expression changes (26). Despite the fact that large changes in expression were not detected here, the approximately stable expression levels across samples in both systems suggest that cells remain transcriptionally active, even after the majority of cells are not culturable. It is not yet clear whether the gene expression detected after 12 h of sunlight exposure is due to expression in nonculturable cells or the small proportion of cells that remain culturable.
In both oxic and anoxic systems, significant changes in expression (i.e., R > 2 or R < 0.5) were only observed for msrA, which codes for a methionine sulfoxide reductase (Msr) enzyme. However, increased expression of msrA was observed at different sunlight exposure durations in the oxic versus anoxic systems: msrA expression was increased in the sunlight-exposed reactor after 12 h under oxic conditions and after 6 h under anoxic conditions. The main function of Msr is the reduction of methionine sulfoxide residues back to methionine, an important function for oxidative stress response (53, 54). Protein oxidation as a result of UVA exposure has previously been demonstrated in E. coli (29). The increase in msrA expression observed here under the oxic condition indicates that S. aureus cells may be responding to protein damage caused by methionine oxidation during sunlight exposure and that msrA is more important in this case than other oxidative stress response genes like sodA or trxB. Studies have also found that MsrA1 activity in S. aureus is associated with exposure to cell wall-active antibiotics (50, 55), suggesting the importance of MsrA in responding to cell wall stress. As msrA expression was also increased during sunlight exposure under the anoxic condition, this may be in response to the cell membrane damage that was observed by increasing membrane permeability, indicating that the photoinactivation mechanisms acting under the anoxic condition may target cell membranes through the breakdown of membrane proteins. Overall, these changes in expression suggest the importance of msrA for S. aureus in response to both oxygen-dependent and oxygen-independent photostresses.
In conclusion, this study confirms the importance of oxygen-mediated photoinactivation mechanisms for bacteria in seawater systems. Additionally, S. aureus cell membranes remained intact in oxic microcosms but were compromised in anoxic microcosms, suggesting different photoinactivation targets in these two systems. An investigation of relative expression of select genes suggests that S. aureus maintains metabolic activity throughout sunlight stress conditions. The panel of genes addressed in this study suggests that, despite different photoinactivation targets, the gene msrA was important for responding to both oxygen-dependent and oxygen-independent photostresses. Additionally, the genes addressed here suggest different defense strategies between S. aureus and the FIB E. faecalis. For example, while sodA was an important factor in the photostress response of E. faecalis (6, 7), expression of the same gene in S. aureus remained relatively constant, with msrA playing a more important role in response to photostress. The results here show that S. aureus photoinactivation rate constants are larger than those of E. faecalis under both oxic and anoxic conditions, which is in agreement with previous work (27) and suggests that S. aureus is more susceptible to both oxygen-dependent and oxygen-independent photoinactivation mechanisms. Further investigation into the photostress response of other model pathogens, as well as other strains of S. aureus and E. faecalis, is warranted and would provide a more in-depth understanding of photoinactivation differences between bacterial species and strains in oligotrophic environments.
MATERIALS AND METHODS
Experimental design and stock cultures.
Staphylococcus aureus strain Newman (ATCC 25904) and Enterococcus faecalis strain NCTC 775 (ATCC 19433) were obtained from the American Type Culture Collection and stored as frozen stocks in 20% glycerol. S. aureus strain Newman was selected as a representative S. aureus strain because of its characteristic and well-studied carotenoid production (41, 42). E. faecalis strain NCTC 775 was selected as a representative E. faecalis strain because of its recommended use as a control in water quality testing procedures (56). Bacterial cultures were grown in brain heart infusion (BHI) broth (Fluka Analytical, Steinheim, Germany) and on BHI agar (BD Difco, Sparks, MD).
The experimental design used to investigate photoinactivation is shown in Fig. 4. Every experiment consisted of three main phases: bacterial cultivation, microcosm setup, and photoinactivation. Bacterial cultivation was performed in the same manner for all experiments. Microcosm setup varied depending on whether the experiment was performed under oxic or anoxic conditions. Photoinactivation varied depending on the sunlight exposure duration (1, 6, or 12 h). Each experimental phase is described in further detail below. Within each experiment, control (“dark”) microcosms and experimental (“light”) microcosms were set up and sampled in parallel. For S. aureus, a total of 12 experiments were performed: six oxic experiments (two oxic experiments for each exposure duration) and six anoxic experiments (two anoxic experiments for each exposure duration). For E. faecalis, a total of four experiments were performed: two oxic experiments and two anoxic experiments. Experiments performed under identical conditions (oxic or anoxic) and identical exposure durations (1, 6, or 12 h) represent true biological replicates. Large-volume sampling events took place at the start (t0) and end (tend) of the photoinactivation phase of each experiment and were processed for metrics described below. Intermittent sampling was also performed during the photoinactivation phase to track the loss of culturability over time.
FIG 4.

Experimental design for investigating bacterial photoinactivation. Experiments consisted of three phases: bacterial cultivation, microcosm setup, and photoinactivation. Control (“dark”) and experimental (“light”) microcosms were set up and sampled in parallel.
Bacterial cultivation.
Bacteria were grown using chemostats. In brief, for each experiment, two 20-ml chemostats were fed with 25% BHI broth (flow rate of ∼0.004 liter/h), seeded with previously grown batch cultures of S. aureus or E. faecalis, and allowed to stabilize at 37°C at a growth rate of ∼0.2 h−1 for at least four residence times. Further details are provided in the supplemental material.
Microcosm setup.
All experiments were performed with simulated seawater (here “seawater”) (Table 4) (57). The seawater was made using molecular biology reagent water (Sigma-Aldrich, St. Louis, MO) and was filter sterilized using Millipore Steritop filter units (polyethersulfone [PES] filter; 0.22-μm pore size [Millipore, Darmstadt, Germany]). Simulated seawater was used to control the chemistry of the aqueous phase throughout the experiment and to ensure there were no exogenous sensitizers present in the water (4, 57, 58).
TABLE 4.
Composition of the simulated seawater used in this studya
| Salt | Concn (mM) | Source |
|---|---|---|
| Sodium chloride | 424 | EMD, Darmstadt, Germany |
| Sodium bromide | 0.87 | Sigma-Aldrich, St. Louis, MO |
| Sodium sulfate | 29.2 | Fisher Scientific, Fair Lawn, NJ |
| Sodium carbonate | 0.27 | Sigma-Aldrich, St. Louis, MO |
| Sodium bicarbonate | 1.83 | Fisher Scientific, Fair Lawn, NJ |
| Potassium chloride | 10.5 | Sigma-Aldrich, St. Louis, MO |
| Magnesium chloride | 54.8 | Sigma-Aldrich, St. Louis, MO |
| Calcium chloride | 10.7 | Sigma-Aldrich, St. Louis, MO |
Composition derived from Parker et al. (57).
For each experiment, bacterial seed stocks were generated by pooling two chemostat cultures. After pooling, the culture was centrifuged and washed twice in seawater. The final washed pellet was then resuspended in 20 ml of seawater; this bacterial suspension was then used as the seed stock for photoinactivation experiments.
Photoinactivation experiments were performed in oxic and anoxic microcosms to investigate oxygen-mediated and non-oxygen-mediated photoinactivation mechanisms. Experimental microcosms were made from black polyvinyl chloride (PVC) pipe (11.2-cm outer diameter, 10.2-cm inner diameter, 10.5-cm length) sealed at the bottom with a PVC end cap and secured with a metal hose clamp. Rubber septa (Geo-Microbial Technologies, Ochelata, OK) were inserted into the sides of the microcosms (see Fig. S2 in the supplemental material). Prior to each experiment, microcosms were sterilized by washing in 10% HCl.
For all experiments, the seed stock was diluted in ∼1 liter seawater for a starting concentration of ∼8 × 10⁷ CFU/ml. For experiments performed under oxic conditions, this seawater suspension was then held with continuous mixing in the dark at 15°C for 12 h to acclimate the culture to seawater and 15°C. After 12 h, the suspension was sampled to represent the initial time point (t0). Immediately after sampling at t0, the suspension was divided into two microcosms (designated control and experimental microcosms, as described further below).
For experiments performed under anoxic conditions, the seawater suspension was briefly mixed and immediately divided into two microcosms (designated control and experimental microcosms, as described further below). Quartz glass plates (Quartz Scientific, Inc., Fairport Harbor, OH) were then sealed to the tops of both microcosms using a silicone sealant, and nitrogen (ultra-high purity; Praxair, Danbury, CT) was sparged into the microcosms for at least 30 min. After sparging, both microcosms were held with continuous mixing in the dark at 15°C for 12 h. It was necessary to divide the mixture into the control and experimental microcosms prior to acclimation in order to maintain their anoxic conditions. After 12 h, the microcosms were sampled to represent the initial time point (t0).
Photoinactivation experiments.
Immediately after sampling at t0, the experimental microcosm (“light oxic” or “light anoxic”) was placed in a 15°C recirculating water bath and exposed to full-spectrum sunlight in a solar simulator (Suntest XLS+; Atlas, Chicago, IL). For all experiments, this microcosm was covered with a quartz glass plate (Quartz Scientific, Inc.): for anoxic microcosms, the plate was sealed to the microcosm; for oxic microcosms, it was held in place with tape. The microcosms were exposed to simulated sunlight at an intensity of 250 W m−2, and the emission spectrum from the solar simulator was measured using a spectroradiometer (ILT950; International Light Technologies, Peabody, MA). During each experiment, the second microcosm (“dark oxic” or “dark anoxic”) was covered with foil and held at 15°C in a constant temperature room to serve as a dark control. All microcosms were continuously stirred.
Samples were taken at the start (t0), end (tend), and periodically throughout the photoinactivation phase of the experiments (Fig. 4) and were processed as described below. For all sampling events from anoxic microcosms, samples were extracted through the rubber septa using hypodermic needles (Air-Tite Products, Virginia Beach, VA), and an equal volume of nitrogen at ambient temperature and pressure was injected into the microcosm prior to extraction of the sample.
Anoxic headspace sampling.
Samples were collected periodically from the headspace of the anoxic microcosms to verify that they remained anoxic. One-milliliter headspace samples were taken using a Pressure-Lok syringe (VICI Precision Sampling, Baton Rouge, LA). Headspace samples were then processed on a Gow-Mac gas chromatograph (series 580; Bethlehem, PA) to determine oxygen content. Microcosms were considered anoxic if oxygen levels remained below 2%.
Culture-based enumeration.
Throughout each experiment, 0.5-ml samples were taken to measure concentrations of S. aureus or E. faecalis using culture-based methods. Samples were taken from light microcosms every 10 min to 120 min, depending on the duration of the experiment. Samples were taken less frequently from dark microcosms: every 30 min to 360 min. Samples were either processed immediately or stored at 4°C for no more than 3 h and then processed. Samples were diluted as necessary in seawater, and 50 μl of appropriate dilutions was spread plated in duplicate on BHI agar plates. After incubation at 37°C for 18 to 24 h, CFU were counted on each plate.
Microscopy.
At the beginning (t0) and end (tend) of each S. aureus experiment, 0.5-ml samples were taken from each microcosm to assess membrane integrity using the BacLight LIVE/DEAD bacterial viability kit (Molecular Probes, Inc., Eugene, OR). In brief, samples were stained with a 1:1 mixture of component A and component B, filtered in triplicate on black polycarbonate filters (0.2-μm pore size; GVS Life Sciences, Sanford, ME), and visualized by epifluorescence microscopy under green and red fluorescence filters. Further details are provided in the supplemental material.
RNA sampling and extraction.
At the beginning (t0) and end (tend) of each S. aureus experiment, 200-ml samples were taken from each microcosm for RNA extraction. Samples were immediately centrifuged at 10,000 × g for 10 min. The supernatant was discarded, and pellets were resuspended in 2 ml RNAProtect bacterial reagent (Qiagen, Hilden, Germany) and allowed to incubate at room temperature for 5 min. Samples were then centrifuged again at 10,000 × g for 10 min, the supernatant was discarded, and pellets were immediately stored at −80°C until extraction, generally performed within 4 weeks.
For extraction, stored cell pellets were first lysed by resuspension in 200 μl of lysostaphin solution (0.2 mg/ml lysostaphin [Sigma-Aldrich] in Tris-EDTA [TE] buffer [Fluka Analytical]), followed by incubation for 10 min at 37°C on a shake table at slow speed (∼50 rpm). After incubation, 700 μl of a solution of buffer RLT (Qiagen) and β-mercaptoethanol was added to each sample (10 μl β-mercaptoethanol for each 1 ml buffer RLT). The samples were then further lysed mechanically by bead beating in Lysing matrix B tubes using a FastPrep-24 cell homogenizer (MP Biomedicals, Solon, OH). Bead beating was performed for a total of 3 min, with intervals of 30 s of bead beating and 30 s of resting on ice. After bead beating, samples were briefly centrifuged, and the supernatant (lysate) was transferred to a new tube and mixed with 470 μl ethanol. Total RNA was extracted from lysates using an RNeasy minikit (Qiagen) following the manufacturer's protocol and elution in 60 μl RNase-free water warmed to 60°C. After elution, samples were treated with DNase using the RNase-free DNase kit (Qiagen) following the manufacturer's protocol. DNase-digested samples were then cleaned using the RNeasy minikit and following the manufacturer's protocol for RNA cleanup with elution in 40 μl RNase-free water warmed to 60°C. Complete removal of DNA was confirmed by a qPCR assay described further in the supplemental material. For this entire procedure, from lysis through RNA cleanup, an extraction blank was also processed in parallel to verify that reagents were not contaminated.
RT-qPCR.
RT-qPCR was used to determine transcript abundance of nine S. aureus genes coding for the following products: superoxide dismutase A (sodA), thioredoxin reductase (trxB), methionine sulfoxide reductase (msrA), squalene synthase (crtN), recombinase A (recA), recombinational exonuclease (rexA), glyceraldehyde 3-phosphate dehydrogenase (gapA), cell division protein FtsZ (ftsZ), and phosphate acetyltransferase (pta). All RT-qPCR assays were performed on an Applied Biosystems StepOnePlus instrument (Foster City, CA). Primers and probes were designed using Primer Express software (v3.0; Applied Biosystems) along with NCBI Primer-BLAST and are based on sequences for the target genes as listed in the Kyoto Encyclopedia of Genes and Genomes (KEGG) for Staphylococcus aureus strain Newman (NCBI accession no. GCA_000010465.1). Additional details, including primer and probe sequences, reaction concentrations, and cycling parameters, are provided in the supplemental material. Results were analyzed with Applied Biosystems StepOne software (v2.3), with a threshold set at 0.03 for all assays.
Five of the genes analyzed by RT-qPCR in this study were chosen from options identified by Valihrach and Demnerova (59) as possible reference genes for S. aureus: sodA, recA, gapA, ftsZ, and pta. Expression of these five genes was evaluated by the NormFinder algorithm (45) for both oxic and anoxic conditions separately to identify the most appropriate reference genes. For each NormFinder evaluation, samples were grouped by the reactor treatment (light or dark). Further grouping of samples by time point altered stability values but did not alter the overall ranking of the reference genes. The three most stable genes for each condition were chosen as reference genes.
Data analysis.
All data were analyzed using Microsoft Office Excel 2007 (Redmond, WA) and R v3.2.4. From culture-based enumeration, relative concentrations were calculated by dividing the concentration in CFU per milliliter at a given time point by the concentration at t0 for a given experiment. Relative concentrations were then natural log (ln) transformed and plotted against fluence, which was calculated by accounting for light screening in the UVA and UVB range (280 to 400 nm). This is further described in the supplemental material and used the absorbance of the seawater-bacterium mixture. Inactivation rate constants for E. faecalis and for all dark control experiments were determined using a log-linear model:
| (1) |
In this equation, ln(C/C0) is the natural log-transformed relative concentration, F is fluence in kilojoules of UVA plus UVB per square meter, and k is the inactivation rate constant in square meters per kilojoule of UVA plus UVB. Inactivation rate constants for S. aureus were determined using a biphasic model (60, 61):
| (2) |
In this equation, f is the subpopulation fraction, and k1 and k2 are inactivation rate constants for the first and second phases, respectively. All other variables are as defined in equation 1. The biphasic inactivation model was used for S. aureus inactivation in order to account for the observed tailing, which was not apparent in E. faecalis inactivation data. Inactivation rates were calculated from data pooled across multiple experiments. k values were compared between experimental conditions using a Z test (α = 0.05).
The total cell concentration (TCC) and intact cell concentration (ICC) from fluorescence microscopy were calculated using an area conversion factor and were subsequently averaged across filter images and replicate filters. The fraction of intact cells in each sample was calculated as the ratio of ICC to TCC. Ratios were compared between light and dark reactors within a single experiment using a paired t test (α = 0.05).
Relative expression of various target genes was analyzed using RT-qPCR, where the experimental and control conditions were transcript levels in the light and dark microcosms, respectively, for a particular sunlight exposure (1, 6, or 12 h) and reactor condition (oxic or anoxic). For each gene, fold changes were first calculated using equation 3:
| (3) |
FCi is the fold change for gene i, Ei is the qPCR efficiency of gene i, and ΔCTi(dark − light) is the threshold cycle (CT) difference for gene i between the dark (control) and light (experimental) microcosms. For each gene, FCi was calculated using a Monte Carlo simulation to generate values of ΔCTi(dark − light) from a normal distribution defined by the mean and variance of CT values from triplicate qPCRs. Relative expression ratios (R) of each target gene were then calculated by a variation of the Pfaffl method (62), normalizing by the geometric mean (GM) of the FC of three reference genes (equation 4).
| (4) |
In this equation, R is the relative expression ratio, FCtarget is the fold change of a target gene, and GM(FCref1, FCref2, FCref3) is the GM of the fold changes of the reference genes. Table 2 shows the target and reference genes analyzed for this study. The resulting R distributions from Monte Carlo simulations were averaged across biological replicates. R values were subsequently defined as the GM and geometric standard deviation (SD) of the distributions. Significant changes in expression are determined if two conditions are met: (i) R ± SD does not include 1 and (ii) R is >2 or <0.5.
Supplementary Material
ACKNOWLEDGMENTS
This work was supported by National Science Foundation (NSF) grants CBET-1334359 and OCE-1129270. J.S.M. was supported by a NSF Graduate Research Fellowship (DGE-114747).
We thank Jorge Meraz for laboratory assistance.
The authors declare they have no conflicts of interest.
Footnotes
Supplemental material for this article may be found at https://doi.org/10.1128/AEM.01052-17.
REFERENCES
- 1.Boehm AB, Grant SB, Kim JH, Mowbray SL, McGee CD, Clark CD, Foley DM, Wellman DE. 2002. Decadal and shorter period variability of surf zone water quality at Huntington Beach, California. Environ Sci Technol 36:1–14. doi: 10.1021/es020524u. [DOI] [PubMed] [Google Scholar]
- 2.Boehm AB, Yamahara KM, Love DC, Peterson BM, McNeill K, Nelson KL. 2009. Covariation and photoinactivation of traditional and novel indicator organisms and human viruses at a sewage-impacted marine beach. Environ Sci Technol 43:8046–8052. doi: 10.1021/es9015124. [DOI] [PubMed] [Google Scholar]
- 3.Boehm AB, Soetjipto C, Wang D. 2012. Solar inactivation of four Salmonella serovars in fresh and marine waters. J Water Health 10:504–510. doi: 10.2166/wh.2012.084. [DOI] [PubMed] [Google Scholar]
- 4.Maraccini PA, Ferguson DM, Boehm AB. 2012. Diurnal variation in Enterococcus species composition in polluted ocean water and a potential role for the enterococcal carotenoid in protection against photoinactivation. Appl Environ Microbiol 78:305–310. doi: 10.1128/AEM.06821-11. [DOI] [PMC free article] [PubMed] [Google Scholar]
- 5.Maraccini PA, Mattioli MCM, Sassoubre LM, Cao Y, Griffith JF, Ervin JS, Van De Werfhorst LC, Boehm AB. 2016. Solar inactivation of enterococci and Escherichia coli in natural waters: effect of water absorbance and depth. Environ Sci Technol 50:5068–5076. doi: 10.1021/acs.est.6b00505. [DOI] [PubMed] [Google Scholar]
- 6.Sassoubre LM, Nelson KL, Boehm AB. 2012. Mechanisms for photoinactivation of Enterococcus faecalis in seawater. Appl Environ Microbiol 78:7776–7785. doi: 10.1128/AEM.02375-12. [DOI] [PMC free article] [PubMed] [Google Scholar]
- 7.Sassoubre LM, Ramsey MM, Gilmore MS, Boehm AB. 2014. Transcriptional response of Enterococcus faecalis to sunlight. J Photochem Photobiol B Biol 130:349–356. doi: 10.1016/j.jphotobiol.2013.12.013. [DOI] [PubMed] [Google Scholar]
- 8.Berney M, Weilenmann H, Ihssen J, Bassin C, Egli T. 2006. Specific growth rate determines the sensitivity of Escherichia coli to thermal, UVA, and solar disinfection. Appl Environ Microbiol 72:2586–2593. doi: 10.1128/AEM.72.4.2586-2593.2006. [DOI] [PMC free article] [PubMed] [Google Scholar]
- 9.Berney M, Weilenmann HU, Egli T. 2006. Gene expression of Escherichia coli in continuous culture during adaptation to artificial sunlight. Environ Microbiol 8:1635–1647. doi: 10.1111/j.1462-2920.2006.01057.x. [DOI] [PubMed] [Google Scholar]
- 10.Bosshard F, Bucheli M, Meur Y, Egli T. 2010. The respiratory chain is the cell's Achilles' heel during UVA inactivation in Escherichia coli. Microbiology 156:2006–2015. doi: 10.1099/mic.0.038471-0. [DOI] [PubMed] [Google Scholar]
- 11.McGuigan KG, Conroy RM, Mosler HJ, du Preez M, Ubomba-Jaswa E, Fernandez-Ibañez P. 2012. Solar water disinfection (SODIS): a review from bench-top to roof-top. J Hazard Mater 235-236:29–46. [DOI] [PubMed] [Google Scholar]
- 12.Jori G, Brown SB. 2004. Photosensitized inactivation of microorganisms. Photochem Photobiol Sci 3:403–405. doi: 10.1039/b311904c. [DOI] [PubMed] [Google Scholar]
- 13.Ferro S, Ricchelli F, Monti D, Mancini G, Jori G. 2007. Efficient photoinactivation of methicillin-resistant Staphylococcus aureus by a novel porphyrin incorporated into a poly-cationic liposome. Int J Biochem Cell Biol 39:1026–1034. doi: 10.1016/j.biocel.2007.02.001. [DOI] [PubMed] [Google Scholar]
- 14.Khlebtsov BN, Tuchina ES, Khanadeev VA, Panfilova EV, Petrov PO, Tuchin VV, Khlebtsov NG. 2013. Enhanced photoinactivation of Staphylococcus aureus with nanocomposites containing plasmonic particles and hematoporphyrin. J Biophotonics 6:338–351. doi: 10.1002/jbio.201200079. [DOI] [PubMed] [Google Scholar]
- 15.Sabbahi S, Alouini Z, Jemli M, Boudabbous A. 2008. The role of reactive oxygen species in Staphylococcus aureus photoinactivation by methylene blue. Water Sci Technol 58:1047–1054. doi: 10.2166/wst.2008.471. [DOI] [PubMed] [Google Scholar]
- 16.Sinton LW, Hall CH, Lynch PA, Davies-Colley RJ. 2002. Sunlight inactivation of fecal indicator bacteria and bacteriophages from waste stabilization pond effluent in fresh and saline waters. Appl Environ Microbiol 68:1122–1131. doi: 10.1128/AEM.68.3.1122-1131.2002. [DOI] [PMC free article] [PubMed] [Google Scholar]
- 17.Curtis TP, Mara DD, Silva SA. 1992. Influence of pH, oxygen, and humic substances on ability of sunlight to damage fecal coliforms in waste stabilization pond water. Appl Environ Microbiol 58:1335–1343. [DOI] [PMC free article] [PubMed] [Google Scholar]
- 18.Nguyen MT, Jasper JT, Boehm AB, Nelson KL. 2015. Sunlight inactivation of fecal indicator bacteria in open-water unit process treatment wetlands: modeling endogenous and exogenous inactivation rates. Water Res 83:282–292. doi: 10.1016/j.watres.2015.06.043. [DOI] [PubMed] [Google Scholar]
- 19.Davies-Colley RJ, Donnison AM, Speed DJ, Ross CM, Nagels JW. 1999. Inactivation of faecal indicator micro-organisms in waste stabilisation ponds: interactions of environmental factors with sunlight. Water Res 33:1220–1230. doi: 10.1016/S0043-1354(98)00321-2. [DOI] [Google Scholar]
- 20.Sinton LW, Davies-Colley RJ, Bell RG. 1994. Inactivation of enterococci and fecal coliforms from sewage and meatworks effluents in seawater chambers. Appl Environ Microbiol 60:2040–2048. [DOI] [PMC free article] [PubMed] [Google Scholar]
- 21.Sinha RP, Häder D-P. 2002. UV-induced DNA damage and repair: a review. Photochem Photobiol Sci 1:225–236. doi: 10.1039/b201230h. [DOI] [PubMed] [Google Scholar]
- 22.Silverman AI, Nelson KL. 2016. Modeling the endogenous sunlight inactivation rates of laboratory strain and wastewater E. coli and enterococci using biological weighting functions. Environ Sci Technol 50:12292–12301. doi: 10.1021/acs.est.6b03721. [DOI] [PubMed] [Google Scholar]
- 23.Fisher MB, Iriarte M, Nelson KL. 2012. Solar water disinfection (SODIS) of Escherichia coli, Enterococcus spp, and MS2 coliphage: effects of additives and alternative container materials. Water Res 46:1745–1754. doi: 10.1016/j.watres.2011.12.048. [DOI] [PubMed] [Google Scholar]
- 24.Probst-Rud S, McNeill K, Ackermann M. 2017. Thiouridine residues in tRNAs are responsible for a synergistic effect of UVA and UVB light in photoinactivation of Escherichia coli. Environ Microbiol 19:434–442. doi: 10.1111/1462-2920.13319. [DOI] [PubMed] [Google Scholar]
- 25.US EPA. 2012. Recreational water quality criteria. US Environmental Protection Agency, Washington, DC. [Google Scholar]
- 26.Al-Jassim N, Mantilla-Calderon D, Wang T, Hong P. 2017. Inactivation of a virulent wastewater Escherichia coli and non-virulent commensal Escherichia coli DSM1103 strains and their gene expression upon solar irradiation. Environ Sci Technol 51:3649–3659. doi: 10.1021/acs.est.6b05377. [DOI] [PubMed] [Google Scholar]
- 27.Maraccini PA, Wenk J, Boehm AB. 2016. Photoinactivation of eight health-relevant bacterial species: determining the importance of the exogenous indirect mechanism. Environ Sci Technol 50:5050–5059. doi: 10.1021/acs.est.6b00074. [DOI] [PubMed] [Google Scholar]
- 28.Boyle M, Sichel C, Fernández-Ibáñez P, Arias-Quiroz GB, Iriarte-Puña M, Mercado A, Ubomba-Jaswa E, McGuigan KG. 2008. Bactericidal effect of solar water disinfection under real sunlight conditions. Appl Environ Microbiol 74:2997–3001. doi: 10.1128/AEM.02415-07. [DOI] [PMC free article] [PubMed] [Google Scholar]
- 29.Bosshard F, Riedel K, Schneider T, Geiser C, Bucheli M, Egli T. 2010. Protein oxidation and aggregation in UVA-irradiated Escherichia coli cells as signs of accelerated cellular senescence. Environ Microbiol 12:2931–2945. doi: 10.1111/j.1462-2920.2010.02268.x. [DOI] [PubMed] [Google Scholar]
- 30.Lowy FD. 1998. Staphylococcus aureus infections. N Engl J Med 339:520–532. doi: 10.1056/NEJM199808203390806. [DOI] [PubMed] [Google Scholar]
- 31.David MZ, Daum RS. 2010. Community-associated methicillin-resistant Staphylococcus aureus: epidemiology and clinical consequences of an emerging epidemic. Clin Microbiol Rev 23:616–687. doi: 10.1128/CMR.00081-09. [DOI] [PMC free article] [PubMed] [Google Scholar]
- 32.Charoenca N, Fujioka RS. 1993. Assessment of Staphylococcus bacteria in Hawaii's marine recreational waters. Water Sci Technol 27:283–289. doi: 10.1021/es00039a007. [DOI] [Google Scholar]
- 33.Goodwin KD, McNay M, Cao Y, Ebentier D, Madison M, Griffith JF. 2012. A multi-beach study of Staphylococcus aureus, MRSA, and enterococci in seawater and beach sand. Water Res 46:4195–4207. doi: 10.1016/j.watres.2012.04.001. [DOI] [PubMed] [Google Scholar]
- 34.Hower S, Phillips MC, Brodsky M, Dameron A, Tamargo MA, Salazar NC, Jackson CR, Barrett JB, Davidson M, Davis J, Mukherjee S, Ewing RY, Gidley ML, Sinigalliano CD, Johns L, Johnson FE III, Adebanjo O, Plano LRW. 2013. Clonally related methicillin-resistant Staphylococcus aureus isolated from short-finned pilot whales (Globicephala macrorhynchus), human volunteers, and a bayfront cetacean rehabilitation facility. Microb Ecol 65:1024–1038. doi: 10.1007/s00248-013-0178-3. [DOI] [PubMed] [Google Scholar]
- 35.Levin-Edens E, Soge OO, No D, Stiffarm A, Meschke JS, Roberts MC. 2012. Methicillin-resistant Staphylococcus aureus from Northwest marine and freshwater recreational beaches. FEMS Microbiol Ecol 79:412–420. doi: 10.1111/j.1574-6941.2011.01229.x. [DOI] [PMC free article] [PubMed] [Google Scholar]
- 36.Plano LRW, Shibata T, Garza AC, Kish J, Fleisher JM, Sinigalliano CD, Gidley ML, Withum K, Elmir SM, Hower S, Jackson CR, Barrett JB, Cleary T, Davidson M, Davis J, Mukherjee S, Fleming LE, Solo-Gabriele HM. 2013. Human-associated methicillin-resistant Staphylococcus aureus from a subtropical recreational marine beach. Microb Ecol 65:1039–1051. doi: 10.1007/s00248-013-0216-1. [DOI] [PubMed] [Google Scholar]
- 37.Charoenca N, Fujioka RS. 1995. Association of staphylococcal skin infections and swimming. Water Sci Technol 31:11–17. [Google Scholar]
- 38.Wade TJ, Calderon RL, Brenner KP, Sams E, Beach M, Haugland R, Wymer L, Dufour AP. 2008. High sensitivity of children to swimming-associated gastrointestinal illness. Epidemiology 19:375–383. doi: 10.1097/EDE.0b013e318169cc87. [DOI] [PubMed] [Google Scholar]
- 39.Sinigalliano CD, Fleisher JM, Gidley ML, Solo-Gabriele HM, Shibata T, Plano LRW, Elmir SM, Wanless D, Bartkowiak J, Boiteau R, Withum K, Abdelzaher AM, He G, Ortega C, Zhu X, Wright ME, Kish J, Hollenbeck J, Scott T, Backer LC, Fleming LE. 2010. Traditional and molecular analyses for fecal indicator bacteria in non-point source subtropical recreational marine waters. Water Res 44:3763–3772. doi: 10.1016/j.watres.2010.04.026. [DOI] [PMC free article] [PubMed] [Google Scholar]
- 40.Yau V, Wade TJ, de Wilde CK, Colford JM Jr. 2009. Skin-related symptoms following exposure to recreational water: a systematic review and meta-analysis. Water Qual Expo Health 1:79–103. doi: 10.1007/s12403-009-0012-9. [DOI] [Google Scholar]
- 41.Wieland B, Feil C, Gloria-Maercker E, Thumm G, Lechner M, Bravo J-M, Poralla K, Gotz F. 1994. Genetic and biochemical analyses of the biosynthesis of the yellow carotenoid 4,4′-diaponeurosporene of Staphylococcus aureus. J Bacteriol 176:7719–7726. doi: 10.1128/jb.176.24.7719-7726.1994. [DOI] [PMC free article] [PubMed] [Google Scholar]
- 42.Clauditz A, Resch A, Wieland K-P, Peschel A, Götz F. 2006. Staphyloxanthin plays a role in the fitness of Staphylococcus aureus and its ability to cope with oxidative stress. Infect Immun 74:4950–4953. doi: 10.1128/IAI.00204-06. [DOI] [PMC free article] [PubMed] [Google Scholar]
- 43.Lacey RW, Lord VL. 1981. Sensitivity of staphylococci to fatty acids: novel inactivation of linolenic acid by serum. J Med Microbiol 14:41–49. doi: 10.1099/00222615-14-1-41. [DOI] [PubMed] [Google Scholar]
- 44.Beard-Pegler MA, Stubbs E, Vickery AM. 1988. Observations on the resistance to drying of staphylococcal strains. J Med Microbiol 26:251–255. doi: 10.1099/00222615-26-4-251. [DOI] [PubMed] [Google Scholar]
- 45.Andersen CL, Jensen JL, Orntoft TF. 2004. Normalization of real-time quantitative reverse transcription-PCR data: a model-based variance estimation approach to identify genes suited for normalization, applied to bladder and colon cancer data sets. Cancer Res 64:5245–5250. doi: 10.1158/0008-5472.CAN-04-0496. [DOI] [PubMed] [Google Scholar]
- 46.Berney M, Weilenmann HU, Simonetti A, Egli T. 2006. Efficacy of solar disinfection of Escherichia coli, Shigella flexneri, Salmonella typhimurium and Vibrio cholerae. J Appl Microbiol 101:828–836. doi: 10.1111/j.1365-2672.2006.02983.x. [DOI] [PubMed] [Google Scholar]
- 47.Dahl TA, Midden WR, Hartman PE. 1989. Comparison of killing of Gram-negative and Gram-positive bacteria by pure singlet oxygen. J Bacteriol 171:2188–2194. doi: 10.1128/jb.171.4.2188-2194.1989. [DOI] [PMC free article] [PubMed] [Google Scholar]
- 48.Berney M, Hammes F, Bosshard F, Weilenmann HU, Egli T. 2007. Assessment and interpretation of bacterial viability by using the LIVE/DEAD BacLight kit in combination with flow cytometry. Appl Environ Microbiol 73:3283–3290. doi: 10.1128/AEM.02750-06. [DOI] [PMC free article] [PubMed] [Google Scholar]
- 49.Uziel O, Borovok I, Schreiber R, Cohen G, Aharonowitz Y. 2004. Transcriptional regulation of the Staphylococcus aureus thioredoxin and thioredoxin reductase genes in response to oxygen and disulfide stress. J Bacteriol 186:326–334. doi: 10.1128/JB.186.2.326-334.2004. [DOI] [PMC free article] [PubMed] [Google Scholar]
- 50.Utaida S, Dunman PM, Macapagal D, Murphy E, Projan SJ, Singh VK, Jayaswal RK, Wilkinson BJ. 2003. Genome-wide transcriptional profiling of the response of Staphylococcus aureus to cell-wall-active antibiotics reveals a cell-wall-stress stimulon. Microbiology 149:2719–2732. doi: 10.1099/mic.0.26426-0. [DOI] [PubMed] [Google Scholar]
- 51.Mesak LR, Miao V, Davies J. 2008. Effects of subinhibitory concentrations of antibiotics on SOS and DNA repair gene expression in Staphylococcus aureus. Antimicrob Agents Chemother 52:3394–3397. doi: 10.1128/AAC.01599-07. [DOI] [PMC free article] [PubMed] [Google Scholar]
- 52.Bore E, Langsrud S, Langsrud Ø, Rode TM, Holck A. 2007. Acid-shock responses in Staphylococcus aureus investigated by global gene expression analysis. Microbiology 153:2289–2303. doi: 10.1099/mic.0.2007/005942-0. [DOI] [PubMed] [Google Scholar]
- 53.Ezraty B, Aussel L, Barras F. 2005. Methionine sulfoxide reductases in prokaryotes. Biochim Biophys Acta 1703:221–229. doi: 10.1016/j.bbapap.2004.08.017. [DOI] [PubMed] [Google Scholar]
- 54.Singh VK, Moskovitz J. 2003. Multiple methionine sulfoxide reductase genes in Staphylococcus aureus: expression of activity and roles in tolerance of oxidative stress. Microbiology 149:2739–2747. doi: 10.1099/mic.0.26442-0. [DOI] [PubMed] [Google Scholar]
- 55.Singh VK, Jayaswal RK, Wilkinson BJ. 2001. Cell wall-active antibiotic induced proteins of Staphylococcus aureus identified using a proteomic approach. FEMS Microbiol Lett 199:79–84. [DOI] [PubMed] [Google Scholar]
- 56.US EPA. 2002. Method 1600: enterococci in water by membrane filtration using membrane-Enterococcus indoxyl-β-d-glucoside agar (mEI). US Environmental Protection Agency, Washington, DC. [Google Scholar]
- 57.Parker KM, Pignatello JJ, Mitch WA. 2013. Influence of ionic strength on triplet-state natural organic matter loss by energy transfer and electron transfer pathways. Environ Sci Technol 47:10987–10994. doi: 10.1021/es401900j. [DOI] [PubMed] [Google Scholar]
- 58.Dong S, Hong P-Y, Nguyen TH. 2014. Persistence of Bacteroides ovatus under simulated sunlight irradiation. BMC Microbiol 14:178. doi: 10.1186/1471-2180-14-178. [DOI] [PMC free article] [PubMed] [Google Scholar]
- 59.Valihrach L, Demnerova K. 2012. Impact of normalization method on experimental outcome using RT-qPCR in Staphylococcus aureus. J Microbiol Methods 90:214–216. doi: 10.1016/j.mimet.2012.05.008. [DOI] [PubMed] [Google Scholar]
- 60.Cerf O. 1977. Tailing of survival curves of bacterial spores. J Appl Bacteriol 42:1–19. doi: 10.1111/j.1365-2672.1977.tb00665.x. [DOI] [PubMed] [Google Scholar]
- 61.Geeraerd AH, Valdramidis VP, Van Impe JF. 2005. GInaFiT, a freeware tool to assess non-log-linear microbial survivor curves. Int J Food Microbiol 102:95–105. doi: 10.1016/j.ijfoodmicro.2004.11.038. [DOI] [PubMed] [Google Scholar]
- 62.Pfaffl MW. 2001. A new mathematical model for relative quantification in real-time RT-PCR. Nucleic Acids Res 29:2002–2007. doi: 10.1093/nar/29.9.e45. [DOI] [PMC free article] [PubMed] [Google Scholar]
Associated Data
This section collects any data citations, data availability statements, or supplementary materials included in this article.