Abstract
Peroxisome proliferator-activated receptor γ (PPARγ) plays a crucial role in adipocyte differentiation, glucose metabolism, and other physiological processes. To further explore the role of PPARγ in adipose tissues, we used a Cre/loxP strategy to generate adipose-specific PPARγ knockout mice. These animals exhibited marked abnormalities in the formation and function of both brown and white adipose tissues. When fed a high-fat diet, adipose-specific PPARγ knockout mice displayed diminished weight gain despite hyperphagia, had diminished serum concentrations of both leptin and adiponectin, and did not develop glucose intolerance or insulin resistance. Characterization of in vivo glucose dynamics pointed to improved hepatic glucose metabolism as the basis for preventing high-fat diet-induced insulin resistance. Our findings further illustrate the essential role for PPARγ in the development of adipose tissues and suggest that a compensatory induction of hepatic PPARγ may stimulate an increase in glucose disposal by the liver.
Keywords: body weight regulation, diabetes, knockout mouse, Cre recombinase
The peroxisome proliferator-activated receptor (PPAR) subfamily of nuclear receptors controls many different target genes involved in both lipid metabolism and glucose homeostasis (1). By forming heterodimers with the retinoid X receptor, they regulate the transcription of many genes in a ligand-dependent manner (2). PPARγ, a member of this subfamily, is expressed at high levels in white and brown adipose tissue and to a lesser extent in macrophages, colon, kidney, and liver (3), where it plays a major role in many different biological processes including adipogenesis, glucose homeostasis, atherogenesis, inflammation, and tumor susceptibility (4).
PPARγ is activated by endogenous arachidonic acid metabolites such as 15-deoxy-delta 12, 14 prostaglandin J2 (5) and is the target for binding by a class of compounds, termed the thiazolidinediones, that act as insulin sensitizers and are used to treat type 2 diabetes (6). However, it remains unclear precisely how activation of PPARγ leads to an improvement in insulin sensitivity. Loss-of-function PPARγ mutations that have been identified in humans cause insulin resistance suggesting a role for PPARγ in insulin signaling (7). In contrast, individuals carrying the Pro12Ala mutation have greater insulin sensitivity, despite the fact that this mutation decreases receptor activity (8). In addition, heterozygous PPARγ-null mice exhibit greater insulin sensitivity than wild-type littermates and are also protected from the development of insulin resistance mediated by a high-fat diet (HFD) (9, 10).
Efforts to gain a greater understanding of the multiple roles that this receptor plays in both cell development and function in vivo have been limited by the early embryonic lethality of global PPARγ null mice (10, 11). For this reason, we and others have used Cre/loxP strategies to further elucidate the tissue-specific functions of this gene (12, 13). Here we describe studies in which PPARγ was eliminated specifically in adipose tissues of mice (PPARγ adiposeKO). These mice exhibit reduced fat formation, are protected from the development of HFD-induced obesity and insulin resistance, and exhibit a phenotype that is distinct from that of other lipodystropic mice. Thus, PPARγ adiposeKO mice represent a model for lipodystrophy, and their characterization has provided additional insights into physiological roles of this important receptor.
Methods
Generation of PPARγ AdiposeKO Mice. PPARγ adiposeKO mice (aP2-Cre/PPARγlox/lox) were generated by intercrossing mice bearing a conditional PPARγ allele (PPARγlox) (14) with two lines of mice that express Cre under control of the aP2 promoter/enhancer (aP2-Cre) (15). Littermates lacking the aP2-Cre transgene were used as controls. Most analyses used line 1 aP2-Cre mice (15). Line 2 animals, which did not show defects in brown adipose tissue (BAT) formation, also exhibited improved glucose tolerance and resistance to the development of HFD-induced obesity.
Diet Study. Mice were weaned at 25 days of age, fed either a standard rodent chow (Purina) or a high fat, high carbohydrate diet (Diet F3282, Bio-Serv, Frenchtown, NJ) and maintained on a 12-h light/dark cycle. Whole body fat mass was measured by using the Minispec mq10 NMR analyzer (Brucker Optics, Woodlands, TX) as described (16).
Food Intake, Energy Expenditure, and Activity Studies. Food intake was assessed in mice (28-44 weeks old) for 60 h by using an automated apparatus. Energy expenditure (VO2) and activity were measured in 21- to 32-week-old animals by using the Oxymax Deluxe System (Columbus Instruments, Columbus, OH). Mice were acclimated to chambers for 2 h before the experiments and had free access to food and water for the duration of the study. VO2 (mg/kg/h) and activity were measured every 15 min for 22 h.
Histochemistry. Standard methods were used for hematoxylin/eosin or Trichrome Green staining. Oil Red O staining was performed as described (17).
Real-Time PCR Analysis. RNA was extracted by using Trizol (Invitrogen Life Technologies, Carlsbad, CA), analyzed by real-time PCR using SYBR Green (Applied Biosystems), normalized to 18S rRNA, and expressed as fold changes relative to an internal control. Primer sequences are available upon request.
Analytical Procedures. Glucose tolerance tests were performed after a 16-h overnight fast by an i.p. injection of dextrose (1 mg per g of body weight). Blood glucose concentrations were determined with a Hemocue blood glucose analyzer (Mission Viejo, CA). Plasma insulin, leptin, and adiponectin levels were measured by RIA using kits from Linco Research (St. Charles, MO). Plasma triglycerides were measured by using Triglycerides GPO Reagent (Raichem, San Diego).
In Vivo Glucose Kinetics. Euglycemic-hyperinsulinemic clamp studies were performed as described (18). Chronically cannulated, conscious mice (30-45 weeks old) were fasted 16 h before the study. To determine tissue-specific glucose uptake, 20 μCi of [1-14C]2-deoxyglucose was given as a bolus 30 min before the end of the study (1 Ci = 37 GBq). Somatostatin (3 μg/kg/min), glucagon (5 ng/kg/min), and insulin (10 milliunits/kg/min) were infused throughout the clamp study. Glucose was infused at a variable rate to maintain blood glucose levels at 150 mg/dl. At the end of the study, mice were anesthetized, and tissues were quickly removed and frozen in liquid nitrogen. Glucose turnover rate, glycolytic rate, endogenous glucose production, tissue-specific glucose uptake, and hepatic glycogen synthesis were all calculated as described (18-20).
Statistical Analysis. All results are expressed as mean ± standard deviation. Statistical significance was determined by using the paired Student's t test with the following exceptions: food intake, activity, plasma insulin, glucose turnover rate, glycolytic rate, and glucose uptake were analyzed by using the unpaired Student's t test. Hepatic glycogen synthesis was analyzed by the nonparametric Mann-Whitney test.
Results
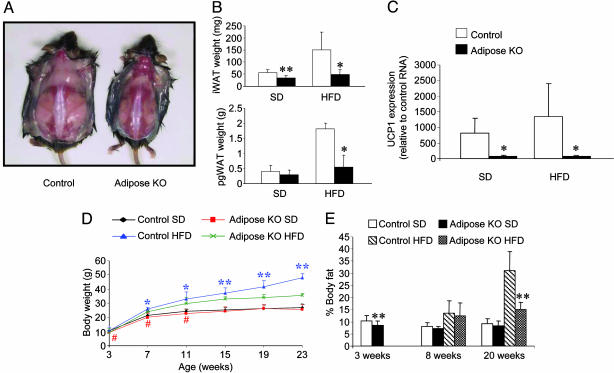
PPARγ AdiposeKO Mice Exhibit Reduced Fat Mass. PPARγ adiposeKO mice, generated by intercrossing animals bearing a conditional PPARγ allele (PPARγlox) (14) with those bearing an aP2-Cre transgene (15), were born at the expected Mendelian frequency but found to lack interscapular BAT (iBAT) and to have a marked reduction in interscapular white adipose tissue (iWAT) (Fig. 1 A and B). The small amount of residual interscapular adipose tissue in the PPARγ adiposeKO mice lacked UCP1 mRNA, a marker for iBAT (Fig. 1C). The iWAT from the PPARγ adiposeKO mice displayed increased fibrosis and vascularization (see Fig. 3D), as did the perigonadal WAT (pgWAT) of these animals (data not shown). Expression of PPARγ mRNA in the WAT of these animals was almost totally ablated by 19 weeks of age (see Fig. 4A). No BAT was observed in this line of mice as early as 4 weeks of age, consistent with PPARγ playing an essential role in the development of this tissue.
Fig. 1.
Adiposity and weight gain in PPARγ adiposeKO mice. (A) Control and PPARγ adiposeKO mice at 22 weeks of age. These mice had been maintained on HFD for 18 weeks. (B) Interscapular (iWAT) and perigonadal (pgWAT) white adipose tissue weights (n = 4-7) at 20 weeks of age; *, P < 0.05; **, P < 0.01. (C) UCP1 expression in interscapular adipose tissue (n = 4). (D) Protection from diet-induced obesity in PPARγ adiposeKO male mice (n = 5-12). Asterisks, significantly greater than adiposeKOs on a HFD; *, P < 0.05; **, P < 0.01. #, Significantly less than controls on a standard diet (SD) (P < 0.05). (E) Total body fat measured by NMR. Data are expressed as a percentage of the body weight. Measurements of 3-week-old mice were made before weaning.
Fig. 3.
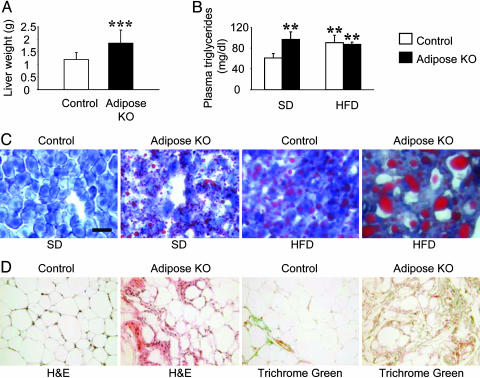
Plasma triglyceride levels and lipid deposition in livers from PPARγ adiposeKO mice. (A) Liver weights of mice on HFD (n = 12). ***, P < 0.001 versus controls. (B) Plasma triglyceride levels (n = 4-5). **, P < 0.01 versus controls on SD. (C) Oil Red O staining of liver sections from control and PPARγ adiposeKO mice. All panels in C are at the same magnification. (Scale bar, 50 μm.) (D) Histology of interscapular WAT in 35-week-old mice on HFD.
Fig. 4.
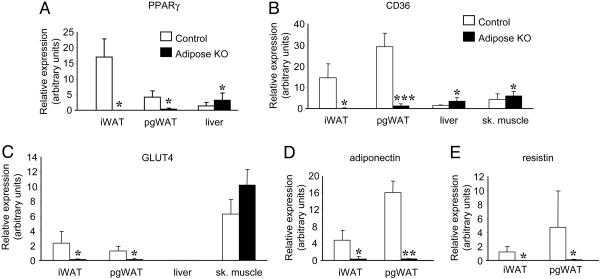
Real-time PCR analyses of tissues from control and PPARγ adiposeKO mice fed HFD. (A) PPARγ expression in interscapular white adipose tissue (iWAT), perigonadal white adipose tissue (pgWAT), and liver (n = 4). (B) CD36 expression was down-regulated in adipose tissues and up-regulated in liver and skeletal muscle (sk. muscle) of PPARγ adiposeKO mice compared with controls (n = 4-5). (C) Glut4 levels (n = 4-5). (D) Adiponectin expression (n = 4). (E) Resistin expression (n = 5-6). For all experiments, gene expression levels were normalized to 18S levels. *, P < 0.05; **, P < 0.01; ***, P < 0.001 versus controls.
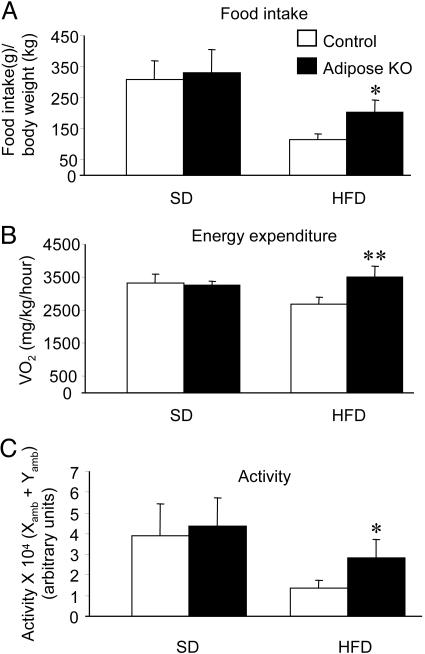
PPARγ AdiposeKO Mice Are Protected from HFD-Induced Obesity. To investigate the effects of diminished PPARγ in WAT on both lipid storage and diet-induced insulin resistance, mice were placed on either a standard diet (SD) or HFD. PPARγ adiposeKO mice had less iWAT and pgWAT than controls when fed a HFD (Fig. 1B). In the lean (SD) group, male PPARγ adiposeKO mice initially weighed less than littermate controls, but this difference disappeared by 15 weeks of age (Fig. 1D). In the obese (HFD) group, male adiposeKO mice gained less weight than controls (Fig. 1D). The decrease in weight gain on HFD was similar for female PPARγ adiposeKOs, but did not become significant until the mice were 19 weeks of age (data not shown). NMR measurements showed that, before weaning, PPARγ adiposeKOs had less total body fat than controls (Fig. 1E). PPARγ adiposeKOs maintained on a HFD for 20 weeks exhibited a significant reduction in body fat compared to littermate controls. Analysis of food intake showed no differences among the groups on SD, although PPARγ adiposeKOs on the HFD were hyperphagic compared to control littermates (Fig. 2A). However, both oxygen consumption (Fig. 2B) and activity (Fig. 2C) were increased in PPARγ adiposeKO mice receiving HFD, suggesting that loss of PPARγ expression in adipose tissues may suppress the hypoactivity normally seen in diet-induced obesity (21).
Fig. 2.
Food intake, energy expenditure, and activity in PPARγ adiposeKO and control mice. (A) Total food intake during a 60-h period. Values are expressed as grams of food per gram of body weight (n = 3-4). (B) Energy expenditure in PPARγ adiposeKO and control mice. Energy expenditure is expressed as average VO2 per kg of body weight per h during a 22-h monitoring session (n = 4). (C) Activity during a 22-h period. Activity is expressed as the average number of times a mouse crosses both x and y axes at least twice (n = 4). *, P < 0.05; **, P < 0.01 versus controls.
Lipid Deposition Is Altered in PPARγ AdiposeKO Mice. Although the total body weights of PPARγ adiposeKO mice on the HFD were less than that of controls, both male and female PPARγ adiposeKO mice exhibited a 1.5-fold increase in liver weight (Fig. 3A). Oil Red O staining of liver sections from PPARγ adiposeKO mice on the HFD showed a marked increase in lipid deposition compared to controls, and a higher level of staining was also observed in livers of PPARγ adiposeKO mice fed the SD (Fig. 3C). In addition, Oil Red O staining of skeletal muscle revealed lipid deposition in sections taken from PPARγ adiposeKO mice on HFD (data not shown). Plasma triglycerides were increased in adiposeKO mice on the SD to a level similar to that for both control and adiposeKO mice on the HFD (Fig. 3B). Thus, the loss of WAT mass in these mice leads to increased plasma triglyceride levels and subsequent lipid deposition in liver and skeletal muscle. Coincident with this, PPARγ gene expression was up-regulated in the liver (Fig. 4A).
PPARγ Target Gene Expression Is Altered in AdiposeKO Mice. To determine the molecular consequences of PPARγ deletion, we measured the expression of both CD36 and Glut4, two genes regulated by PPARγ (22, 23). CD36 was not detected in iWAT and was expressed at very low levels in pgWAT taken from PPARγ adiposeKO mice on HFD (Fig. 4B), but was up-regulated in both liver and skeletal muscle. Expression of Glut4 was also decreased in adipose tissues of PPARγ adiposeKO mice (Fig. 4C). These data suggest that the loss of PPARγ gene expression in fat likely impairs the expression of all genes that are regulated by this receptor, thereby inducing a marked lipodystrophy because the genes that require PPARγ for expression often play essential roles in both glucose and fatty acid uptake and metabolism (24-26).
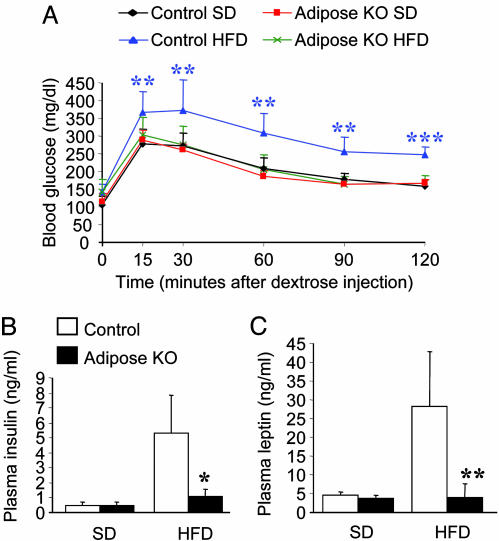
Metabolic Consequences of Adipose-Specific PPARγ Deletion. To assess the effect of the lack of PPARγ in adipose tissues on glucose homeostasis, we first performed i.p. glucose tolerance tests on animals fed either a standard or HFD. Fasting blood glucose levels were similar between the controls and adiposeKOs (SD: 107 ± 24 mg/dl, control and 113 ± 25 mg/dl, adiposeKO; HFD: 141 ± 23 mg/dl, control and 140 ± 36 mg/dl, adiposeKO). Whereas the obese control animals exhibited sustained hyperglycemia after the glucose bolus, the PPARγ adiposeKO mice on the HFD exhibited blood glucose concentrations that were indistinguishable from those of lean controls (Fig. 5A). Plasma insulin levels were also lower in PPARγ adiposeKO mice fed HFD (Fig. 5B), consistent with near normal insulin sensitivity in these animals.
Fig. 5.
Measures of glucose homeostasis in control and PPARγ adiposeKO mice. (A) Glucose tolerance tests. PPARγ adiposeKO mice on HFD show increased glucose tolerance compared to controls on HFD (n = 6). (B) Fasting plasma insulin levels (n = 4-6). (C) Fasting plasma leptin concentrations (n = 5-6). *, P < 0.05; **, P < 0.01; ***, P < 0.001 (controls on HFD versus adiposeKO mice on HFD).
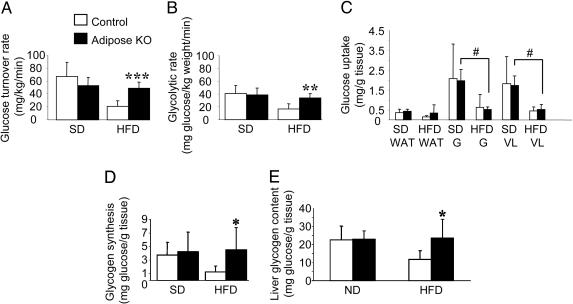
To determine whether the improved glucose tolerance observed in PPARγ adiposeKO mice on HFD was due to increased insulin sensitivity, we measured whole body glucose disposal rates. Whereas the rates were similar between the groups on SD (Fig. 6A), when fed a HFD the PPARγ adiposeKO mice exhibited glucose disposal rates that were much greater than the controls, but similar to the glucose disposal rates observed for mice fed the SD. Moreover, whereas the whole body glycolytic rate was significantly reduced in control mice on HFD (Fig. 6B), the glycolytic rate of PPARγ adiposeKOs on HFD was comparable to that of mice on the SD. Interestingly, despite improved whole body glucose uptake, the PPARγ adiposeKO mice on the HFD had a marked reduction in glucose uptake in skeletal muscle, similar to that of the insulin resistant controls (Fig. 6C). Mice in all groups were able to completely suppress hepatic glucose production during hyperinsulinemia (data not shown). However, hepatic glycogen synthesis via the direct pathway, which serves as an index of hepatic glucose disposal, was increased in adiposeKO mice fed a HFD (Fig. 6D). Total hepatic glycogen content was also increased in these animals (Fig. 6E). When considered in light of the 1.5-fold increase in liver weight in the PPARγ adiposeKO mice on HFD, the increase in glycogen synthesis, if normalized to total liver mass, would be even more pronounced than Fig. 6D suggests. Taken together, the results from the euglycemic-hyperinsulinemic clamp studies show that although the PPARγ adiposeKO mice develop impaired glucose transport in skeletal muscle when placed on a HFD, they are protected from the development of whole body insulin resistance by an increase in hepatic glucose metabolism, further demonstrating an essential role for the liver for maintaining glucose homeostasis (27).
Fig. 6.
Effects of hyperinsulinemia on glucose utilization during euglycemic-hyperinsulinemic clamp studies. (A) Glucose turnover rate represents the average whole body glucose disposal rate during the last 60 min of the clamp (n = 4-6). (B) Whole body glycolytic rate during clamp study (n = 3-6). (C) Insulin-stimulated glucose uptake by individual tissues: perigonadal white adipose tissue (WAT), gastrocnemius (G), and vastus lateralis (VL) in mice fed a SD or HFD (n = 4-6). #, Significantly less than adiposeKO on SD (P < 0.05). (D) Hepatic glycogen synthesis from glucose via the direct pathway (n = 4-6). (E) Hepatic glycogen content (n = 4-5). *, P < 0.05; **, P < 0.01; ***, P < 0.001 versus controls.
Adiponectin and resistin are thought to regulate insulin sensitivity in a reciprocal manner (28, 29). Measurement of adiponectin gene expression showed that it was decreased in both iWAT and pgWAT of PPARγ adiposeKO mice on HFD (Fig. 4D) compared to controls. Plasma levels of adiponectin were also reduced in PPARγ adiposeKO mice on HFD compared to controls (P < 0.05, data not shown). Interestingly, adiponectin gene expression was increased in livers from PPARγ adiposeKO mice on HFD, although expression was ≈1,000-fold less than in adipose tissue (P < 0.05, data not shown). On the other hand, resistin gene expression was down-regulated in both iWAT and pgWAT taken from PPARγ adiposeKOs on HFD (Fig. 4E), consistent with this fat-derived hormone contributing to the improved insulin sensitivity in the knockout animals.
Previous studies of PPARγ heterozygous null mice have suggested that increased plasma leptin levels play a key role in protecting these animals from obesity and insulin resistance induced by high-fat feeding (10, 30). However, unlike the global heterozygous PPARγ-deficient mice that have both increased plasma leptin concentrations and improved leptin sensitivity, PPARγ adiposeKO mice on a HFD exhibited a >10-fold reduction in plasma leptin (Fig. 5C). Because PPARγ is thought to repress leptin gene transcription (31, 32), the reduction in plasma leptin concentration in PPARγ adiposeKO mice most likely results from a decrease in WAT mass and not from diminished PPARγ expression.
Discussion
Mice lacking PPARγ specifically in adipose tissues exhibited marked abnormalities in both the formation and function of brown and white adipose tissues, as would be expected from previous studies of PPARγ global KO mice (10, 11). The preservation of glucose tolerance and insulin sensitivity in animals on the HFD did not appear linked to the loss of BAT because studies of a second line of PPARγ adiposeKO mice, which still had interscapular BAT, also exhibited normal glucose tolerance in response to high-fat feeding (data not shown). Although it was not possible to control for the weight differences between the PPARγ adiposeKO and control mice, other lipoatrophic models exhibit pronounced insulin resistance (33). Thus, the protection against HFD-induced insulin resistance observed in PPARγ adiposeKO mice does not appear to be due simply to reduction of white fat.
The phenotype of PPARγ adiposeKO mice is less severe than that of PPARγ hypomorph mice (34). This finding is understandable because the latter model, which exhibits severe lipodystrophy and premature lethality, has virtually no WAT. Indeed, the marked differences in the amount of WAT in these two models, likely brought on by the different deletional strategies used, may provide useful insights into the essential functions of PPARγ at different developmental stages. In the hypomorphs, PPARγ2 is eliminated before adipose development so adipose tissue is never formed. In contrast, because aP2 gene expression does not peak until the adipocyte is mature, PPARγ is likely deleted at a later developmental stage in the PPARγ adiposeKO mice. Studies in which PPARγ was selectively ablated in mature adipocytes by using a tamoxifen-inducible recombination system (35) provide further support for the notion that the timing of recombination is a vital factor in determining the total adipose mass, because the reduction in adipose tissue weight was not as severe in these animals as in other models.
The phenotypic differences between our adiposeKO mice and another aP2-Cre-mediated PPARγ knockout model are more surprising (36). Fat PPARγ-deficient (FKOγ) mice (36) are similar to our model with respect to increased triglycerides, decreased plasma leptin and adiponectin, hepatic steatosis, comparable systemic insulin sensitivity on SD, and reduced weight gain on HFD. However, when challenged with a HFD, the FKOγ mice become hyperinsulinemic and exhibit insulin resistance in both fat and liver but not in muscle. In contrast, when fed a HFD, the PPARγ adiposeKOs exhibited diminished glucose uptake in muscle, which suggests insulin resistance in that tissue, but increased glucose utilization in liver, thereby causing an overall improvement in systemic insulin sensitivity. Although the conditional PPARγ alleles in these animals were very similar, different aP2-Cre transgenes were used. Thus, the phenotypic discrepancies between the two models may simply reflect differences in recombination timing and/or efficiency. Studies that directly compare the FKOγ and PPARγ adiposeKO models may be necessary to be able to understand the basis of the different metabolic phenotypes.
The impaired function of WAT in the PPARγ adiposeKO mice leads to an increase in the uptake of lipid into both the liver and skeletal muscle. However, despite an increase in lipid storage by these tissues, PPARγ adiposeKO mice are protected from developing HFD-induced obesity and insulin resistance. Our findings suggest that several mechanisms may be involved. First, the loss of PPARγ expression in WAT leads to increased activity and energy expenditure in mice on HFD. Whether this results from a direct effect on energy metabolism, or is simply the consequence of reduced body fat, remains uncertain, although the hyperphagia of these mice is more consistent with the former possibility. Second, loss of PPARγ expression in adipose tissues leads to an increase in both hepatic PPARγ and CD36 gene expression. Although both the mechanisms for, and effects of, the induced hepatic PPARγ gene expression remain to be explored, we suggest that the induction of PPARγ may be the trigger that leads subsequently to the rise of CD36 in the liver and both CD36 and Glut4 in muscle.
The marked decrease of adiponectin expression in WAT, as well as the lower plasma concentrations of this protein in the PPARγ adiposeKO mice, suggests that adiponectin produced by fat cannot account for the improved insulin sensitivity. However, it is possible that the increase in hepatic adiponectin gene expression may contribute to improved glucose metabolism in the liver via a paracrine or autocrine mechanism, although the adiponectin expression in liver is much lower than that found in WAT. Similarly, it remains to be determined whether the markedly diminished adipocyte resistin expression that was observed in the PPARγ adiposeKOs might contribute to an improvement in hepatic glucose utilization.
The improved insulin sensitivity in the PPARγ adiposeKO mice on a HFD coincides with an increase in hepatic PPARγ mRNA. Thus, the induction of hepatic PPARγ in response to the lack of this molecule in adipose tissues may play an important role in protecting these mice from HFD-induced insulin resistance, although the possibility that other unidentified proteins secreted by fat might be acting to impair the ability of insulin to regulate metabolism in liver and muscle cannot be ruled out (37). Recently, Matsusue et al. (38) have shown that the absence of hepatic PPARγ in leptin-deficient mice aggravates the diabetic phenotype, whereas it diminishes hepatic steatosis. Similarly, Gavrilova et al. (12) have also shown that the liver is the primary site of thiazolidinedione (TZD) action in lipoatrophic mice, because inactivation of hepatic PPARγ abolishes the hypoglycemic and hypolipidemic effects of TZD treatment. In addition, functional PPAR response elements have been identified in the promoters of GLUT2 and glucokinase in the liver. Given that modulation of these genes in liver has been shown to directly affect both glycolysis and glycogen synthesis (39, 40), it is very plausible to suggest that the increased hepatic PPARγ expression observed in the PPARγ adiposeKO mice may responsible for the improved insulin sensitivity that we have described.
Acknowledgments
We thank Carlo Malabanan and Jamie Yates in the Vanderbilt Mouse Metabolic Phenotyping Center for performing the energy expenditure and activity studies and for assisting with the glucose tolerance tests; Susan Hipkens and Kathy Shelton for assistance with mouse husbandry and genotyping; Chiyo Shiota for helpful advice; Wanda Snead for performing the leptin assays; Wendell Nicholson (Vanderbilt University) for the insulin and adiponectin RIAs; Carla Harris for plasma triglyceride analyses; Sam Wells for help with imaging; and Lillian Nanney for the histochemical stainings. This work was supported by National Institutes of Health Grants DK42502 and DK42612 (to M.A.M.) and DK43051 and DK60839 (to B.B.K.).
Author contributions: J.R.J., M.S., R.A.K., and M.A.M. designed research; J.R.J., C.B., K.-A.K., J.L., B.B., Y.F., M.S., and R.A.K. performed research; B.B.K. contributed new reagents/analytic tools; J.R.J., J.L., M.S., R.A.K., and M.A.M. analyzed data; and J.R.J. and M.A.M. wrote the paper.
This paper was submitted directly (Track II) to the PNAS office.
Abbreviations: PPAR, peroxisome proliferator-activated receptor; PPARγ adiposeKO, adipose-specific PPARγ knockout; HFD, high-fat diet; SD, standard diet; BAT, brown adipose tissue; WAT, white adipose tissue; iWAT, interscapular WAT; pgWAT, perigonadal WAT.
References
- 1.Wahli, W., Braissant, O. & Desvergne, B. (1995) Chem. Biol. 2, 261-266. [DOI] [PubMed] [Google Scholar]
- 2.Kliewer, S. A., Umesono, K., Noonan, D. J., Heyman, R. A. & Evans, R. M. (1992) Nature 358, 771-774. [DOI] [PMC free article] [PubMed] [Google Scholar]
- 3.Fajas, L., Auboeuf, D., Raspe, E., Schoonjans, K., Lefebvre, A. M., Saladin, R., Najib, J., Laville, M., Fruchart, J.-C., Deeb, S., et al. (1997) J. Biol. Chem. 272, 18779-18789. [DOI] [PubMed] [Google Scholar]
- 4.Braissant, O., Foufelle, F., Scotto, C., Dauca, M. & Wahli, W. (1996) Endocrinology 137, 354-366. [DOI] [PubMed] [Google Scholar]
- 5.Forman, B. M., Tontonoz, P., Chen, J., Brun, R. P., Spiegelman, B. M. & Evans, R. M. (1995) Cell 83, 803-812. [DOI] [PubMed] [Google Scholar]
- 6.Lehmann, J. M., Moore, L. B., Smith-Oliver, T. A., Wilkison, W. O., Willson, T. M. & Kliewer, S. A. (1995) J. Biol. Chem. 270, 12953-12956. [DOI] [PubMed] [Google Scholar]
- 7.Barroso, I., Gurnell, M., Crowley, V. E., Agostini, M., Schwabe, J. W., Soos, M. A., Maslen, G. L., Williams, T. D., Lewis, H., Schafer, A. J., et al. (1999) Nature 402, 880-883. [DOI] [PubMed] [Google Scholar]
- 8.Deeb, S., Fajas, L., Nemoto, M., Laakso, M., Fujimoto, W. & Auwerx, J. (1998) Nat. Genet. 20, 284-287. [DOI] [PubMed] [Google Scholar]
- 9.Miles, P. D., Barak, Y., He, W., Evans, R. M. & Olefsky, J. M. (2000) J. Clin. Invest. 105, 287-292. [DOI] [PMC free article] [PubMed] [Google Scholar]
- 10.Kubota, N., Terauchi, Y., Miki, H., Tamemoto, H., Yamauchi, T., Komeda, K., Satoh, S., Nakano, R., Ishii, C., Sugiyama, T., et al. (1999) Mol. Cell 4, 597-609. [DOI] [PubMed] [Google Scholar]
- 11.Barak, Y., Nelson, M. C., Ong, E. S., Jones, Y. Z., Ruiz-Lozano, P., Chien, K. R., Koder, A. & Evans, R. M. (1999) Mol. Cell 4, 585-595. [DOI] [PubMed] [Google Scholar]
- 12.Gavrilova, O., Haluzik, M., Matsusue, K., Cutson, J. J., Johnson, L., Dietz, K. R., Nicol, C. J., Vinson, C., Gonzalez, F. J. & Reitman, M. L. (2003) J. Biol. Chem. 278, 34268-34276. [DOI] [PubMed] [Google Scholar]
- 13.Rosen, E. D., Kulkarni, R. N., Sarraf, P., Ozcan, U., Okada, T., Hsu, C. H., Eisenman, D., Magnuson, M. A., Gonzalez, F. J., Kahn, C. R. & Spiegelman, B. M. (2003) Mol. Cell. Biol. 23, 7222-7229. [DOI] [PMC free article] [PubMed] [Google Scholar]
- 14.Jones, J. R., Shelton, K. D., Guan, Y., Breyer, M. D. & Magnuson, M. A. (2002) Genesis 32, 134-137. [DOI] [PubMed] [Google Scholar]
- 15.Abel, E. D., Peroni, O., Kim, J. K., Kim, Y. B., Boss, O., Hadro, E., Minnemann, T., Shulman, G. I. & Kahn, B. B. (2001) Nature 409, 729-733. [DOI] [PubMed] [Google Scholar]
- 16.Tinsley, F. C., Taicher, G. Z. & Heiman, M. L. (2004) Obes. Res. 12, 150-160. [DOI] [PubMed] [Google Scholar]
- 17.Carson, F. L. (1997) Histotechnology: A Self-Instructional Text (ASCP Press, Chicago).
- 18.Rossetti, L., Stenbit, A. E., Chen, W., Hu, M., Barzilai, N., Katz, E. B. & Charron, M. J. (1997) J. Clin. Invest. 100, 1831-1839. [DOI] [PMC free article] [PubMed] [Google Scholar]
- 19.Postic, C., Shiota, M., Niswender, K. D., Jetton, T. L., Chen, Y., Moates, J. M., Shelton, K. D., Lindner, J., Cherrington, A. D. & Magnuson, M. A. (1999) J. Biol. Chem. 274, 305-315. [DOI] [PubMed] [Google Scholar]
- 20.Kraegen, E. W., James, D. E., Jenkins, A. B. & Chisholm, D. J. (1985) Am. J. Physiol. 248, E353-E362. [DOI] [PubMed] [Google Scholar]
- 21.Tou, J. C. & Wade, C. E. (2002) Exp. Biol. Med. 227, 587-600. [DOI] [PubMed] [Google Scholar]
- 22.Memon, R. A., Tecott, L. H., Nonogaki, K., Beigneux, A., Moser, A. H., Grunfeld, C. & Feingold, K. R. (2000) Endocrinology 141, 4021-4031. [DOI] [PubMed] [Google Scholar]
- 23.Singh Ahuja, H., Liu, S., Crombie, D. L., Boehm, M., Leibowitz, M. D., Heyman, R. A., Depre, C., Nagy, L., Tontonoz, P. & Davies, P. J. (2001) Mol. Pharmacol. 59, 765-773. [DOI] [PubMed] [Google Scholar]
- 24.Hamm, J. K., el Jack, A. K., Pilch, P. F. & Farmer, S. R. (1999) Ann. N. Y. Acad. Sci. 892, 134-145. [DOI] [PubMed] [Google Scholar]
- 25.Tamori, Y., Masugi, J., Nishino, N. & Kasuga, M. (2002) Diabetes 51, 2045-2055. [DOI] [PubMed] [Google Scholar]
- 26.Nugent, C., Prins, J. B., Whitehead, J. P., Savage, D., Wentworth, J. M., Chatterjee, V. K. & O'Rahilly, S. (2001) Mol. Endocrinol. 15, 1729-1738. [DOI] [PubMed] [Google Scholar]
- 27.Lauro, D., Kido, Y., Castle, A. L., Zarnowski, M. J., Hayashi, H., Ebina, Y. & Accili, D. (1998) Nat. Genet. 20, 294-298. [DOI] [PubMed] [Google Scholar]
- 28.Hotta, K., Funahashi, T., Bodkin, N. L., Ortmeyer, H. K., Arita, Y., Hansen, B. C. & Matsuzawa, Y. (2001) Diabetes 50, 1126-1133. [DOI] [PubMed] [Google Scholar]
- 29.Berg, A. H., Combs, T. P., Du, X., Brownlee, M. & Scherer, P. E. (2001) Nat. Med. 7, 947-953. [DOI] [PubMed] [Google Scholar]
- 30.Yamauchi, T., Kamon, J., Waki, H., Murakami, K., Motojima, K., Komeda, K., Ide, T., Kubota, N., Terauchi, Y., Tobe, K., et al. (2001) J. Biol. Chem. 276, 41245-41254. [DOI] [PubMed] [Google Scholar]
- 31.Kallen, C. B. & Lazar, M. A. (1996) Proc. Natl. Acad. Sci. USA 93, 5793-5796. [DOI] [PMC free article] [PubMed] [Google Scholar]
- 32.Hollenberg, A. N., Susulic, V. S., Madura, J. P., Zhang, B., Moller, D. E., Tontonoz, P., Sarraf, P., Spiegelman, B. M. & Lowell, B. B. (1997) J. Biol. Chem. 272, 5283-5290. [DOI] [PubMed] [Google Scholar]
- 33.Shimomura, I., Hammer, R. E., Richardson, J. A., Ikemoto, S., Bashmakov, Y., Goldstein, J. L. & Brown, M. S. (1998) Genes Dev. 12, 3182-3194. [DOI] [PMC free article] [PubMed] [Google Scholar]
- 34.Koutnikova, H., Cock, T. A., Watanabe, M., Houten, S. M., Champy, M. F., Dierich, A. & Auwerx, J. (2003) Proc. Natl. Acad. Sci. USA 100, 14457-14462. [DOI] [PMC free article] [PubMed] [Google Scholar]
- 35.Imai, T., Takakuwa, R., Marchand, S., Dentz, E., Bornert, J. M., Messaddeq, N., Wendling, O., Mark, M., Desvergne, B., Wahli, W., et al. (2004) Proc. Natl. Acad. Sci. USA 101, 4543-4547. [DOI] [PMC free article] [PubMed] [Google Scholar]
- 36.He, W., Barak, Y., Hevener, A., Olson, P., Liao, D., Le, J., Nelson, M., Ong, E., Olefsky, J. M. & Evans, R. M. (2003) Proc. Natl. Acad. Sci. USA 100, 15712-15717. [DOI] [PMC free article] [PubMed] [Google Scholar]
- 37.Birnbaum, M. J. (2001) Nature 409, 672-673. [DOI] [PubMed] [Google Scholar]
- 38.Matsusue, K., Haluzik, M., Lambert, G., Yim, S. H., Gavrilova, O., Ward, J. M., Brewer, B., Jr., Reitman, M. L. & Gonzalez, F. J. (2003) J. Clin. Invest. 111, 737-747. [DOI] [PMC free article] [PubMed] [Google Scholar]
- 39.Kim, S. Y., Kim, H. I., Park, S. K., Im, S. S., Li, T., Cheon, H. G. & Ahn, Y. H. (2004) Diabetes 53, Suppl. 1, S66-S70. [DOI] [PubMed] [Google Scholar]
- 40.Kim, H. I. & Ahn, Y. H. (2004) Diabetes 53, Suppl. 1, S60-S65. [DOI] [PubMed] [Google Scholar]


