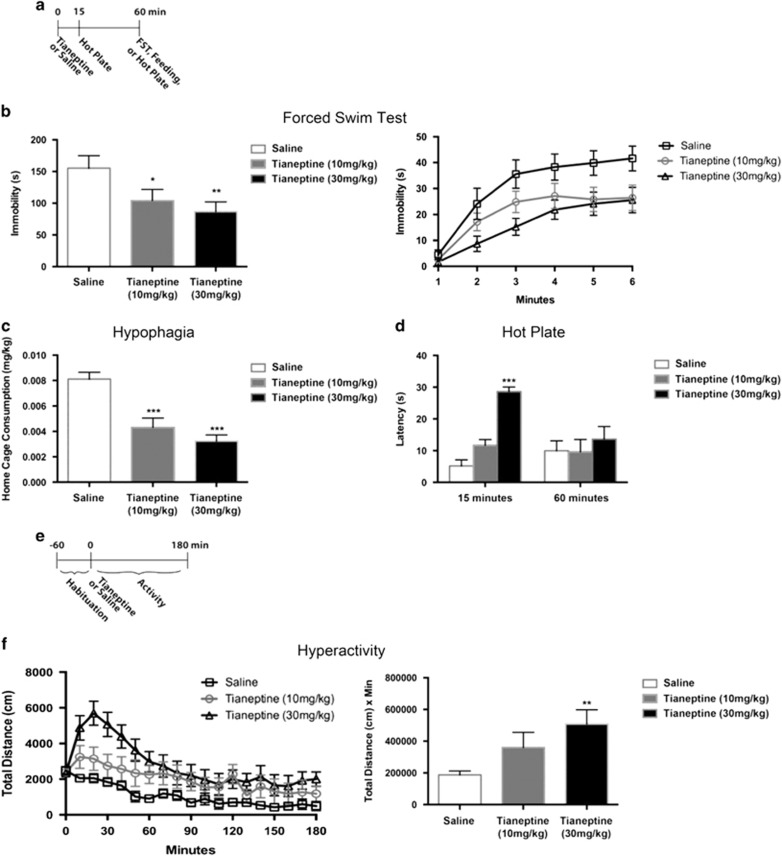
Figure 1.
Dose response of tianeptine behavioral effects. (a) Timeline for (b–d). n=12–14 per group for (b and c) and 5 per group for (d). Tianeptine was administered by i.p. injection at doses of either 10 mg/kg or 30 mg/kg as indicated. (b) FST Day 1 results. Bar graph (left) shows combined immobility results of last four minutes and line graph (right) shows immobility per minute over the 6 min test. Immobility duration over the last 4 min was analyzed. One-way ANOVA: F(2,37)=3.966, p=0.0275. *p=0.0488, relative to saline; **p=0.0095, relative to saline (Fisher’s). (c) Home cage consumption over 5 min after an 18 h deprivation period was assessed as a measure of hypophagia. One-way ANOVA: F(2,37)=17.17, p<0.0001. ***p<0.0001, relative to saline. (d) Latency to jump after being placed on the hot plate was assessed. Two-way ANOVA: F(2,24)=6.063, time × treatment p=0.0074. ***p<0.0001 relative to 15 min/saline. (e) Timeline for (f). n=9–10 per group. Tianeptine was administered by i.p. injection at doses of either 10 mg/kg or 30 mg/kg as indicated. (f) Hyperactivity in an open field. Line graph (left) shows total distance traveled over 180 min (10 minute bins). Bar graph (right) shows AUC analysis of line graph. AUC analysis: one-way ANOVA: F(2,26)=4.601, p=0.0195. **p=0.0055, relative to saline (Fisher’s). Throughout the figure, all bar graphs indicate mean±SEM. For line graphs, each point indicates mean±SEM.

