

Abstract
Critical Assessment of Genome Interpretation “CAGI” is a global community experiment to objectively assess computational methods for predicting phenotypic impacts of genomic variation. One of the 2015–2016 competitions focused on predicting the influence of mutations on the allosteric regulation of human liver pyruvate kinase. More than 30 different researchers accessed the challenge data. However, only four groups accepted the challenge. Features used for predictions ranged from evolutionary constraints, mutant site locations relative to active and effector binding sites, and computational docking outputs. Despite the range of expertise and strategies used by predictors, the best predictions were marginally greater than random for modified allostery resulting from mutations. In contrast, several groups successfully predicted which mutations severely reduced enzymatic activity. Nonetheless, poor predictions of allostery stands in stark contrast to the impression left by more than 700 PubMed entries identified using the identifiers “computational + allosteric”. This contrast highlights a specialized need for new computational tools and utilization of benchmarks that focus on allosteric regulation.
Keywords: CAGI experiment, liver pyruvate kinase, allosteric effect, missense mutation
INTRODUCTION
Blind challenge experiments, such as CASP (Moult, et al., 2016) and CAPRI (Lensink, et al., 2016), have provided independent assessment of computational prediction methods in structural biology. They have spurred the development of new methods and the integration of multiple methods in prediction pipelines. The Critical Assessment of Genome Interpretation (CAGI) experiment seeks to achieve the same goals by providing prediction challenges in a number of different areas. In this report, we describe a challenge involving the effect of mutations on the allosteric coupling of effectors and substrate binding to human liver pyruvate kinase (L-PYK). The focus of this competition was to predict the influence of mutations on the allosteric regulation of L-PYK by a negative regulator, alanine and a positive effector, fructose-1,6-bisphosphate (Fru-1,6-BP). Numerous methods for predicting the effect of mutations on allosteric effector binding have been published in recent years (Collier and Ortiz, 2013; Feher, et al., 2014).
The definition of allostery applicable to studies of L-PYK is the affinity of the enzyme for its substrate, phosphoenolpyruvate (PEP), in the absence versus presence of an allosteric effector, recognizing that the effector binds to a site distinct from the active site (Carlson and Fenton, 2016; Fenton, 2008; Fenton, 2012; Fenton and Alontaga, 2009; Fenton and Hutchinson, 2009; Fenton, et al., 2010; Ishwar, et al., 2015). This definition describes allostery by four enzyme forms that constitute the corners of a thermodynamic energy cycle (Figure 1) and it provides a mechanism to quantify allosteric function in the form of the allosteric coupling constant (Qax) (Fenton, 2012; Reinhart, 1983; Reinhart, 1988; Reinhart, 2004; Weber, 1972):
Figure 1.
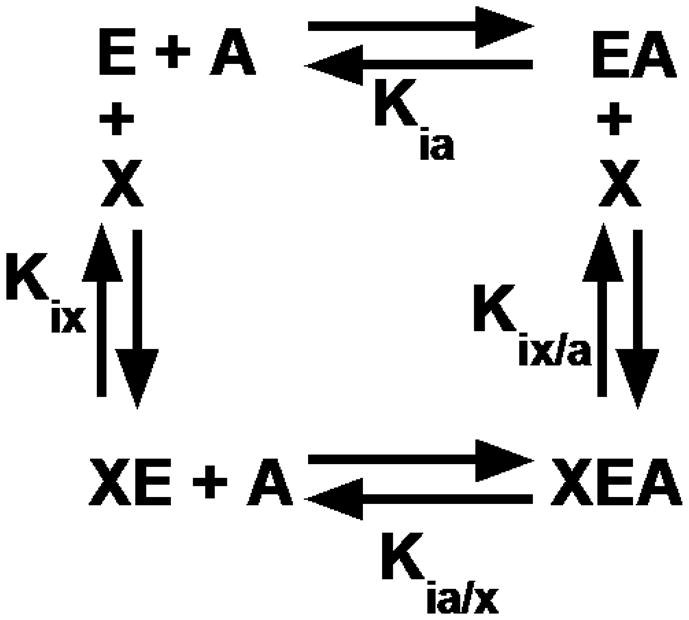
A reaction scheme for an allosteric energy cycle in which an enzyme (E) can bind one substrate (A) and one allosteric effector (X). Kia is the equilibrium dissociation constant of the substrate binding to the enzyme in the absence of effector. Kia/x is the equilibrium dissociation constant of the substrate binding to the enzyme in the presence of saturating concentrations of effector. Kix is the equilibrium dissociation constant of the effector when substrate is absent, while Kix/a is the equilibrium dissociation constant of effector in the presence of saturating concentrations of substrate.
Kia and Kia/x are equilibrium dissociation constants for binding the substrate (A) in the absence or presence respectively of an allosteric effector, X, as defined in Figure 1. Qax = 1 indicates that the system is not allosteric. When Qax >1, there is positive allosteric coupling between the binding of X to a protein and the binding of A to the same protein at distinct sites. When Qax <1, there is a negative or inhibitory coupling between the X and A sites.
The predictors were provided two sets of mutations for predictions of enzyme activity and allosteric effects in L-PYK. Qax was determined for each active mutant protein by determining PEP affinity (via titrations of activity over a concentration range of PEP) over a concentration range of effector. Experiment 1 consisted of 113 mutations at 9 sites in or near to the binding of the negative allosteric regulator, alanine. Participants were asked to predict provide a probability that each mutant enzyme was active (i.e., not the level of activity) and the value of Qax for alanine for each mutant. Experiment 2 consisted of mutations to alanine at 430 sites throughout the protein. Participants were then asked to predict the enzyme activity and Qax values for the effectors alanine and Fru-1,6-BP. Since alanine is a negative regulator, all values of Qax-Ala are between 0 and 1, while the value of Qax for Fru-1,6-BP is unbounded. Predictors were provided with the maximum value (Qax-Fru-1,6-BP =320) found in the alanine-scanning experiment.
METHODS AND MATERIALS
Experimental data generation
Wild-type and mutant human L-PYK were expressed in the E. coli FF50 strain, which lacks endogenous pyk genes, and partially purified using ammonium sulfate fractionation followed by dialysis, as previously described (Fenton and Alontaga, 2009; Ishwar, et al., 2015). L-PYK catalyzes the following reaction:
Activity measurements were performed at 30°C using a lactate dehydrogenase assay to detect the production of pyruvate by L-PYK. Lactate dehydrogenease catalyzes the following reversible reaction:
As the L-PYK reaction proceeds, producing pyruvate, the concentration of NADH decreases, which can be detected by monitoring absorbance at 340 nm (A340). Reaction conditions contained 50 mM HEPES or bicine, 10 mM MgCl2, 2 mM (K)ADP, 0.1 mM EDTA, 0.18 mM NADH, and 19.6 U/mL lactate dehydrogenase. PEP and effector concentrations were varied. The rate of the decrease in A340 due to NADH utilization was recorded at each concentration of PEP and these initial velocity rates as a function of PEP concentration were used to evaluate the apparent affinity for PEP (Kapp-PEP) at any one effector concentration. Kix and Qax for each mutant and the wildtype were obtained by fitting the observed Kapp-PEP to the equation:
where Ka = Kapp-PEP when the concentration of effector [X] = 0.
The dataset represents two experiments, which are characterizations of mutant human L-PYK proteins expressed in E. coli, named Experiment 1 and Experiment 2. Experiment 1 consisted of site-directed mutations at residue positions with a side-chain contacting with alanine or very near the bound alanine. A total of 113 substitutions were introduced at 9 different sites, of which 23 mutant proteins were completely inactive (no measurable enzyme activity). Qax-Ala was determined for the 90 mutant proteins with activity. In experiment 2, 430 residues were mutated into alanine across the entire protein, of which 44 did not have detectable enzyme activity. Allosteric coupling Qax for inhibition by alanine and activation by Fru-1,6-BP were separately determined.
Performance assessment of L-PYK enzyme activity
From the binary experimental enzyme activity data (1=positive=active; 0=negative=inactive), we calculated the number of true positives (TP), false positives (FP), true negatives (TN), and false negatives (FN) for all participating groups in Experiment 1 and Experiment 2. From these, we calculated the true positive rate (TPR), true negative rate (TNR), positive predictive value (PPV), and negative predictive value (NPV):
We also calculated four measures that assess overall accuracy: total accuracy (ACC), balanced accuracy (BACC), Matthews correlation coefficient (MCC) (Matthews, 1975) and F1 score. F1 score is the harmonic mean of precision (PPV) and sensitivity (TPR).
Since some predictors provided real values (between 0 and 1), these were converted into binary predictions as described below in the Results section.
Evaluation of predictions of Qax-Ala and Qax-Fru-1,6-BP
Spearman’s rho (ρ), or Spearman’s rank correlation coefficient, measures the monotonic correlation between prediction and experimental data. ρ = 1 means the predictions and experimental data points have identical rankings. For data set (pi, ei), prediction data points are converted into ranks Rpi, experimental data points are converted into ranks Rei. Then ρ is calculated from the formula:
Kendall’s tau (τ), or Kendall rank correlation coefficient, like Spearman’s rho, measures the rank correlation between two variables. For data set (p, e), any pair of (pi, ei) and (pj, ej), where i ≠ j, are said to be concordant if both pi > pj and ei > ej, or if both pi < pj and ei < ej. They are discordant, if both pi > pj and ei < ej, or if pi < pj and ei > ej. If pi = pj or ei = ej, the pair is neither concordant or discordant. We use C for the set of concordant pairs, and D for the set of discordant pairs. τ is defined as the difference between the number of concordant pairs (|C|) and the number of discordant pairs (|D|), divided by the total number of pair combinations (n * (n − 1)/2). The formula is given as following:
All statistical calculations and kernel density estimates of the data were performed in R (R Core Team, 2015).
RESULTS
In this assessment, four groups (53, 54, 55 and 56, Table 1) submitted a total of 5 prediction sets, of which two are from group 56, labeled 56_1 and 56_2. The methods utilized by each group are provided in the Supplemental Materials as are the instructions and information provided to predictors at the time of the experiment.
Table 1.
Groups participating in L-PYK enzyme activity and allostery prediction challenges
| Group No | Affiliation | Authors |
|---|---|---|
| 53 | Department of Human and Molecular Genetics, Baylor College of Medicine, Houston, Texas, United States | Panagiotis Katsonis, Olivier Lichtarge |
| 54 | Department of Computer Science, University College London, Gower Street, London, WC1E 6BT, United Kingdom | David Jones |
| 55 | Biocomputing Group, CIG/Interdepartmental Center «Luigi Galvani» for Integrated Studies of Bioinformatics, Biophysics and Biocomplexity, University of Bologna, Italy | Samuele Bovo, Giulia Babbi, Pier Luigi Martelli, Rita Casadio |
| 56 | Department of Chemistry, Seoul National University, Gwanak-ro, Gwanak-gu, Seoul 08826, Republic of Korea | Gyu Rie Lee, Chaok Seok |
Human L-PYK is a tetrameric enzyme with distinct binding sites for its reactants, pyruvate and ADP, and its allosteric effectors, alanine and fructose-1,6-bisphosphate. The structure of the tetramer is shown in Figure 2A, where molecules at the three sites are represented as spheres in each monomer. This composite structure was created by superposing monomers from structures containing alanine (PDB: 2G50, a structure of rabbit L-PYK (Williams, et al., 2006)), phosphoenolpyruvate (PDB: 4HYV, Trypanosoma brucei pyruvate kinase (Zhong, et al., 2013)), and ADP (PDB: 3GR4, human pyruvate kinase M2 (Hong et al., unpublished, DOI: 10.2210/pdb3gr4/pdb) onto each member of the tetrameric biological assembly of human L-PYK (PDB: 4IP7 (Holyoak, et al., 2013)). Experiment 1 consisted of 113 mutations spread across 9 amino acid positions in or near the alanine binding site (Figure 2B): Arg55, Ser56, Asn82, Arg118, His476, Val481, Pro483, and Phe514. Experiment 2 consisted of alanine-scanning mutations across the entire protein, excepting wild-type positions that are Gly or Ala. The fructose-1,6-bisphosphate site is shown in Figure 2C.
Figure 2.

Structure of human pyruvate kinase, as well as the binding sites of inhibitor alanine and activator fructose-1,6-bisphosphate. (A) A modeled structure of L-PYK tetramer with substrates PEP and ADP, allosteric inhibitor alanine, and allosteric activator. PEP, ADP, alanine (labeled ALA) and fructose-1,6-bisphosphate (labeled FBP) are shown in spheres, colored in magenta, pink, orange and red respectively. The structure was assembled by superposing monomers from several structures of homologues of L-PYK with PEP, ADP, and alanine bound onto a tetrameric structure of human L-PYK with fructose-1,6-bisphosphate bound (PDB: 4IP7). (B). The allosteric binding site of alanine. Alanine is shown in sticks and colored in orange. Residues that were mutated in experiment 1 are shown in sticks, and colored in pink. (C). The binding site of fructose-1,6-bisphosphate (FBP). FBP is shown in sticks and colored in red. Interacting residues are shown in sticks and colored in blue.
Prediction of L-PYK Enzyme activity
The first challenge was to provide a probability that each enzyme was active. This was a binary outcome, not the level of activity. Even weakly active enzymes were considered active in the experiment. In both experiments, some mutants had no detectable activity, and these were labeled 0; the rest were labeled 1. The active mutants included some enzymes with very low but detectable activity. In experiment 1, 79.6% of mutants were active and 20.4% were inactive. In experiment 2, 88.8% of the mutants were active and 10.2% were inactive. Two of the groups (53 and 54) submitted real values between 0 and 1, instead of binary indicators. For these groups, we labeled all predictions with values ≥0.5 as active and the rest as inactive. Figure 3 shows the density functions of predicted enzyme activities. For experiment 1, two groups (55 and 56_2) predicted all mutants to be active (a value of 1) (Fig. 3, top row). This is not unreasonable since all of the mutations were in or near the alanine effector binding site, which is distant from the active site.
Figure 3.

Kernel density estimates of five sets of predicted L-PYK enzyme activities.
Table 2 provides an assessment of the predictions of enzyme activity for each group for both experiments. We also included values obtained from the PolyPhen2 server, which is commonly used to predict phenotypes of missense mutations (Adzhubei, et al., 2010). Group 56 achieved the highest absolute accuracy (ACC) in both experiments (ACC of 0.867 for Group 56_1 in experiment 1; ACC of 0.894 for Group 56_2 in experiment 2). Since the goal was to predict whether enzymes were active or inactive, rather than the level of activity, this is a successful result. In the case of experiment 1, predicting all mutants as active would result in an accuracy of 0.796, while in experiment 2, a value of 0.888 would be obtained. At least for experiment 1, group 56 achieved better predictions than the simple prediction that all mutants were active.
Table 2.
Binary prediction results of L-PYK enzyme activity. (0 = inactive, 1 = active)
| Experiment 1 | Experiment 2 | |||||||||||
|---|---|---|---|---|---|---|---|---|---|---|---|---|
|
| ||||||||||||
| Method* | Group 53 | Group 54 | Group 55 | Group 56_1 | Group 56_2 | PPH2 | Group 53 | Group 54 | Group 55 | Group 56_1 | Group 56_2 | PPH2 |
| TPR | 0.622 | 0.156 | 1 | 0.944 | 1 | 0.122 | 0.626 | 0.322 | 0.838 | 0.898 | 0.976 | 0.392 |
| TNR | 0.913 | 0.913 | 0 | 0.565 | 0 | 0.957 | 0.864 | 0.932 | 0.205 | 0.318 | 0.182 | 0.953 |
|
| ||||||||||||
| PPV | 0.966 | 0.875 | 0.796 | 0.895 | 0.796 | 0.917 | 0.976 | 0.976 | 0.901 | 0.920 | 0.912 | 0.987 |
| NPV | 0.382 | 0.216 | 0 | 0.722 | 0 | 0.218 | 0.210 | 0.137 | 0.127 | 0.264 | 0.471 | 0.150 |
|
| ||||||||||||
| ACC | 0.681 | 0.310 | 0.796 | 0.867 | 0.796 | 0.292 | 0.650 | 0.385 | 0.772 | 0.838 | 0.894 | 0.449 |
| BACC | 0.768 | 0.534 | 0.5 | 0.755 | 0.5 | 0.539 | 0.745 | 0.627 | 0.521 | 0.608 | 0.579 | 0.673 |
| MCC | 0.431 | 0.079 | 0 | 0.561 | 0 | 0.103 | 0.301 | 0.169 | 0.034 | 0.199 | 0.246 | 0.218 |
| F1 | 0.757 | 0.264 | 0.887 | 0.919 | 0.887 | 0.217 | 0.762 | 0.484 | 0.868 | 0.907 | 0.943 | 0.562 |
The evaluation methods used in table are annotated as follows: TPR: True Positive Rate. FPR: False Positive Rate. TNR: True Negative Rate. PPV: Positive Predictive Value. NPV: Negative Predictive Value. ACC: accuracy. BACC: balanced accuracy. MCC: Matthews Correlation Coefficient. F1: F1 score. The highest score in each row for the four global measures is in bold and underlined.
In most binary phenotype prediction assessments (Wei and Dunbrack Jr, 2013), it is important to balance the success of positive predictions and/or experimental outcomes with negative predictions and/or experimental outcomes. One such measure is the balanced accuracy, BACC, which is the average of the rate of correctly predicting the experimentally active mutants (true positive rate, TPR) and the rate of correctly predicting the experimentally inactive mutants (true negative rate, TNR). For experiment 1, only groups 53 and 56_1 achieve balanced accuracy (BACC) values above 0.5, with BACC = 0.768 and 0.755 respectively. A BACC of 0.50 is trivial to achieve, since if one predicts all of the phenotypes in one class, the BACC is automatically 0.50 (e.g., groups 55 and 56_2 for Experiment 1). Groups 53 and 56_1 achieve their results in contrasting manners: group 53 has low TPR and high TNR, and group 56_1 has high TPR and low TNR. For experiment 2, which contained mutations across the entire protein and is therefore a more real-world prediction task, only group 53 has TPR and TNR > 0.5, resulting in a BACC of 0.745.
Similarly, the MCC and F1 values also balance positive and negative predictions and experimental values but in different ways than BACC (see Methods). F1, in particular, only includes positive predictions and experimental phenotypes and omits negative predictions and phenotypes. Since both data sets consisted of majority of active enzymes (80% and 88% for experiments 1 and 2 respectively), groups which predicted a larger fraction of the enzymes to be active did better in F1 (groups 55, 56_1, 56_2) than the other groups. Group 54 predicted a majority of the mutants to be inactive in both experiments and thus achieved much lower values for F1 than the other groups.
We compared the results of CAGI groups with that of PolyPhen2, a server that is commonly used to predict the phenotypes of missense mutations in proteins. Polyphen2, like other servers, predicts phenotypes to be deleterious or neutral, or “damaging” vs “benign.” This is not necessarily directly associated with enzyme activity, since a deleterious mutation might affect protein expression or the ability to regulate the protein by allosteric mechanisms. Also, the inactive enzymes were only those with no activity, and not those with significant reduction in activity. In experiment 1, Polyphen2 predicted most mutants to be inactive, probably because the alanine binding site is very highly conserved in L-PYK enzymes in order to retain the negative effector capability of alanine. This resulted in a BACC of 0.539. In experiment 2, the mutations were spread across the protein and PolyPhen2 does better, with a BACC of 0.674. Nevertheless, group 53 was able to achieve better results on all four measures of overall success in experiment 2.
As mentioned above, groups 53 and 54 provide real values (not binary values) for the enzyme activity. We speculated that a cutoff of 0.5 might not be ideal to turn their real values into binary predictions. We calculated BACC as function of the cutoff and found that for group 53, a value of 0.5 was still the best for both experiments. But for group 54, values of 0.3 for experiment 1 and 0.35 for experiment 2 provide better results. The values of BACC are 0.724 and 0.696 respectively, which are much better than the 0.5 cutoff (0.534 and 0.627 respectively). But this is only possible with reference to the experimental data, which would not be available in real-world situations. Since the density for predictions for group 54 were unimodal (Fig. 3), it was not possible to define a cutoff based on a minimum of density between a low-activity and a high-activity mode in the data.
Prediction of allosteric inhibition of alanine (Qax-Ala)
The second challenge was to estimate the inhibitory allosteric effect of binding alanine, Qax-Ala on binding of the substrate phosphoenolpyruvate (PEP). The density estimates of experimental Qax-Ala values of two experiments are shown in Figure 4. The wild type enzyme had a Qax-Ala value of ~0.08 in both experiments. In experiment 1, 23 out of 90 mutants did not have measurable allosteric coupling, shown in a peak at Qax = 1 (Fig. 4, left). One possiblity is that alanine continues to bind to these mutant proteins, but that binding does not alter PEP affinity. In other cases, the Qax = 1 outcome is likely because the mutation eliminated binding of Ala to L-PYK altogether (at least to the maximum concentration tested in the experiments). In experiment 2, after excluding 37 mutants for which the allosteric coupling effect could not be measured, the Qax-Ala values of 325 (83%) mutants were between 0 and 0.2, relatively similar to the wild-type enzyme.
Figure 4.

Kernel density estimates of experimental Qax-Ala values of Experiments 1 and 2.
A comparison by scatter plot of the experimental and the predicted Qax-Ala values is shown in Figure 5. Group 55 provided only binary prediction for Qax-Ala. Group 56_1 and 56_2 provided identical values for both experiments. The scatter plots do not show any obvious correlations between the predicted and experimental Qax-Ala.
Figure 5.

Scatter plot of the experimental Qax-Ala vs the predicted Qax-Ala values.
We calculated Spearman’s ρ and Kendall’s τ coefficients as non-parametric tests of the correlation of the predictions with the experiments, since the data and predicted values are not unimodal or normally distributed. Only group 55 in Experiment 1 achieves a favorable correlation, with ρ = 0.351 and τ = 0.299 with p-values of 0.002 for both (Fig. 6). All of the other p values are in the range of 0.17 to 0.88, which implies there is no correlation between the predicted and experimental Qax-Ala values. If we treat the experimental Qax-Ala values as binary for experiment 1 (Figure 4, left), we can calculate binary assessment measures such as TPR, TNR, etc. We did this for group 55, which also provided binary prediction values (0.1 and 1.0) with the following results (where positive indicates Qax-Ala=1): TPR = 17/23 = 0.739; TNR = 39/55=0.709; BACC = 0.724. This is better than random and explains the positive correlation coefficients.
Figure 6.

The correlations represented by Spearman’s ρ and Kendall’s τ between the predicted and experimental Qax-Ala values of two experiments.
The results for experiment 2 are negatively correlated for 3 of the groups, and only very weak positive correlations were achieved by groups 54 and 55 (Fig. 6 right). The p values are in the range 0.38 to 0.88.
Prediction of allosteric activation of Fru-1,6-BP (Qax-Fru-1,6-BP)
Predictors were asked to predict the allosteric effect of fructose-1,6-bisphosphate binding to L-PYK for the mutants created in experiment 2 and were told that the maximum value in the experiments was 320. The wild type protein has a Qax-Fru-1,6-BP value of 14.2. The density estimate of experimental Qax-Fru-1,6-BP values is shown in Figure 7, showing that the vast majority of mutants had values between 0 and 60. The scatter plots of the predicted Qax-Fru-1,6-BP vs experimental Qax-Fru-1,6-BP show that group 53 and 54 provided real values over the full range of the experimental values, Group 55 provided discrete values (1, 50, 250 and 320) while group 56 provided an approximate wild type value of 15.3 for most of the mutants and other values for 18 mutants in the range from 1 to 28.3 (Figure 8).
Figure 7.

The density estimate of experimental Qax-Fru-1,6-BP from Experiment 2.
Figure 8.

The scatter plot of the predicted vs experimental Qax-Fru-1,6-BP values from Experiment 2.
We calculated Spearman’s ρ and Kendall’s τ to evaluate the correlations between predicted and experimental Qax-Fru-1,6-BP values (Figure 9). Only group 55 has positive correlations, both very marginal (both ρ and τ ~ 0.05, with p-value of 0.2). All others have negative correlations, especially for group 53 and 54. The p values of group 53 are 7.5E-05 for ρ and 8.98E-05 for τ, the p-values of group 54 are 0.0003 for both ρ and τ.
Figure 9.

Correlations represented by Spearman’s ρ and Kendall’s τ between the predicted and experimental Qax-Fru-1,6-BP values in Experiment 2.
DISCUSSION
We may summarize the results of the CAGI experiment on liver pyruvate kinase as follows. Groups 53 and 56 had good predictions of the L-PYK enzyme activity in Experiment 1 and 2 as measured by balanced accuracy (group 53) and total accuracy (group 56). In these cases, the results were better than that achieved by PolyPhen2. Group 54 had good predictions only if we set a new cutoff for binary enzyme activity from their real-valued results in both experiments 1 and 2.
For the prediction of allosteric effects of alanine and fructose, group 55 and 53 had positive correlations for the Qax-Ala challenge in Experiment 1, but only group 55 had a statistically significant positive correlation. No group had statistically-significant, positive correlations for their predictions of Qax-Ala or Qax-Fru-1,6-BP in Experiment 2.
At the conclusion of this experiment, we are left to contemplate why the overall success of predicting allosteric effects was underwhelming. This consideration is particularly valuable given the indications of success of computational approaches reported in the literature. As noted, the only statistically significant result for predicting allosteric data was for group 55 on the Qax-Ala challenge in Experiment 1. This group used a very simple model that considered the distance each wild-type residue was from bound Ala (as modeled from the structure of human pyruvate kinase M2) and the severity of the mutation from wild type (as determined by scores from a substitution matrix). It is likely that they correctly predicted many of the mutations that abrogated Ala binding altogether (Qax-Ala=1), rather than quantitatively predicting the effect of the mutations on the diverse values of Qax-Ala of the remaining mutations (Qax-Ala<1). It is not likely that their distance-based method would extend readily to the general problem of predicting allosteric effects, especially for residues not in or near the binding site. The results for Experiment 2, where mutations were made throughout the protein, confirm this.
It is also clear from the experiment that methods that predominantly used evolutionary considerations (groups 53 and 54) were not able to predict the effects of mutation on allosteric behavior. Group 53 used the evolutionary action (EA) of each mutation, a number which can be calculated from phylogenetic sequence analysis (Katsonis and Lichtarge, 2014). Group 54 used covariation of amino acids in pairs of positions within a multiple sequence alignment of homologues of L-PYK (Jones, et al., 2015).
Group 56 calculated the binding affinity of each effector to each mutant with docking calculations (Shin, et al., 2013), and made the assumption that Qax was directly proportional to these values. In fact, Qax = Kix/Kix/a where Kix is the equilibrium dissociation constant of the effector X and Kix/a is the equilibrium dissociation constant of the effector X when the substrate A is bound. The approximation is not unreasonable given the experimental data from Experiment 2: the Pearson and Kendall correlation coefficients between the experimental values of Qax and Kix for alanine are 0.73 and 0.59 respectively and for Fru-1,6-BP they are 0.80 and 0.64 (all p-values < 1.0×10⁻¹⁵).
Group 56 only performed docking calculations to mutations in the binding sites of alanine and Fru-1,6-BP, and submitted values for all other positions of 1.0 for Qax-Ala and 15.3 for Qax-Fru-1,6-BP (the experimental value). This resulted in only 8 mutations with Qax-Ala not equal to 1.0, only 5 of which had experimental values available. If we restrict the calculation of correlation coefficients to these 5 values, the p-values for the Spearman and Kendall correlation coefficients are greater than 0.8 and the values of rho and tau are 0.1 and 0 respectively. For Qax-Fru-1,6-BP, group 56 produced values for 17 mutations adjacent to the Fru- 1,6-BP site, only 11 of which had enough enzyme activity to measure Qax-Fru-1,6-BP. The correlation coefficients with Qax-Fru-1,6-BP were both ~0.2 with p-values of ~0.5. Unless docking calculations are able to discern changes in binding affinity of the effector (in the presence or absence of the substrate) for sites far from their binding sites, it is not possible to determine whether such calculations provide valuable information on allosteric behavior.
It is clear from the quality of predictions in this study that additional approaches are needed. Many of the methods reported in the literature involve molecular dynamics simulations which are very computationally intensive (Blacklock and Verkhivker, 2014; Hertig, et al., 2016; Weinkam, et al., 2012). Several simulations of other forms of pyruvate kinase (Naithani, et al., 2015) and mutants thereof have been performed (Kalaiarasan, et al., 2015). However, whether such methods could be used in a predictive fashion has yet to be determined. The current data set could be used to benchmark such methods, if a sufficient number of mutants can be simulated.
Allosteric regulation is sometimes presented as a Rube Goldberg-type mechanism initiated by the effector associating with the enzyme/protein (binding causes change A; change A causes change B; change B causes change C, etc.). However, the definition for allostery based on an energy cycle (Figure 1) implies that allostery is an equilibrium mechanism (Carlson and Fenton, 2016). As such, the allosteric mechanism would be a comparison of changes in the fully equilibrated enzyme forms represented in Figure 1 and not a Rube Goldberg mechanism that would be associated with a kinetics mechanism. Calculations of this sort remain a challenge for computational approaches to predicting the effects of mutations on allosteric regulation.
Acknowledgments
Grant sponsors: R01 GM084453 (RLD) and R01 GM115340 (AWF). The CAGI experiment coordination is supported by NIH U41 HG007346 and the CAGI conference by NIH R13 HG006650.
This work was supported by NIH grants R01 GM084453 (RLD) and R01 GM115340 (AWF).
References
- 1.Adzhubei IA, Schmidt S, Peshkin L, Ramensky VE, Gerasimova A, Bork P, Kondrashov AS, Sunyaev SR. A method and server for predicting damaging missense mutations. Nat Methods. 2010;7(4):248–9. doi: 10.1038/nmeth0410-248. [DOI] [PMC free article] [PubMed] [Google Scholar]
- 2.Blacklock K, Verkhivker GM. Computational modeling of allosteric regulation in the hsp90 chaperones: a statistical ensemble analysis of protein structure networks and allosteric communications. PLoS Comput Biol. 2014;10(6):e1003679. doi: 10.1371/journal.pcbi.1003679. [DOI] [PMC free article] [PubMed] [Google Scholar]
- 3.Carlson GM, Fenton AW. What Mutagenesis Can and Cannot Reveal About Allostery. Biophys J. 2016;110(9):1912–23. doi: 10.1016/j.bpj.2016.03.021. [DOI] [PMC free article] [PubMed] [Google Scholar]
- 4.Collier G, Ortiz V. Emerging computational approaches for the study of protein allostery. Archives of biochemistry and biophysics. 2013;538(1):6–15. doi: 10.1016/j.abb.2013.07.025. [DOI] [PubMed] [Google Scholar]
- 5.Feher VA, Durrant JD, Van Wart AT, Amaro RE. Computational approaches to mapping allosteric pathways. Current opinion in structural biology. 2014;25:98–103. doi: 10.1016/j.sbi.2014.02.004. [DOI] [PMC free article] [PubMed] [Google Scholar]
- 6.Fenton AW. Allostery: an illustrated definition for the ‘second secret of life’. Trends Biochem Sci. 2008;33(9):420–5. doi: 10.1016/j.tibs.2008.05.009. [DOI] [PMC free article] [PubMed] [Google Scholar]
- 7.Fenton AW, editor. Allostery: Methods and Protocols. New York: Humana Press: Springer Science; 2012. p. 439. [Google Scholar]
- 8.Fenton AW, Alontaga AY. The impact of ions on allosteric functions in human liver pyruvate kinase. Methods Enzymol. 2009;466:83–107. doi: 10.1016/S0076-6879(09)66005-5. [DOI] [PMC free article] [PubMed] [Google Scholar]
- 9.Fenton AW, Hutchinson M. The pH dependence of the allosteric response of human liver pyruvate kinase to fructose-1,6-bisphosphate, ATP, and alanine. Arch Biochem Biophys. 2009;484:16–23. doi: 10.1016/j.abb.2009.01.011. [DOI] [PMC free article] [PubMed] [Google Scholar]
- 10.Fenton AW, Johnson TA, Holyoak T. The pyruvate kinase model system, a cautionary tale for the use of osmolyte perturbations to support conformational equilibria in allostery. Protein Sci. 2010;19:1796–1800. doi: 10.1002/pro.450. [DOI] [PMC free article] [PubMed] [Google Scholar]
- 11.Hertig S, Latorraca NR, Dror RO. Revealing atomic-level mechanisms of protein allostery with molecular dynamics simulations. PLoS Comput Biol. 2016;12(6):e1004746. doi: 10.1371/journal.pcbi.1004746. [DOI] [PMC free article] [PubMed] [Google Scholar]
- 12.Holyoak T, Zhang B, Deng J, Tang Q, Prasannan CB, Fenton AW. Energetic coupling between an oxidizable cysteine and the phosphorylatable N-terminus of human liver pyruvate kinase. Biochemistry. 2013;52(3):466–76. doi: 10.1021/bi301341r. [DOI] [PMC free article] [PubMed] [Google Scholar]
- 13.Ishwar A, Tang Q, Fenton AW. Distinguishing the interactions in the fructose 1,6-bisphosphate binding site of human liver pyruvate kinase that contribute to allostery. Biochemistry. 2015;54(7):1516–24. doi: 10.1021/bi501426w. [DOI] [PMC free article] [PubMed] [Google Scholar]
- 14.Jones DT, Singh T, Kosciolek T, Tetchner S. MetaPSICOV: combining coevolution methods for accurate prediction of contacts and long range hydrogen bonding in proteins. Bioinformatics. 2015;31(7):999–1006. doi: 10.1093/bioinformatics/btu791. [DOI] [PMC free article] [PubMed] [Google Scholar]
- 15.Kalaiarasan P, Kumar B, Chopra R, Gupta V, Subbarao N, Bamezai RN. In Silico Screening, Genotyping, Molecular Dynamics Simulation and Activity Studies of SNPs in Pyruvate Kinase M2. PloS one. 2015;10(3):e0120469. doi: 10.1371/journal.pone.0120469. [DOI] [PMC free article] [PubMed] [Google Scholar]
- 16.Katsonis P, Lichtarge O. A formal perturbation equation between genotype and phenotype determines the Evolutionary Action of protein-coding variations on fitness. Genome Res. 2014;24(12):2050–8. doi: 10.1101/gr.176214.114. [DOI] [PMC free article] [PubMed] [Google Scholar]
- 17.Lensink MF, Velankar S, Wodak SJ. Modeling protein-protein and protein-peptide complexes: CAPRI 6th edition. Proteins. 2016 doi: 10.1002/prot.25215. in press. [DOI] [PubMed] [Google Scholar]
- 18.Matthews BW. Comparison of the predicted and observed secondary structure of T4 phage lysozyme. Biochim Biophys Acta. 1975;405(2):442–51. doi: 10.1016/0005-2795(75)90109-9. [DOI] [PubMed] [Google Scholar]
- 19.Moult J, Fidelis K, Kryshtafovych A, Schwede T, Tramontano A. Critical assessment of methods of protein structure prediction: Progress and new directions in round XI. Proteins. 2016;84(Suppl 1):4–14. doi: 10.1002/prot.25064. [DOI] [PMC free article] [PubMed] [Google Scholar]
- 20.Naithani A, Taylor P, Erman B, Walkinshaw MD. A Molecular Dynamics Study of Allosteric Transitions in Leishmania mexicana Pyruvate Kinase. Biophysical journal. 2015;109(6):1149–1156. doi: 10.1016/j.bpj.2015.05.040. [DOI] [PMC free article] [PubMed] [Google Scholar]
- 21.R Core Team. R: A Language and Environment for Statistical Computing. Vienna, Austria: R Foundation for Statistical Computing; 2015. [Google Scholar]
- 22.Reinhart GD. The determination of thermodynamic allosteric parameters of an enzyme undergoing steady-state turnover. Arch Biochem Biophys. 1983;224(1):389–401. doi: 10.1016/0003-9861(83)90225-4. [DOI] [PubMed] [Google Scholar]
- 23.Reinhart GD. Linked-function origins of cooperativity in a symmetrical dimer. Biophys Chem. 1988;30(2):159–72. doi: 10.1016/0301-4622(88)85013-0. [DOI] [PubMed] [Google Scholar]
- 24.Reinhart GD. Quantitative analysis and interpretation of allosteric behavior. Methods Enzymol. 2004;380:187–203. doi: 10.1016/S0076-6879(04)80009-0. [DOI] [PubMed] [Google Scholar]
- 25.Shin WH, Kim JK, Kim DS, Seok C. GalaxyDock2: protein-ligand docking using beta-complex and global optimization. J Comput Chem. 2013;34(30):2647–56. doi: 10.1002/jcc.23438. [DOI] [PubMed] [Google Scholar]
- 26.Weber G. Ligand binding and internal equilibria in proteins. Biochemistry. 1972;11(5):864–78. doi: 10.1021/bi00755a028. [DOI] [PubMed] [Google Scholar]
- 27.Wei Q, Dunbrack RL., Jr The role of balanced training and testing data sets for binary classifiers in bioinformatics. PLOS ONE. 2013;8(7):e67863. doi: 10.1371/journal.pone.0067863. [DOI] [PMC free article] [PubMed] [Google Scholar]
- 28.Weinkam P, Pons J, Sali A. Structure-based model of allostery predicts coupling between distant sites. Proceedings of the National Academy of Sciences. 2012;109(13):4875–4880. doi: 10.1073/pnas.1116274109. [DOI] [PMC free article] [PubMed] [Google Scholar]
- 29.Williams R, Holyoak T, McDonald G, Gui C, Fenton AW. Differentiating a ligand’s chemical requirements for allosteric interactions from those for protein binding. Phenylalanine inhibition of pyruvate kinase. Biochemistry. 2006;45(17):5421–9. doi: 10.1021/bi0524262. [DOI] [PubMed] [Google Scholar]
- 30.Zhong W, Morgan HP, McNae IW, Michels PA, Fothergill-Gilmore LA, Walkinshaw MD. ‘In crystallo’ substrate binding triggers major domain movements and reveals magnesium as a co-activator of Trypanosoma brucei pyruvate kinase. Acta Crystallogr D Biol Crystallogr. 2013;69(Pt 9):1768–79. doi: 10.1107/S0907444913013875. [DOI] [PubMed] [Google Scholar]