Abstract
Aim:
In order to improve the delivery of aromatic drugs by micellar assemblies, and particularly by long and flexible filomicelles, aromatic groups were integrated into the hydrophobic block of a degradable diblock copolymer.
Materials & methods:
Aromatic filomicelles were formed by self-directed assembly of amphiphilic diblock copolymer PEG–PBCL with suitable block ratios. Worm-like filomicelles with an aromatic core were loaded with a common chemotherapeutic, Paclitaxel, for tests of release as well as effects on cancer cell lines in vitro and in vivo.
Results:
Aromatic filomicelles loaded more Paclitaxel than analogous aliphatic systems. Cell death and aneuploidy of surviving cells (which indicates toxicity) were highest for carcinoma lines treated in vitro with the new filomicelles. Initial tests in vivo also suggest more potent tumor shrinkage.
Conclusion:
Flexible filomicelles with an aromatic core form an efficient drug delivery system that leads to higher cell death than previously reported systems, while inducing aneuploidy in surviving cells.
Keywords: : cylinder micelle, cytokinesis, drug delivery, worm micelle
Nanocarriers can increase the solubility of poorly soluble drugs [1] and also improve the effective dose of drugs delivered to diseased cells in vitro as well as in vivo. Paclitaxel (TAX) is a prototypical low solubility chemotherapeutic with multiple aromatic structures [2,3] (Figure 1A). TAX is an antimitotic that stabilizes microtubules to induce aneuploidy by blocking the metaphase–anaphase transition, increasing cell death greatly [4,5]. However, cells that receive sublethal doses of TAX are more likely to develop drug resistance [6], with selection of mutations in β-tubulin being one source of resistance [7]. Such resistance strongly motivates many diverse efforts to increase drug efficacy, particularly by loading into nanocarriers.
Figure 1. . Filomicelles from different polymers.
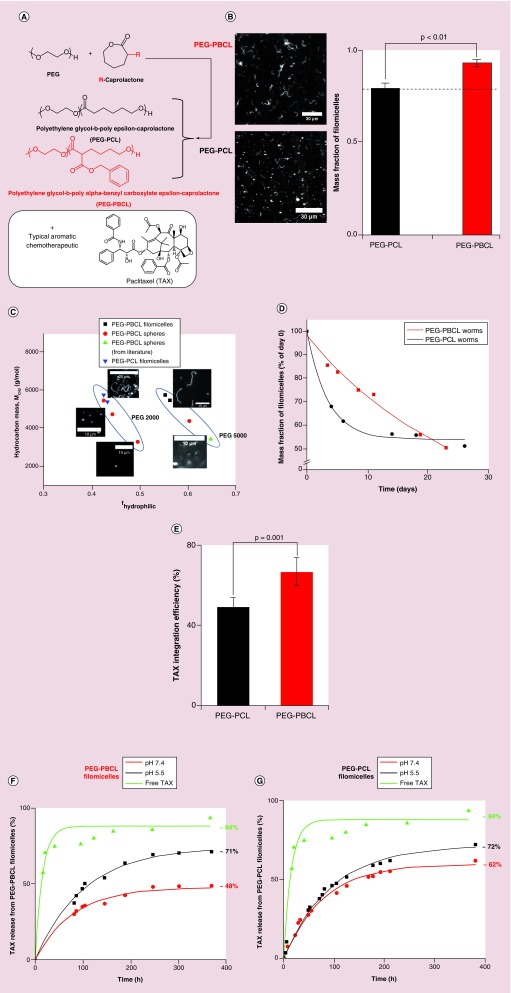
(A) PEG reacts with ε- Caprolactone (which can be functionalized with a group, R, at the alpha carbon) to form PEG–PCL (black) or PEG–PBCL (red) polymer. The aromatic group in PEG–PBCL may help load more aromatic chemotherapeutics, such as Paclitaxel. (B) 60 x magnification images of filomicelles formed from PEG–PBCL (top left) and PEG–PCL (top right). Scale bars are 30 μm. Assemblies from the former had a higher purity of filomicelles than the latter. Quantification of mass fraction of filomicelles in aggregates (right), revealed a higher filomicelle mass fraction of filomicelles in PEG–PBCL sample (93%) than PEG–PCL (79%). The rest were spheres. (C) Phase diagram of assemblies from PEG–PBCL formed by solvent evaporation method. As with PEG–PCL, filomicelles from PEG–PBCL occupy a narrow region, with possibly different regions corresponding to the weight of the hydrophilic block. Filomicelle scale bars are 20 μm, while spherical micelle scale bars are 10 μm. (D) Degradation of mass fraction of filomicelles with time. Rate of degradation is higher for PEG–PCL worms initially, while it remains nearly constant for PEG–PBCL. The mass fraction of worms from the two polymers become similar around day 25. The time scale of degradation suggests that all aggregates will be taken up by the cell as filomicelles, and not as spheres, as filomicelles circulate for roughly 8 days [8]. (E) Higher Paclitaxel loading capacity of PEG–PBCL versus PEG–PCL. Integration efficiency of PEG–PBCL was 40% higher than filomicelles from PEG–PCL with an aliphatic core. (F & G) Release studies performed with PEG–PBCL and PEG–PCL filomicelles at different pH as well as free drug. The rate of release from PEG–PBCL filomicelles at pH 7.4 was much slower than that of free drug, indicating little leakage while in circulation. PEG–PCL worms in had higher drug release at the same pH. Rapid and similar release profiles at pH 5.5 for both polymers hint at rapid release after lysosomal degradation.
Shapes as well as sizes and chemical composition(s) of nanocarriers contribute to drug loading (per particle) and delivery to cells. In particular, amphiphilic block copolymers with suitable block ratios can self-assemble [9] into worm-like ‘filomicelles’ as well as spherical micelles, and the elongated morphology of filomicelles has been shown in both experiments [10] and molecular dynamics simulations [11] to integrate almost two-fold more TAX per polymer – at least for polyethylene glycol–polycaprolactone (PEG–PCL)-based copolymers. Whereas PEG (hydrophilic block) forms a hydration layer that contributes to many properties including a resistance to particle uptake by phagocytes [12], the hydrophobic block controls critical properties of the nanocarrier such as flexibility [13] and kinetics of degradation-coupled release [10,14]. Aliphatic polyesters such as PCL and polylactic acid hydrolyze over many hours, depending on pH and this loss of core polymer tends to destabilize assembled morphologies, including filomicelles [10] but also lipid bilayers (aliphatic chains) as part of both delivery and toxicity mechanisms [14]. Aromatic TAX prefers the interface of PEG–PCL micelles [11], but aromatic amino acids (e.g., tyrosine) likewise tend to localize to the interface of lipid bilayers unlike more aliphatic amino acids [15]. Incorporation of aromatic groups into the core of a nanocarrier could therefore increase the solubilization of aromatic drugs such as TAX for better delivery to tumor cells, and could also determine how the amphiphilic polymer or its degraded forms interact with and/or disrupt cell membranes [16–18].
Nanocarriers generally suppress rapid elimination by kidney filtration, and long and flexible filomicelles have exhibited surprisingly long delays in phagocytic clearance (which is the usual fate of any foreign particle) by the liver and spleen [8]. Such a delay can decrease off-target drug toxicity [19,20] and also increase circulation time to favor drug accumulation through the leaky vasculature of solid tumors [21–25]. Modifying the micelle core could also affect the degradation time of nanocarriers, which is key to releasing drugs if and/or when micelles accumulate in a tumor. The crucial role of drug release profile on efficacy in vivo is highlighted by the many efforts to include moieties such as pH-sensitive groups that make the nanocarrier fall apart under a stimulus [26,27]. Filomicelles of different core chemistries are therefore interesting to test in vivo as well as in vitro, with a first couple of key unknowns being whether greater solubilization of an aromatic drug such as TAX impedes its release and whether changing the core chemistry alters the overall toxicity toward cancer cells [16].
Here, we examine whether aromatic groups attached to PCL via an ester group can assemble into filomicelles and safely deliver TAX. Assemblies of PEG–PBCL (Figure 1A) were characterized by fluorescence microscopy, evaluated for drug loading/release by high performance liquid chromatography (HPLC) and assessed for cytotoxicity using two cancer cell types. PEG–PBCL filomicelles loaded with TAX appeared more effective than either PEG–PCL filomicelles or free drug, and PEG–PBCL filomicelles also caused the greatest aneuploidy of the few surviving cells (hallmark of TAX treatment). Drug-free ‘empty’ PEG–PBCL filomicelles were also an order of magnitude less toxic than PEG–PCL filomicelles. Initial in vivo tests of efficacy of PEG–PBCL filomicelles loaded with TAX illustrate an ability to safely shrink tumors. The findings support past evidence that microns-long filomicelles are effective in cancer drug delivery but also show that efficacy might be increased by safely tuning polymer composition.
Materials & methods
Materials
All chemical reagents were purchased from Sigma Aldrich Corp. (MO, USA), unless stated otherwise. PEG–PBCL copolymer was procured from Alberta Research Chemicals Inc. (AB, Canada), as well as generously provided by Afsaneh Lavasanifar (University of Alberta, AB, Canada). Ham's F-12 growth media, FBS, penicillin–streptomycin, nonessential amino acids and Hoechst 33342 were purchased from Invitrogen. High glucose DMEM growth media, 12-well plates and 96-well plates were purchased from Corning.
Synthesis & characterization
PEG–PCL diblock copolymer was prepared by the polymerization of ε-caprolactone using PEG2000 as macroinitiator. ε-Caprolactone was purified prior to polymerization by distilling it under vacuum at 60°C. The molar ratios of PEG and caprolactone were adjusted to form PEG2000–PCL7500 (as indicated in Table 1), which has been shown to self-assemble into filomicelles [13]. The reactants along with the catalyst, stannous octoate, were sealed under vacuum and reacted for 4 h at 140°C. Synthesis of PEG5000–PBCL7500 (stoichiometry indicated in Table 2) was carried out at the same temperature, but the reaction time was 6 h. A schematic representation of this reaction is shown in Figure 1A. The PEG–PBCL reaction mixture was dissolved in 3 ml of dichloromethane and the solution was poured into 30 ml of hexane with stirring. This mixture was then decanted to remove hexane. The solid product was collected, washed with 5 ml diethyl ether and stored under vacuum overnight. The isolated yield of the product was 72%. Formation of the product was confirmed by 1H NMR spectroscopy (Bruker BZH 360/52, 16 scans per spectrum) and the size distribution of the polymer was characterized using Gel Permeation Chromatography.
Table 1. . Quantities of reactants used in the synthesis of PEG2000–PCL7500.
| Units | Polyethylene glycol | ϵ-caprolactone | Stannous octanoate | PEG2000–PCL7500 |
|---|---|---|---|---|
| mmol |
0.27 |
17.53 |
0.04 |
0.27 |
| Mass (mg) |
533 |
2000 |
16 |
2550 |
| Molecular weight |
2000 |
114.1 |
405.1 |
9500 |
| Density (g/ml) |
– |
1.03 |
1.25 |
– |
| Volume (μl) | – | 2000 | 13 | – |
Table 2. . Quantities of reactants used in the synthesis of PEG5000–PBCL7500.
| Units | Polyethylene glycol | α-benzyl carboxylate ϵ-caprolactone | Stannous octanoate | PEG2000–PCL7500 |
|---|---|---|---|---|
| mmol |
0.16 |
4.84 |
0.24 |
0.16 |
| Mass (mg) |
800 |
1200 |
96 |
2100 |
| Molecular weight |
5000 |
248 |
405.1 |
12500 |
| Density (g/ml) |
– |
1.03 |
1.25 |
– |
| Volume (μl) | – | 2000 | 77 | – |
Filomicelle formation & characterization
Aggregates were formed in water by solvent evaporation of the copolymer dissolved in chloroform with the final concentration of polymer in water being 20 mg/ml. For every ml of aggregates, 20 mg of polymer was dissolved in 100 μl of chloroform (to give a polymer concentration in chloroform of 200 mg/ml), which was then added to 1 ml (MilliQ) water as separate phase. This mixture was then stirred for 2 days at 110 rpm with the cap lightly screwed on, to allow the chloroform to evaporate. For visualization under the microscope, 40 µl of aggregates were mixed with 0.2 μl of PKH 26 hydrophobic red dye (which had been previously diluted five-times in ethanol). This dye, with emission spectra at a wavelength of 567 nm [13], was then imaged using an Olympus IX71 microscope with a 300W Xenon lamp using a 60x objective (oil, 1.25 NA) or 150x objective (oil, 1.45 NA) and Cascade CCD camera (Photometrics, AZ, USA). The software used was Image Pro (Media Cybernetics, MD, USA).
A phase diagram based on estimations of core block hydrophobicity (MCH2) and hydrophilic mass fraction (fhydrophilic) was calculated as per [13]. Briefly, MCH2 is calculated as the molecular weight of the hydrophobic block minus the weight contributed by oxygen atoms. The weight of these oxygen atoms is added to the weight of PEG block, which is divided by the total weight of the diblock copolymer to obtain fhydrophilic (more detailed instructions on this calculation can be found in [13]).
Drug loading & quantification
Paclitaxel dissolved in DMSO (at a concentration of 20 mg/ml) was added to the aggregates at a final concentration of 1 mg of drug per ml of aggregate dispersion. The mixture was stirred for 1 h at 150 rpm and let stand overnight to incorporate the drug into the filomicelle core. The unincorporated drug was removed by dialyzing the mixture through a membrane having molecular weight cut-off of 3500 Da (procured from Spectrum Laboratories, Inc., CA, USA). The dialyzed mixture was allowed to stand overnight and centrifuged at 2000 rpm for 8 min prior to usage. The drug loading was measured via Shimadzu prominence HPLC with Pinnacle DBC18 Column (4.6 × 150 mm, 5 µm particles).
Persistence length & mass fraction quantification
Procedure for persistence length measurement was adapted from [13]. Time-lapse images of filomicelles were taken and the end-to-end distance (R) and contour length (L) was measured using ImageJ 1.48d software. The persistence length was measured by fitting the data to a worm-like chain model as described in [13]. ImageJ was used to calculate the area occupied by filomicelles and spheres in abovementioned time-lapse images. Mass fraction of filomicelles = (area of filomicelles)/(area of filomicelles + area of spheres).
Release studies
Procedure adapted for release studies was as described in [10]. Drug-loaded filomicelles and free drug were dialyzed (molecular weight cut-off 3500 Da) against phosphate buffered saline (PBS) at pH 7.4 and 5.5 to simulate blood and endosome, respectively. The temperature was maintained at 37°C. Samples were taken periodically and subjected to HPLC analysis as mentioned above (in the ‘Drug Loading & Quantification’ section).
Cell culture
A549 lung cancer cell line was purchased from ATCC and grown with Ham's F12 growth media supplemented with 10% FBS and 1% penicillin–streptomycin at 37°C and 5% CO2. EC4 mouse liver cancer cell line was cultured with DMEM high glucose growth media (4.5 g/l glucose with L-glutamine and sodium pyruvate) supplemented with 10% FBS, 1% penicillin–streptomycin and 1% nonessential amino acids at 37°C and 5% CO2. The cells were passaged by dissociation with 0.05% Trypsin-EDTA (Invitrogen) and plated with fresh media.
In vitro filomicelle uptake
Ten thousand EC4 cells were seeded in 12-well plates. Filomicelles labeled with PKH26 red dye were prepared as described above (in the ‘Filomicelle formation & characterization’ section). The next day, old media were discarded and cells were incubated with 950 μl of fresh media as well as 50 μl of 20 mg/ml labeled filomicelles. At fixed time points of 4, 24, 48 and 72 h, cells were trypsinized, spun down and washed with PBS. They were then spun down and suspended in 1 ml of Hoechst 33342 solution (0.01% of 10 mg/ml solution in water) for 5 min. After the incubation, cells spun down and suspended in 300 µl of flow buffer (5% FBS in PBS). Cells were run through a flow cytometer (BD LSR II) and data were analyzed by WEASEL v3.2.1 software.
A subset of cells incubated with labeled PEG–PBCL filomicelles (one well per sample) was visualized under the microscope. The cells were washed with PBS (Invitrogen) and stained with Hoechst 33342 (0.05% of 10 mg/ml solution in water; Molecular Probes, Invitrogen) for 10 min. Following this incubation, they were washed with PBS three-times and visualized under an Olympus IX71 microscope with a 300W Xenon lamp using 60x objective (oil, 1.25 NA). Images were taken for DNA, PKH as well as bright field and were then analyzed by ImageJ software.
In vitro cell viability assay
Procedure for in vitro cytotoxicity assay was adapted from [10]. Five hundred cells (at a concentration of 50,000 cells/ml of media) were seeded in 96-well plates (100 μl per well) and incubated for a day to facilitate attachment to the bottom. The next day, old media was aspirated and the cells were incubated with 100 μl of different formulations and 100 μl of fresh media for 3 days (200 μl total volume). 100 μl of PBS was added as a negative control post 3-day incubation, the supernatant was aspirated and cells were incubated with 100 μl of fresh media and 11 μl of MTT solution (5 mg/ml in PBS) for 3.5 h at 37°C and 5% CO2. The supernatant was then aspirated and MTT formazan crystals were then dissolved in 100 μl of DMSO per well, and absorbance was measured using Tecan Infinite F200 plate reader at 550 nm. Cell viability was proportional to (absorbance reading of well–absorbance of blank DMSO). Curve fitting and data analysis were performed using OriginPro 8 software.
Cell death quantification
Cell death induced after treatment was measured as the number of floating cells staining positive for Trypan Blue (Corning). After 3 day treatment, media were counted for total number of floating cells (dead and alive) using a hemocytometer. Following this, the media were mixed with equal volume of Trypan Blue solution (0.4% w/v in PBS), and number of cells staining negative were counted. Cell death density = total density of floating cells - 2 × density of cells staining negative with Trypan Blue.
DNA content analysis
DNA content was analyzed on fixed cells as well as by flow cytometry. Cells were fixed using 4% paraformaldehyde for 10 min followed by three PBS washes. Following this, they were stained with Hoechst solution as described above. Cells for analysis by flow cytometry were prepared by trypsinizing treated cells. These were then spun down, supernatant was aspirated and cells were suspended in 1 ml Hoechst 33342 solution (0.01% of 10 mg/ml solution in water) for 5 min. The cells were then spun down, Hoechst solution aspirated and cells were suspended in 300 μl flow buffer (5% FBS in PBS). Cells were run through a flow cytometer (BD LSR II) and data were analyzed by WEASEL v3.2.1 software. Recovery of DNA content was performed by washing away TAX containing media after 3 days of TAX treatment. The well was washed with PBS and attached cells were incubated with fresh media for 3 more days. Following this, the remaining attached cells were prepped for flow cytometry and analyzed as described above.
In vivo experiments
In vivo experiments were performed on NOD-SCID mice with tumor xenografts. 200 µl of Paclitaxel-loaded filomicelles were administered via tail vein injection. The treatment consisted of four injections each, administered in regular intervals of 3 days. Tumor size was measured at regular intervals and the tumor area was normalized relative to the size at the onset of the treatment.
Statistical analyses
Unless indicated otherwise, mean and standard deviation are calculated for a minimum of n = 3 independent samples.
Results
Synthesis & characterization of PEG–PCL & PEG–PBCL aggregates
For PEG–PCL (OCL) synthesis, the relative amount of polymerization initiator was adjusted such that the diblock copolymer had a PEG block with a molecular weight of 2000 g/mol and the PCL block a weight of 7500 g/mol. Molecular weights were confirmed by 1H NMR, which was used to estimate the proportion of PEG to PCL. PEG–PBCL (OBCL) were made per [28] with spectra verified by 1H-NMR. The samples were run through a Gel Permeation Chromatography to calculate polydispersity index. A summary of the characterization of the two polymers has been provided in Table 3. Filomicelles made by the chloroform evaporation method [13] were visualized after incorporating the biocompatible PKH 26 red dye, and imaging indicated that OBCL could form just as many filomicelles (perhaps more) as OCL with some spherical micelles also present in all samples (Figure 1B). Mass fraction calculations (Figure 1B, right) revealed that 7% of the OBCL polymer formed spheres, whereas 21% did so for OCL.
Table 3. . Characterization of polymers utilized to form filomicelles.
| Block molecular weights | Block repeating units | Number average molecular weight (Mn)(g/mol) | Weight average molecular weight (Mw) (g/mol) | Polydispersity index (PDI) |
|---|---|---|---|---|
| PEG2000–PCL7500 |
PEG45–PCL66 |
9799 |
15438 |
1.575 |
| PEG5000–PBCL7500 | PEG114–PBCL30 | 12533 | 25166 | 2.008 |
A phase diagram (Figure 1C) based on estimations of core block hydrophobicity (MCH2) and hydrophilic mass fraction (fhydrophilic) per [13] suggests a filomicelle microphase dependence on PEG molecular weight rather than just hydrophilic fraction. Sphere micelle data for OBCL from [28,29] appear consistent with further observations here and sphere micelles are consistently located to the lower right of filomicelle assemblies within this phase diagram. Filomicelles generated from either copolymer also required surprisingly similar amounts of nominal hydrophobicity (5000–6000 g/mol). Synthesis of more polymers will certainly be critical to verifying and clarifying these trends, but the production of these novel OBCL filomicelles with an aromatic core raised more important questions about stability and ability to incorporate an aromatic drug such as TAX.
PEG–PBCL filomicelles are initially stable & efficiently load TAX, which is released at low pH
The mass fraction of filomicelles in the aggregate solution at pH 7.4 and 37°C was quantified over time in order to track the degradation of filomicelles to spheres. The decay in OBCL filomicelle mass fraction was exponential with a time constant of ˜700 h (Figure 1D). While this decay occurred at a near constant rate, OCL filomicelles exhibited a higher rate of degradation initially (time constant of 47 h) which leveled off with time. Both polymers had similar mass fraction of filomicelles around day 25.
HPLC analysis of OBCL and OCL filomicelles loaded with TAX in parallel revealed consistently more integration of drug (by ˜40%) into OBCL filomicelles (Figure 1E). To quantify the time scale of drug release in different environments, dialysis release studies were conducted. Free drug was released efficiently (94%) and quickly in dialysis (time constant of 15 h), compared with OBCL filomicelles at pH 7.4 and 5.5, which exhibited first order release time constants of 105 and 85 h, respectively (Figure 1F). Just 48% of the drug was released by 14 days in pH 7.4, whereas 71% was released at pH 5.5 in the same time frame. In contrast, OCL filomicelles released 62% of the drug at pH 7.4 and 72% at pH 5.5 (Figure 1G). Exponential decay curves fitted to the release profiles revealed time constants of 93 and 79 h, respectively. These results support the expectation that drug release will be minimal while circulating in the blood for many hours or days, and indicate that OBCL assemblies may be able to better distinguish between healthy and tumor microenvironments.
Incorporation of aromatic group maintains filomicelle flexibility
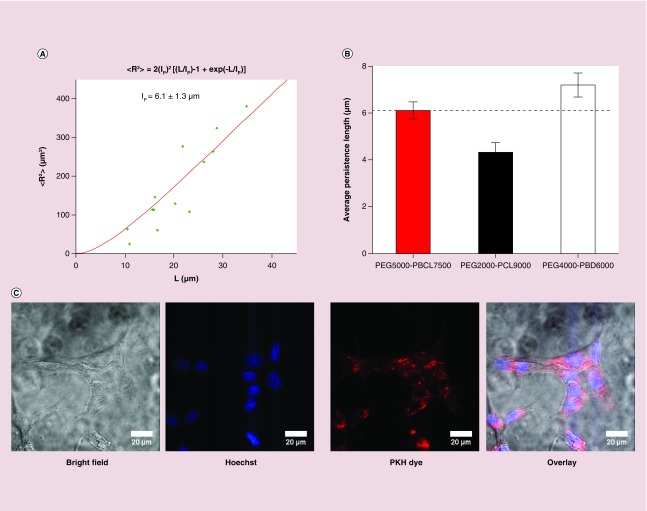
Filomicelle flexibility is important to persistent circulation since rigid filomicelles are rapidly cleared [8], and flexibility can be affected by core chemistry as well as molecular weight [13]. By imaging filomicelles of different contour lengths, we estimated the persistence length, lp, of OBCL filomicelles to be 6.1 μm (Figure 2A).This differs only modestly from persistence lengths of filomicelles formed from PEG–PCL and PEG–PBD (Figure 2B) despite major differences in PEG and core molecular weights as well as core chemistries.
Figure 2. . Cellular uptake of filomicelles.
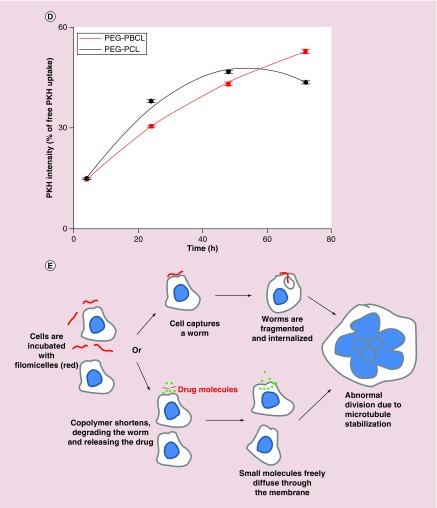
(A) Model fitting during the calculation of persistence length of PEG–PBCL filomicelles. (B) While the persistence length of PEG–PBCL is higher than that of PEG–PCL, it is lower than PEG–PBD (also proven to form flexible filomicelles). (C) PKH, Hoechst and bright field images of cells incubated with PKH-labeled filomicelles. Cytoplasmic spots of the dye after filomicelle uptake by EC4 cells can be seen after incubation for one day. Scale bars are 20 μm. (D) Quantification of PKH intensity within a cell after incubation with dye-labeled filomicelles. The intensity recorded increases exponentially with time for PEG–PBCL, while it is parabolic for PEG–PCL worms. PEG–PCL worms have higher accumulation initially, but is surpassed by PEG–PBCL on day 3. (E) Schematics depicting the uptake of filomicelles (or worms) by cells. Cells, when incubated with filomicelles, come in contact with and capture them. The cell may then proceed to chew off a part of the filomicelle. Alternatively, the constituent diblock copolymers may undergo hydrolysis leading to its shortening. The corresponding phase transition of filomicelles to spheres destabilizes the filomicelles, leading to release of the encapsulated drugs. These small molecules are then taken up by the cell.
OBCL filomicelle delivery to cancer cells suggests higher efficacy & safety
Human lung cancer derived A549 cells were incubated with free PKH dye or the same amount of total dye in PKH-labeled OBCL filomicelles for up to 72 h, and the PKH intensity in the filomicelle-treated cells was plotted against time as (% of free PKH uptake). Spots of PKH were seen throughout the cytoplasm, with a decrease near the nucleus (Figure 2C) and overall dye intensity in the cells increased with first-order kinetics, fitting a time constant of 85 h (Figure 2D). Kinetic studies conducted with OCL filomicelles suggest a parabolic behavior, with PKH intensity peaking at 48 h and subsequently decaying. At low time scales (˜4 h), the intensities from internalized OCL and OBCL filomicelles (or worms) are similar, while OCL-labeled worms accumulate more at intermediate length scales of 1–2 days, although the difference in intensities never exceed ˜20%. At a longer length scale of 3 days, OBCL worms show highest intensity (20% higher than cells incubated with OCL worms). The combination of release studies and uptake results suggest that TAX delivery to the cells may be dominated by micellar uptake (in whole or parts of the worm) over molecular transfer [30], which should ultimately lead to abnormal division, with cell death and/or aneuploidy (Figure 2E).
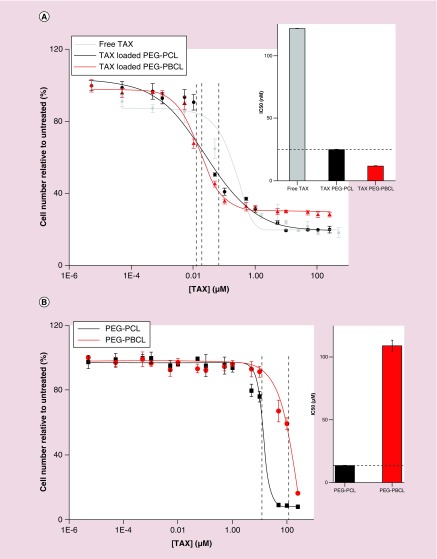
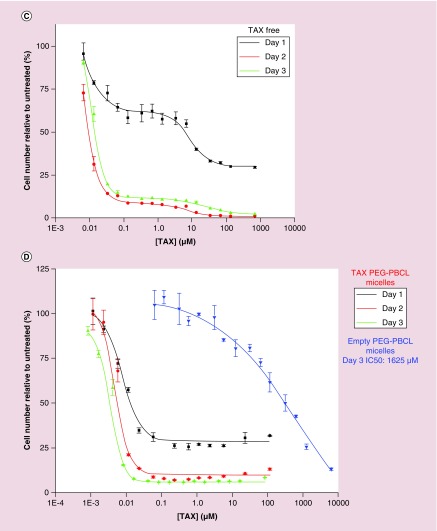
To test the model, the efficacy of OBCL filomicelles loaded with TAX was evaluated for two different cancer cell lines: human non-small-cell lung cancer (A549) and mouse liver cancer cell (EC4). A549 cells were treated with free TAX, TAX-loaded OCL or TAX-loaded OBCL for 3 days (Figure 3A). Nanocarriers loaded with TAX appeared more potent in suppressing cell numbers than free TAX, and TAX-loaded OBCL filomicelles (OBCL–TAX) were more potent than OCL filomicelles (OCL–TAX). Importantly, the extreme toxicity of OBCL–TAX filomicelles did not translate to systems without drug (Figure 3B): filomicelles of OCL and OBCL formed at the same polymer concentration of 20 mg/ml showed empty OBCL were an order of magnitude less toxic than corresponding OCL, with TAX equivalent IC50s of 109 and 13 μM, respectively.
Figure 3. . Cell viability with paclitaxel.
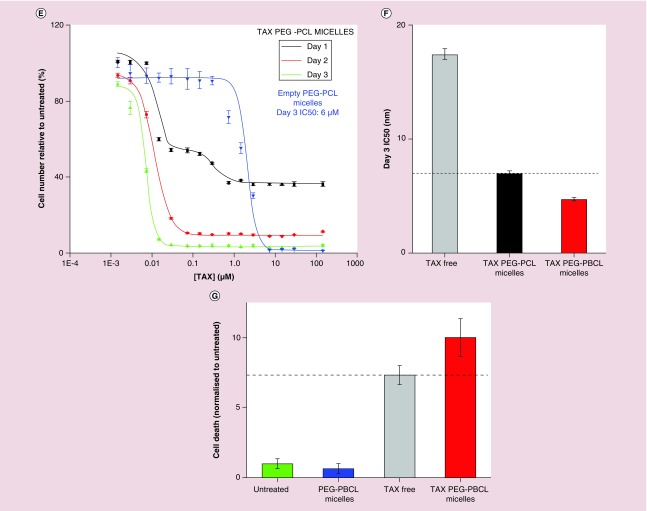
(A) Effects of drug-loaded micelles can be applied across various cell types. Cell viability of A549 (epithelial lung cancer) cells treated with free and polymer-loaded drugs reveal a clear advantage of loaded formulation over free drug (IC50 bar graph inset). (B) inertness of nanocarrier (no effect of empty carriers on viability. (C–E) EC4 cell viability kinetics with free TAX, PEG–PBCL TAX and PEG–PCL TAX, respectively. While both free and encapsulated drugs show similar effects, cell viability of free drug at day 3 is higher than that for day 2, presumably due to degradation of free drug in the presence of water. Encapsulated drug is protected from hydrolysis, which is supported by consistently decreasing viability with time. At all three time points (days 1, 2 or 3), the IC50 of TAX-loaded PEG–PBCL worms were lower than that of corresponding PEG–PCL worms. Empty PEG–PBCL micelles were inert (IC50 >1500 μM). However, PEG–PCL worms exhibited significant toxicity (IC50 ˜6 μM), as seen previously in Figure 3B. (F) Bar graph representation of the IC50 values of different formulations after 3 days. Less concentration of Paclitaxel is required to induce cell death in encapsulated form than in free form, with TAX PEG–PBCL micelles being three-times more potent than free drug, and 1.5-times more potent than TAX-loaded PEG–PCL worms. (G) Treatment with TAX leads to a higher number of floating cells that do not stain negative with trypan blue, indicating cell death. Cell death is minimum with untreated cells or ones incubated with empty filomicelles. Free as well as encapsulated TAX induces significant cell death, with loading on to micelles inducing 40% more cell death.
Efficacy of OBCL filomicelles against an EC4 liver cancer cell line produced similar results. Cell numbers were measured after incubations of 1, 2 or 3 days with either free TAX (Figure 3C), OBCL filomicelles (OBCL–TAX, Figure 3D) or OCL filomicelles (OC–TAX, Figure 3E). The latter were far more effective than free TAX, especially after just 1 day. At IC50 concentrations, cell death with TAX filomicelles was consistently higher than with free drug, although at more extreme concentrations (>100 μM), cell death was higher with free TAX. Empty OBCL were once again nontoxic with an IC50 of 1625 μM, which is an order of magnitude less toxic than that found for the A549 cells. At all three time points (days 1, 2 or 3), OBCL-TAX worms were more potent than OCL–TAX worms. Empty OCL worms exhibited significant toxicity compared with OBCL counterparts (IC50 ˜6 μM), as seen previously in Figure 3B. After 3 days, the IC50 of OBCL–TAX was 3.5-fold lower than for free TAX (Figure 3F), which highlights once again the efficacy of drug-loaded nanocarriers. Some EC4 cells also detach and float as they die, with a small number of floating cells in untreated culture as well as cultures incubated with drug-free OBCL filomicelles (Figure 3G). Consistent with the above counts of viable attached EC4 cells, OBCL–TAX filomicelles maximized this separate metric of cell death relative to free TAX in addition to being ˜10-fold above control cultures.
TAX-filomicelles maximize & sustain aneuploidy
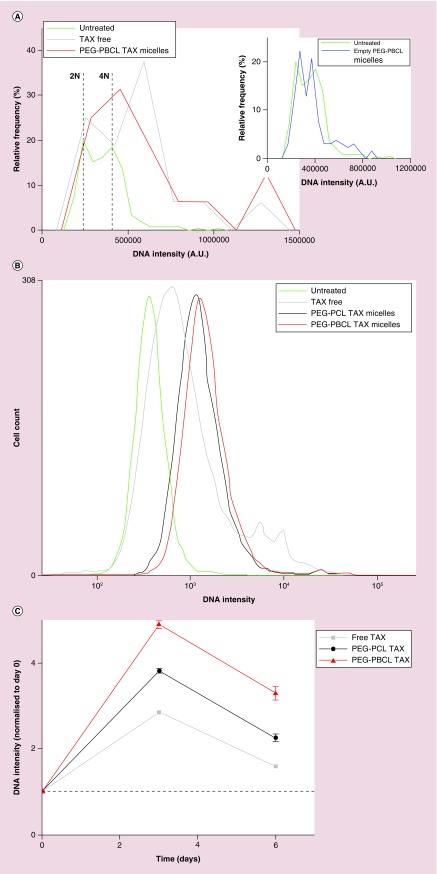
Histograms of DNA intensity in fixed EC4 cells stained with Hoechst are used to identify levels of ploidy induced by TAX as either free drug or drug delivered by OBCL. Filomicelles (Figure 4A). Untreated cells show two major peaks for diploid cells (2N) and replicating cells (≤4N), with very few cells showing higher intensity. However, treatment with TAX increases DNA intensity well beyond 4N intensity, consistent with incomplete cell division. Such aneuploidy is prominent in cells treated with free TAX and with OBCL–TAX (red curve) but not with empty nanocarriers (inset), which confirms the lack of toxicity. Due to the limited number of cells that can be analyzed under the microscope, DNA content of cells was also analyzed using flow cytometry (Figure 4B). TAX filomicelles led again to the greatest aneuploidy when compared with free TAX, and aneuploidy was higher for OBCL–TAX compared with OCL–TAX, consistent with OBCL delivering more effectively than OCL (Figure 3A).
Figure 4. . Effect of TAX on EC4 DNA.
(A) Quantification of Hoechst intensity per cell and plotting the corresponding histogram reveals aneuploidy present in TAX-treated nuclei. Untreated cells reveal that a significant portion of the cells in replicating phase (labeled 4N), and rest in diploid state (2N). However, post-treatment with TAX, most cells exhibit aneuploidy (i.e., number of chromosomes greater than 4N). This effect is further enhanced by encapsulating TAX in filomicelles. Empty nanocarriers do not produce an appreciable change in this distribution. (B) Quantification of aneuploidy by flow cytometry shows similar results to IF (Figure 4A). (C) Recovery of diploidy by EC4 cells postinduction of aneuploidy after TAX treatment. Nanocarrier-loaded TAX induce more aneuploidy after treatment (day 3), and still has more DNA content after 3 days of recovery.
Chemotherapy in the clinic typically involves a bolus injection or infusion followed by no delivery for a few days, and then repeated over several weeks, and so sustained effects of drugs are potentially important to efficacy. To measure the persistence of aneuploidy after TAX treatments here, a rescue experiment was performed (Figure 4C). After treatment (day 3), all cells showed high levels of aneuploidy, as noted previously (Figure 4A & B). Aneuploidy always decreased post-treatment, and the rate of decrease of DNA content versus time was similar for all TAX treatments. However, only OBCL–TAX exhibits high aneuploidy (2–3-fold higher average DNA) at 3–4 days after an in vitro treatment.
OBCL filomicelles with TAX shrink tumors in vivo
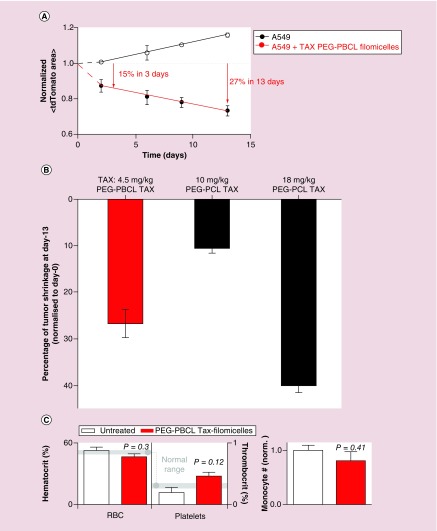
Four injections of drug-loaded filomicelles over 2 weeks resulted in a decrease in tumor size (Figure 5A). Mice with control injections showed continued growth of tumors. Drug-loaded filomicelles produced an immediate response as the tumor size shrunk 20% in 3 days, and 45% in 13 days compared with control. Tumors treated with OBCL–TAX filomicelles produced 30% shrinkage from initial size, which suggests potency greater than or equal to that of OCL–TAX filomicelles toward the same cancer cells in vivo (Figure 5B). Also, despite the potential for any amphiphilic copolymer to lyse blood cells after intravenous injection, no statistically significant change in the number of any blood cells was measured with TAX filomicelles (Figure 5C). However, trends are consistent with TAX stabilization of microtubules in blood stem cells and progenitors, thereby favoring (at the expense of other lineages) high ploidy/aneuploidy megakaryocytes, which generate more platelets.
Figure 5. . In vivo performance of PEG–PBCL filomicelles.
(A) In vivo tumor shrinkage obtained in NOD-SCID mice with tumors established from A549 lung cancer cell line. Four injections of PEG–PBCL filomicelles loaded with TAX were given, with each dose 3 days apart. Tumors treated with drug-loaded PEG–PBCL filomicelles shrink 27% in volume from initial size after 13 days, while the untreated control grows by 15%. (B) Comparison of tumor shrinkage obtained after 13 days of treatment. While PEG–PBCL-loaded filomicelles led to lower tumor shrinkage than PEG–PCL counterparts, the TAX dosage was one-fourth of the latter. OCL–TAX at 10 mg/kg could not produce sustained shrinkage, and consequently, the final tumor size was not much smaller than initial size. OCL data from [31]. (C) Mice treated with PEG–PBCL filomicelles loaded with TAX did not exhibit adverse change in thrombocrit, hematocrit or monocyte numbers. The changes were not significant in all three cases, thus underlining the ability of these filomicelles to safely deliver drug to the tumors.
Discussion
Benzyl groups linked to the polycaprolactone backbone via a hydrolysable ester group are similar to ester groups between caprolactone monomers, and so this cleavable linker should and does ensure that filomicelles are stable at physiological pH (e.g., while circulating in the blood) while also hydrolyzing at low pH (like that found in endolysosomes). The same method of filomicelle formation (chloroform evaporation during hydration) was employed in this study as in our earlier studies [13] in order to eliminate any impact on phase behavior due to processing, but it seems likely that a separate phase diagram (Figure 1C) is required for different molecular weight PEG blocks as noted in [13]. Nonetheless, spherical micelles tend to be favored whenever the hydrophilic fraction is increased through a decrease in hydrophobic mass, consistent with general ideas of micelle formation and with degradation of filomicelle cores generating shorter lengths and spheres. While PEG–PBCL samples formed filomicelles (average filomicelle length was 23 μm ± 8 μm, mean ± S.D.) which was twice as long as PEG–PCL filomicelles [13], role of the incorporated aromatic group in extending the length of worms would benefit from further study because of the different molecular weights of PEG blocks used in the two polymers. Importantly, higher drug loading in PEG–PBCL filomicelles justified inclusion of an aromatic group in the core (Figure 1E) and also implied a high partition coefficient in the core [11]. Drug release times of many days for the filomicelles (Figure 1D, F) combined with the fact that filomicelles circulate in vivo for up to a week [8] imply minimal release before tumor accumulation. Rapid release at low pH favors not only endoslysomal escape [32,33], but also release due to the lower pH prevailing in tumors [34,35].
Loading TAX into PEG–PBCL filomicelles reduced the IC50 by more than an order of magnitude compared with free drug for both cell lines tested here (Figure 3A & C). In addition to a 2.5-fold difference in IC50 between the OCL and OBCL filomicelles, empty OBCL filomicelles were an order of magnitude less toxic than OCL filomicelles (Figure 3B). At high concentrations, even empty filomicelles became toxic to the cells, presumably due to disruption of the cell's lipid bilayer by these detergent-like amphiphiles [16,17]. Even slow degradation of the free end of the CL block also converts a cylinder-forming amphiphile to a higher curvature sphere-former that will be more disruptive to membranes [10]. With free drug, cell viability decreased from day 1 to day 2, but then increased from day 2 to day 3 (Figure 3C), which is perhaps due to degradation of TAX by hydrolysis [36,37] that occurs over days [38,39]. Nanocarrier cores can protect against such hydrolysis, with PCL cores protecting cisplatin from degradation [40] and a protective effect might explain the decrease in cell viability with TAX filomicelles from day 1 to 2 and day 2 to 3 (Figure 3D).
A hallmark of TAX treated nuclei is higher DNA accumulation due to incomplete cell division, and a histogram of DNA intensities of treated cells revealed a majority of aneuploid cells (Figure 4A). Moreover, cells treated with filomicelle-TAX appear in flow cytometry to have a narrower distribution of ploidy than free TAX (Figure 4B), and heterogeneity in surviving cells has been thought to increase the chances of a drug-resistant cell [41,42]. In particular, low ploidy cells with DNA content similar to untreated cells likely unaffected by free drug. Furthermore, OBCL filomicelles not only induce more cell death than OCL, but the surviving cells exhibit a higher level of aneuploidy (Figure 4C). Importantly, higher levels of aneuploidy suggest a worse prognosis for affected cells [43]. All three treatment groups (free, PEG–PCL and PEG–PBCL TAX) exhibited a decrease in aneuploidy, with such cells likely dying after drug was washed away, but even after 3 days of recovery, PEG–PBCL treated cells showed the highest levels of aneuploidy, suggesting that TAX loading onto PEG–PBCL filomicelles might be a more durable or potent treatment.
Initial in vivo tests showed that PEG–PBCL filomicelles shrunk tumors in vivo in mice with A549 xenografts (Figure 5A & B). While saline-injected controls grew consistently here and past studies already showed no effects of empty filomicelles, tumors treated with TAX-loaded PEG–PBCL filomicelles (injected at 4.5 mg/kg) shrank by 25% or more in 2 weeks. For comparison, mice treated with TAX-loaded PEG–PCL filomicelles at four-fold higher dose (18 mg/kg) show tumor shrinkage for the first week but then a constant tumor size [31], and mice treated with free TAX at the maximum dose of 1 mg/kg exhibit only a small tumor shrinkage initially, before regrowing, consistent with resistance and relapse. Also noteworthy was that PEG–PCL spheres injected at 8 mg/kg produced tumor shrinkage for the first week [31], as with PEG–PCL filomicelles and then tumors regrew. Continuous shrinkage obtained with PEG–PBCL suggests a more durable or potent treatment without significant change in hematocrit, thrombocrit or monocyte counts in treated mice (Figure 5C), consistent with low toxicity of PEG–PBCL filomicelles.
Conclusion
We have shown that changing the core chemistry to incorporate aromatic groups in the polymer backbone can load higher doses of an aromatic chemotherapeutic, Paclitaxel. Despite the possibility of rigidifying interactions such as ring-stacking (as occurs in a DNA double helix), these aromatic filomicelles are not rigid and readily deliver to cells. TAX filomicelles maximized cell death and minimized toxicity as empty nanocarriers. These aromatic filomicelles also maximized aneuploidy among surviving cells. Initial tests of in vivo treatment showed a continuous shrinkage with time at moderate TAX dosage. Overall, these filomicelles of TAX provide a more potent and potentially durable treatment in vivo as well as in vitro.
Executive summary.
Aim
Nanocarrier delivery is more efficient than free drug.
Flexible cylindrical micelles, which circulate longer than spherical counterparts, lead to the possibility of higher drug delivery to the tumor.
Common chemotherapeutics often include aromatic groups, and the incorporation of the same in filomicelle core can help delivery.
Results
PEG–PBCL worms load higher amounts of drug than aliphatic PEG–PCL.
Exhibit higher stability and lower drug leakage at physiological pH.
Remain flexible enough to potentially avoid phagocytosis.
They induce more cell death and aneuploidy in surviving cells.
Shrink tumors in vivo in NOD-SCID mice.
Discussion
Slow drug release in physiological conditions make OBCL worms safer than OCL.
TAX-loaded OBCL worms had lower IC50 than corresponding OCL worms across two different cell lines.
Loading of TAX onto nanocarrier cores may help protect it from degradation via hydrolysis.
OBCL worms induced most aneuploidy, with highest recovery periods.
OBCL worms induced consistent shrinkage in vivo at one-fourth TAX dosage than previous studies.
Footnotes
Financial & competing interests disclosure
The authors have no relevant affiliations or financial involvement with any organization or entity with a financial interest in or financial conflict with the subject matter or materials discussed in the manuscript. This includes employment, consultancies, honoraria, stock ownership or options, expert testimony, grants or patents received or pending, or royalties.
No writing assistance was utilized in the production of this manuscript.
Ethical conduct of research
The authors state that they have obtained appropriate institutional review board approval or have followed the principles outlined in the Declaration of Helsinki for all human or animal experimental investigations. In addition, for investigations involving human subjects, informed consent has been obtained from the participants involved.
References
Papers of special note have been highlighted as: • of interest; •• of considerable interest
- 1.Kipp JE. The role of solid nanoparticle technology in the parenteral delivery of poorly water-soluble drugs. Int. J. Pharm. 2004;284(1):109–122. doi: 10.1016/j.ijpharm.2004.07.019. [DOI] [PubMed] [Google Scholar]
- 2.Demain AL, Vaishnav P. Natural products for cancer chemotherapy. Microb. Biotechnol. 2011;4(6):687–699. doi: 10.1111/j.1751-7915.2010.00221.x. [DOI] [PMC free article] [PubMed] [Google Scholar]
- 3.Vines T, Faunce TA. Assessing the safety and cost-effectiveness of early nanodrugs. J. Law Med. 2009;16(5):822–45. [PubMed] [Google Scholar]
- 4.Jordan MA, Wendell K, Gardiner S, Derry WB, Copp H, Wilson L. Mitotic block induced in HeLa cells by low concentrations of paclitaxel (Taxol) results in abnormal mitotic exit and apoptotic cell death. Cancer Res. 1996;56(4):816–825. [PubMed] [Google Scholar]
- 5.Long BH, Fairchild CR. Paclitaxel inhibits progression of mitotic cells to G1 phase by interference with spindle formation without affecting other microtubule functions during anaphase and telophase. Cancer Res. 1994;54(16):4355–4361. [PubMed] [Google Scholar]
- 6.Cheng GZ, Chan J, Wang Q, Zhang W, Sun CD, Wang LH. Twist transcriptionally up-regulates AKT2 in breast cancer cells leading to increased migration, invasion, and resistance to Paclitaxel. Cancer Res. 2007;67(5):1979–1987. doi: 10.1158/0008-5472.CAN-06-1479. [DOI] [PubMed] [Google Scholar]
- 7.Kamath K, Wilson L, Cabral F, Jordan MA. βIII-tubulin induces paclitaxel resistance in association with reduced effects on microtubule dynamic instability. J. Biol. Chem. 280(13):12902–12907. doi: 10.1074/jbc.M414477200. [DOI] [PubMed] [Google Scholar]
- 8.Geng Y, Dalhaimer P, Cai S, et al. Shape effects of filaments versus spherical particles in flow and drug delivery. Nat. Nanotechnol. 2007;2(4):249–255. doi: 10.1038/nnano.2007.70. [DOI] [PMC free article] [PubMed] [Google Scholar]; •• Explores the advantage of filomicelles over spherical counterparts.
- 9.Cui H, Chen Z, Zhong S, Wooley KL, Pochan DJ. Block copolymer assembly via kinetic control. Science. 2007;317(5838):647–650. doi: 10.1126/science.1141768. [DOI] [PubMed] [Google Scholar]
- 10.Cai S, Vijayan K, Cheng D, Lima EM, Discher DE. Micelles of different morphologies – advantages of worm-like filomicelles of PEO-PCL in paclitaxel delivery. Pharm. Res. 2007;24(11):2099–2109. doi: 10.1007/s11095-007-9335-z. [DOI] [PubMed] [Google Scholar]; •• Protocol source for release and cell viability studies.
- 11.Loverde SM, Klein ML, Discher DE. Nanoparticle shape improves delivery: rational coarse grain molecular dynamics (rCG MD) of taxol in worm-like PEG-PCL micelles. Adv. Mater. 2012;24(28):3823–3830. doi: 10.1002/adma.201103192. [DOI] [PMC free article] [PubMed] [Google Scholar]
- 12.Gref R, Lück M, Quellec P, et al. ‘Stealth’ corona-core nanoparticles surface modified by polyethylene glycol (PEG): influences of the corona (PEG chain length and surface density) and of the core composition on phagocytic uptake and plasma protein adsorption. Colloids Surf. B Biointerfaces. 2000;18(3):301–313. doi: 10.1016/s0927-7765(99)00156-3. [DOI] [PubMed] [Google Scholar]
- 13.Rajagopalan K, Mahmud A, Christian DA, et al. Curvature-coupled hydration of semicrystalline polymer amphiphiles yields flexible worm micelles but favors rigid vesicles: polycaprolactone-based block copolymers. Macromolecules. 2010;43(23):9736–9746. doi: 10.1021/ma101316w. [DOI] [PMC free article] [PubMed] [Google Scholar]; •• Discusses the importance of flexibility of filomicelles, motivation for measuring persistence length of PEG–PBCL filomicelles.
- 14.Ahmed F, Discher DE. Self-porating polymersomes of PEG–PLA and PEG–PCL: hydrolysis-triggered controlled release vesicles. J. Control. Release. 2004;96(1):37–53. doi: 10.1016/j.jconrel.2003.12.021. [DOI] [PubMed] [Google Scholar]
- 15.Ulmschneider MB, Sansom MS. Amino acid distributions in integral membrane protein structures. Biochim. Biophys. Acta. 2001;1512(1):1–14. doi: 10.1016/s0005-2736(01)00299-1. [DOI] [PubMed] [Google Scholar]
- 16.Vega-Villa KR, Takemoto JK, Yáñez JA, Remsberg CM, Forrest ML, Davies NM. Clinical toxicities of nanocarrier systems. Adv. Drug Deliv. Rev. 2008;60(8):929–938. doi: 10.1016/j.addr.2007.11.007. [DOI] [PubMed] [Google Scholar]
- 17.Moghimi SM, Hunter AC, Murray JC. Nanomedicine: current status and future prospects. FASEB J. 2005;19(3):311–330. doi: 10.1096/fj.04-2747rev. [DOI] [PubMed] [Google Scholar]
- 18.Vasir JK, Labhasetwar V. Quantification of the force of nanoparticle-cell membrane interactions and its influence on intracellular trafficking of nanoparticles. Biomaterials. 2008;29(31):4244–4252. doi: 10.1016/j.biomaterials.2008.07.020. [DOI] [PMC free article] [PubMed] [Google Scholar]
- 19.Wang AZ, Langer R, Farokhzad OC. Nanoparticle delivery of cancer drugs. Annu. Rev. Med. 2012;63:185–198. doi: 10.1146/annurev-med-040210-162544. [DOI] [PubMed] [Google Scholar]
- 20.Alexis F, Pridgen E, Molnar LK, Farokhzad OC. Factors affecting the clearance and biodistribution of polymeric nanoparticles. Mol. Pharm. 2008;5(4):505–515. doi: 10.1021/mp800051m. [DOI] [PMC free article] [PubMed] [Google Scholar]
- 21.De Jong WH, Borm PJA. Drug delivery and nanoparticles: applications and hazards. Int. J. Nanomed. 2008;3(2):133–149. doi: 10.2147/ijn.s596. [DOI] [PMC free article] [PubMed] [Google Scholar]
- 22.Dvorak HF. Leaky tumor vessels: consequences for tumor stroma generation and for solid tumor therapy. Prog. Clin. Biol. Res. 1989;354:317–330. [PubMed] [Google Scholar]
- 23.Maeda H. The enhanced permeability and retention (EPR) effect in tumor vasculature: the key role of tumor-selective macromolecular drug targeting. Adv. Enzyme Regul. 2001;41(1):189–207. doi: 10.1016/s0065-2571(00)00013-3. [DOI] [PubMed] [Google Scholar]
- 24.Iyer AK, Khaled G, Fang J, Maeda H. Exploiting the enhanced permeability and retention effect for tumor targeting. Drug Discov. Today. 2006;11(17):812–818. doi: 10.1016/j.drudis.2006.07.005. [DOI] [PubMed] [Google Scholar]
- 25.Wang J, Mao W, Lock LL, et al. The Role of micelle size in tumor accumulation, penetration, and treatment. ACS Nano. 2015;9(7):7195–7206. doi: 10.1021/acsnano.5b02017. [DOI] [PubMed] [Google Scholar]
- 26.Blanazs A, Armes SP, Ryan AJ. Self-assembled block copolymer aggregates: from micelles to vesicles and their biological applications. Macromol. Rapid Commun. 2009;30(4):267–277. doi: 10.1002/marc.200800713. [DOI] [PubMed] [Google Scholar]
- 27.Chen W, Meng F, Cheng R, Zhong Z. pH-Sensitive degradable polymersomes for triggered release of anticancer drugs: a comparative study with micelles. J. Control. Release. 2010;142(1):40–46. doi: 10.1016/j.jconrel.2009.09.023. [DOI] [PubMed] [Google Scholar]
- 28.Molavi O, Ma Z, Mahmud A, Alshamsan A, et al. Polymeric micelles for the solubilization and delivery of STAT3 inhibitor cucurbitacins in solid tumors. Int. J. Pharm. 2008;347(1):118–127. doi: 10.1016/j.ijpharm.2007.06.032. [DOI] [PMC free article] [PubMed] [Google Scholar]; • PEG–PBCL utilized to form spherical micelles for cucurbitacin delivery.
- 29.Xiong XB, Mahmud A, Uludağ H, Lavasanifar A. Multifunctional polymeric micelles for enhanced intracellular delivery of doxorubicin to metastatic cancer cells. Pharm. Res. 2008;25(11):2555–2566. doi: 10.1007/s11095-008-9673-5. [DOI] [PubMed] [Google Scholar]; • PEG–PBCL utilized to form spherical micelles for Doxorubicin delivery.
- 30.Lodish H, Berk A, Zipursky SL, et al. Molecular Cell Biology (4th Edition) WH Freeman; NY, USA: 2000. Section 15.1, Diffusion of small molecules across phospholipid bilayers. [Google Scholar]
- 31.Christian DA, Cai S, Garbuzenko OB, et al. Flexible filaments for in vivo imaging and delivery: persistent circulation of filomicelles opens the dosage window for sustained tumor shrinkage. Mol. Pharm. 2009;6(5):1343–1352. doi: 10.1021/mp900022m. [DOI] [PMC free article] [PubMed] [Google Scholar]; •• In vivo studies with Tax-loaded PEG–PCL filomicelles.
- 32.Varkouhi AK, Scholte M, Storm G, Haisma HJ. Endosomal escape pathways for delivery of biologicals. J. Control. Release. 2011;151(3):220–228. doi: 10.1016/j.jconrel.2010.11.004. [DOI] [PubMed] [Google Scholar]
- 33.Miyata K, Christie RJ, Kataoka K. Polymeric micelles for nano-scale drug delivery. React. Funct. Polym. 2011;71(3):227–234. [Google Scholar]
- 34.Lee ES, Gao Z, Bae YH. Recent progress in tumor pH targeting nanotechnology. J. Control. Release. 2008;132(3):164–170. doi: 10.1016/j.jconrel.2008.05.003. [DOI] [PMC free article] [PubMed] [Google Scholar]
- 35.Lee ES, Na K, Bae YH. Polymeric micelle for tumor pH and folate-mediated targeting. J. Control. Release. 2003;91(1):103–113. doi: 10.1016/s0168-3659(03)00239-6. [DOI] [PubMed] [Google Scholar]
- 36.Tian J, Stella VJ. Degradation of Paclitaxel and related compounds in aqueous solutions II: nonepimerization degradation under neutral to basic pH conditions. J. Pharm. Sci. 2008;97(8):3100–3108. doi: 10.1002/jps.21214. [DOI] [PubMed] [Google Scholar]
- 37.Nikolic V, Savic I, Savic I, Nikolic L, Stankovic M, Marinkovic V. Paclitaxel as an anticancer agent: isolation, activity, synthesis and stability. Open Med. 2011;6(5):527–536. [Google Scholar]
- 38.Amini-Fazl MS, Mobedi H, Barzin J. Investigation of aqueous stability of taxol in different release media. Drug Dev. Indust. Pharm. 2014;40(4):519–526. doi: 10.3109/03639045.2013.771646. [DOI] [PubMed] [Google Scholar]
- 39.Richheimer SL, Tinnermeier DM, Timmons DW. High-performance liquid chromatographic assay of taxol. Anal. Chem. 1992;64(20):2323–2326. doi: 10.1021/ac00044a004. [DOI] [PubMed] [Google Scholar]
- 40.Surnar B, Sharma K, Jayakannan M. Core–shell polymer nanoparticles for prevention of GSH drug detoxification and cisplatin delivery to breast cancer cells. Nanoscale. 2015;7(42):17964–17979. doi: 10.1039/c5nr04963f. [DOI] [PubMed] [Google Scholar]
- 41.Marusyk A, Polyak K. Tumor heterogeneity: causes and consequences. Biochim. Biophys. Acta. 2010;1805(1):105–117. doi: 10.1016/j.bbcan.2009.11.002. [DOI] [PMC free article] [PubMed] [Google Scholar]
- 42.Brooks MD, Burness ML, Wicha MS. Therapeutic implications of cellular heterogeneity and plasticity in breast cancer. Cell Stem Cell. 2015;17(3):260–271. doi: 10.1016/j.stem.2015.08.014. [DOI] [PMC free article] [PubMed] [Google Scholar]
- 43.Gordon DJ, Resio B, Pellman D. Causes and consequences of aneuploidy in cancer. Nat. Rev. Genet. 2012;13(3):189–203. doi: 10.1038/nrg3123. [DOI] [PubMed] [Google Scholar]


